

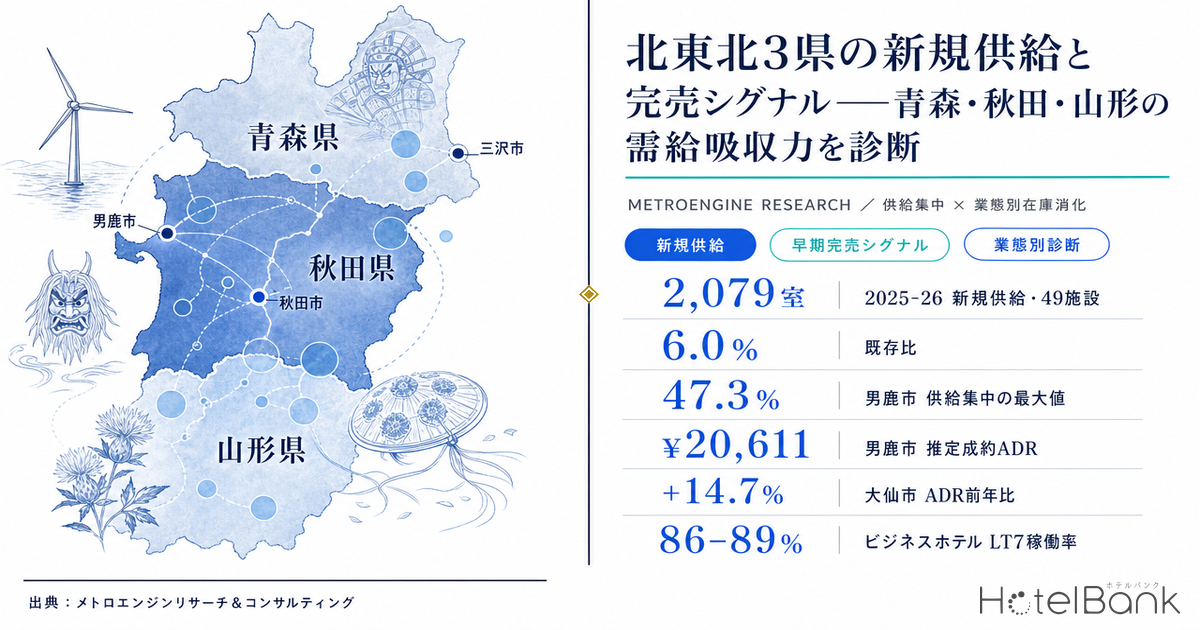
Across the three prefectures of North Tohoku — Aomori, Akita and Yamagata — new supply equivalent to roughly 6% of the existing guest-room stock was added between 2025 and 2026. That is a small figure by national standards, but because the new rooms landed in a handful of specific cities, the supply-demand picture looks completely different once you drop to the city level. Using MetroEngines Research data, this report cross-references new supply volume, room-level sell-out signals and inventory absorption speed by property type across the three prefectures, and quantifies which segments still have room to absorb demand.
Metric Definitions Used in This Article
- ADR (average daily rate): An estimated settled rate (tax-exclusive equivalent) calculated by applying property-type correction coefficients to the lowest publicly listed plan rate each property posts on OTAs (double occupancy, per-room rate, tax included). Cross-checked against property-level actuals disclosed by listed hotel REITs (91 properties, most recent three months), the median error is approximately 7%. These are estimates and differ from each property’s actual transacted prices or accounting figures. Area-level ADR is the median across the target properties (the level of a typical property in that area).
- OCC (occupancy rate): The share of sold rooms against total guest rooms in the area (an estimate based on OTA-listed inventory). This article uses the value at lead time 7 days, where observation is most stable. It is an estimate based on how listed OTA inventory is absorbed, and differs from a property’s true overall occupancy.
- LT (lead time): Days remaining until check-in. LT0 = the check-in date itself.
- Early sell-out LT: The lead time at which remaining rooms first reached zero (the larger the value, the earlier the property filled). “Early sell-out” in this article means a property’s remaining inventory reached zero at least 7 days before check-in.
- Data source: MetroEngines Research & Consulting
- — 2,079 rooms (49 properties) entered the three prefectures in 2025-26, equal to 6.0% of existing stock. But the placement is extremely uneven: 13.4% in Akita City, 30.0% in Misawa and 47.3% in Oga — at city level the picture changes entirely.
- — The correlation between supply concentration and year-on-year estimated settled ADR is −0.08. The only cities that grew rate were Daisen at +14.7% and Misawa at +11.2% — both with firm weekday or date-specific demand.
- — LT7 occupancy runs 86-89% for business hotels and 85-88% for city hotels, against 69-81% for ryokan. Limited-service is tight; ryokan and resorts (Akita 65.4%, Yamagata 67.7%) retain absorption headroom.
- — Early sell-out rates for ryokan over Golden Week were below 10% in all three prefectures, versus 68-94% over the Marine Day long weekend. Demand is concentrated in summer, and business plans premised on year-round smoothing do not match that seasonal structure.
- — Listed REITs own just 4 properties across the three prefectures (all held by Invincible Investment Corporation). Restricted to 100+ rooms, only three — all in Aomori; Yamagata has none. For local players and regional lenders, this is a market with thin competition.
Supply Volume Is Small, but Concentration Is Extreme — 2,079 Rooms in Two Years, 548 of Them in Akita City
Start with the supply side. Aggregating newly opened properties whose OTA listings MetroEngines Research could confirm, Aomori, Akita and Yamagata took in 42 properties and 1,525 rooms in 2025, and 7 properties and 554 rooms in 2026. That is 49 properties and 2,079 rooms over two years — a 6.0% increase against the 34,592 tracked existing rooms.
By prefecture, Akita shows the steepest growth rate. Adding 2026’s 166 rooms to 2025’s 711 gives 877 rooms, or 8.6% of its existing stock of 10,161. Aomori follows at 776 rooms (6.0%) and Yamagata at 426 rooms (3.7%). Given that annual supply growth of several percent is the norm across Japan’s major metropolitan markets, these levels are by no means excessive.
Note: New-opening data is counted once an OTA listing is confirmed. Because listings typically begin several months before opening, the most recent months and years may see property and room counts rise as further listings appear. The 2026 figures should be read as a confirmed lower bound at this point in time.
The issue is not the total, but the distribution. Of the 2,079 rooms added in 2025-2026, 548 rooms (26%) were concentrated in three properties in Akita City — a single-shot addition equal to 13.4% of the city’s existing 4,081 rooms. Oga is more extreme still: onto a market of 404 existing rooms came 30 rooms in 2025 and 161 in 2026, for 191 rooms in total (47.3%). Misawa took 259 rooms (30.0%) against 863 existing rooms in August 2025. Meanwhile cities such as Odate, Yurihonjo and Kaminoyama saw zero new supply over the two years. A framework for judging city-by-city absorption headroom by overlaying supply volume with demand-side sell-out signals is set out for eight cities nationwide in Supply Absorption Headroom in Regional Core Cities.
Seven Properties Opened or Scheduled to Open in 2026
| Property | Location | Rooms | Opening | Type | Developer / Operator |
|---|---|---|---|---|---|
| Tabino Hotel Aomori Rokkasho (たびのホテル青森六ヶ所村) | Aomori (Rokkasho Village) | 210 | 2026-10-02 | Extended-stay hotel | Sun Frontier Hotel Management |
| Hotel Kinoshita Akita Oga Ekimae (ホテル木下 秋田男鹿駅前) | Akita (Oga City) | 161 | 2026-03-05 | Business hotel | Kinoshita Real Estate Development (Kinoshita Group) |
| HOTEL YUZUKI | Yamagata (Yamagata City) | 72 | 2026-03-23 | Business hotel | — |
| KAI Zao (界 蔵王) | Yamagata (Yamagata City, Zao Onsen) | 49 | 2026-10-15 | Resort hotel | Hoshino Resorts |
| Stay in Hotels Fukujuan (Stay in Hotels 福住庵) | Yamagata (Tsuruoka City) | 32 | 2026-04-17 | Business hotel | — |
| Hotel Stay in Sun Annex (ホテルステイインサンアネックス) | Yamagata (Yamagata City) | 25 | 2026-02-16 | Hostel | — |
| Hohoemi no Sato Kannon-yu (ほほえみの郷観音湯) | Akita (Yuzawa City) | 5 | 2026-03-25 | Ryokan | — |
The two largest of these seven properties account for 67% of the 554 rooms. And both are tied to industrial siting rather than tourism demand.
The Two Largest Projects Sit on Energy Sites — Targeting a Different Demand Curve from Tourism
What these two share is that the character of their demand is construction, maintenance and posted-worker stays rather than tourism. Specifications such as extended-stay rooms and in-room washing machines signal a premise of consecutive-night demand including weekdays, not weekend-skewed leisure. Put the other way round, the economics of these projects will be driven by the schedule of energy-related projects rather than by highly seasonal leisure demand. Any entry decision needs to read the project-side timetable alongside the lodging market indicators.
Supply Concentration and ADR Do Not Move in Lockstep — the Dividing Line Is the Character of Demand
Does rate growth stall in cities that absorbed concentrated supply? Plotting the 17 principal cities and towns across the three prefectures — supply concentration on the horizontal axis (2025-2026 new rooms divided by existing rooms) against year-on-year change in estimated settled ADR on the vertical (trailing 12 months versus the same period a year earlier) — gives a correlation coefficient of just -0.08. No clear negative relationship is visible.
What does emerge is a split among the cities that took in supply. Misawa carries a high supply concentration of 30.0% yet posted ADR growth of +11.2%, the second highest of the three prefectures, while Daisen leads at +14.7%. At the other end, Akita City managed +1.5% against a 13.4% supply injection, Oga +0.2% against 47.3%, and Tendo -3.8% against 5.5% — rate growth has stalled.
The dividing factor appears to be the character of demand. Misawa has corporate demand including business tied to the air base; Daisen hosts one of Japan’s foremost fireworks festivals, a date-fixed demand magnet. Both have structures that make it easy to hold rate on weekdays or specific dates. Oga and Tendo, by contrast, are led by onsen leisure, where demand clusters on weekends and in particular seasons. Faced with the same supply increase, cities with smoothed demand absorb it through rate, while season-skewed cities absorb it through occupancy.
One caveat on Oga: its 161 rooms opened in March 2026, so only four months of the trailing 12 are affected. The city’s ADR trajectory will not be properly testable until the second half of 2026.
Supply Concentration and ADR Levels Across 17 Principal Cities and Towns
| City / Town | Prefecture | Rooms | New 2025-26 | Supply Concentration | Est. Settled ADR | YoY |
|---|---|---|---|---|---|---|
| Aomori City | Aomori | 4,064 | 122 | 3.0% | ¥10,044 | +0.8% |
| Hirosaki | Aomori | 2,141 | 13 | 0.6% | ¥7,449 | +9.2% |
| Hachinohe | Aomori | 3,107 | 57 | 1.8% | ¥6,718 | +5.8% |
| Misawa | Aomori | 863 | 259 | 30.0% | ¥6,632 | +11.2% |
| Mutsu | Aomori | 760 | 53 | 7.0% | ¥6,720 | +5.4% |
| Akita City | Akita | 4,081 | 548 | 13.4% | ¥7,355 | +1.5% |
| Oga | Akita | 404 | 191 | 47.3% | ¥20,611 | +0.2% |
| Odate | Akita | 1,115 | 0 | 0.0% | ¥6,312 | +6.1% |
| Yurihonjo | Akita | 466 | 0 | 0.0% | ¥7,144 | +4.3% |
| Daisen | Akita | 577 | 50 | 8.7% | ¥6,736 | +14.7% |
| Semboku | Akita | 946 | 20 | 2.1% | ¥12,501 | +5.1% |
| Yamagata City | Yamagata | 4,313 | 210 | 4.9% | ¥12,250 | +11.8% |
| Yonezawa | Yamagata | 1,382 | 71 | 5.1% | ¥9,410 | +9.5% |
| Tsuruoka | Yamagata | 2,407 | 32 | 1.3% | ¥9,737 | +2.8% |
| Tendo | Yamagata | 1,323 | 73 | 5.5% | ¥8,685 | -3.8% |
| Kaminoyama | Yamagata | 696 | 0 | 0.0% | ¥16,523 | +4.5% |
| Sakata | Yamagata | 1,145 | 4 | 0.3% | ¥6,047 | +5.1% |
Sell-Out Signals Cluster in a Single Summer Window — Ryokan Golden Week Rates Are Below 10% in All Three Prefectures
Now the demand side, seen through room-level inventory data. Here “early sell-out” is defined as a property’s remaining OTA inventory reaching zero at least seven days before check-in, and we compare the share of properties meeting that test across two confirmed peak periods. The sample is limited to properties publishing at least 30% of their total rooms to OTAs (where the published allotment is small, the property may be running a direct-booking-led or drip-feed inventory strategy, and a sell-out test does not hold).
The result is stark. Early sell-out rates for ryokan over Golden Week came in below 10% everywhere: Aomori 5.9% (N=34 properties), Akita 6.8% (N=44), Yamagata 5.7% (top 100 of 106 properties in the sample confirmed). Business hotels over the same period reached 30.9% in Aomori (N=55), 27.5% in Akita (N=40) and 55.6% in Yamagata (N=45) — a five- to ten-fold gap between property types.
Over the three-day weekend including Marine Day in July, however, the picture inverts. Ryokan early sell-out rates jump to 93.8% in Akita (N=48), 76.9% in Aomori (N=39) and 68.4% in Yamagata (top 100 of 114 properties confirmed), while business hotels also reach high levels at 91.7% in Aomori (N=48), 80.6% in Akita (N=36) and 76.9% in Yamagata (N=39).
In short, ryokan and resort demand in North Tohoku is heavily skewed toward summer rather than the spring holiday cluster. Early May, once the cherry blossom season has passed, is still “too early” in the year for travellers from the Kanto and Kansai regions; the market only tightens from July onward. Any business plan premised on lifting occupancy across the full year needs to be checked against this seasonal structure. How the festival demand concentrated in early August shows up in rate and inventory is tracked for Aomori, Akita and Sendai in Booking Pace for Tohoku’s Three Great Festivals 2026.
Properties Recording Early Sell-Outs over the Marine Day Weekend (7 selected from the top of each prefecture’s ranking, for reference)
| Prefecture | Property | Total Rooms | Early Sell-Out LT | Days Sold Out | OTA Allotment |
|---|---|---|---|---|---|
| Aomori | Hotel Unisite Mutsu (ホテルユニサイトむつ) | 135 | LT87 | 3 | 31.1% |
| Aomori | Super Hotel Hachinohe Tennen Onsen (スーパーホテル 八戸天然温泉) | 95 | LT90 | 3 | 44.2% |
| Akita | Hotel Foresta Chokai (ホテル フォレスタ鳥海) | 50 | LT76 | 3 | 42.0% |
| Akita | Omagari Empire Hotel (大曲エンパイヤホテル) | 29 | LT74 | 3 | 44.8% |
| Yamagata | Hotel Inn Sakata (ホテル イン 酒田) | 235 | LT90 | 3 | 63.8% |
| Yamagata | Hotel Route Inn Sakata (ホテルルートイン酒田) | 156 | LT90 | 3 | 46.8% |
| Yamagata | Meitousha So (名湯舎 創) | 34 | LT76 | 3 | 44.1% |
Early sell-out LT is the earliest lead time at which remaining rooms reached zero across the three days. LT90, for example, means the property’s published OTA inventory for that date was already absorbed 90 days before check-in.
Supply-Demand Diagnosis by Property Type — Business and City Hotels Are Tight, Ryokan and Resorts Have Headroom
Alongside peak-date signals, it is worth checking how quickly inventory is absorbed across a full month. The chart below traces occupancy (estimated, based on OTA-listed inventory) by property type for July 2026 check-ins, from 90 days out to the day itself.
Business hotel curves lift from LT30 onward in all three prefectures, reaching 86-89% at LT7. Ryokan start at a similar level to business hotels at LT90 but climb more slowly thereafter, ending at 79.2% in Aomori, 80.6% in Akita and 69.4% in Yamagata at LT7. On the question of how much last-minute demand fills the house, the gap between property types is unmistakable.
| Prefecture × Type | Properties | Rooms | LT30 Occupancy | LT7 Occupancy | Diagnosis |
|---|---|---|---|---|---|
| Aomori — Business hotel | 80 | 8,789 | 77.0% | 89.0% | Tight |
| Aomori — City hotel | 16 | 1,646 | 78.0% | 86.4% | Tight |
| Aomori — Resort hotel | 6 | 478 | 87.0% | 88.3% | Tight |
| Aomori — Ryokan | 54 | 1,867 | 75.4% | 79.2% | Headroom |
| Akita — City hotel | 14 | 1,753 | 78.6% | 88.2% | Tight |
| Akita — Business hotel | 51 | 5,231 | 80.4% | 87.7% | Tight |
| Akita — Ryokan | 73 | 2,384 | 76.6% | 80.6% | Balanced |
| Akita — Resort hotel | 6 | 179 | 50.3% | 65.4% | Headroom |
| Yamagata — Business hotel | 54 | 5,623 | 77.4% | 86.4% | Tight |
| Yamagata — City hotel | 11 | 1,184 | 76.2% | 84.9% | Balanced |
| Yamagata — Ryokan | 153 | 3,707 | 61.8% | 69.4% | Headroom |
| Yamagata — Resort hotel | 16 | 626 | 58.9% | 67.7% | Headroom |
The diagnostic thresholds are LT7 occupancy of 85% or above for “Tight”, 80-85% for “Balanced” and below 80% for “Headroom”. On that basis, business and city hotels sit at or near the tight end in all three prefectures, while ryokan show headroom in Aomori and Yamagata and balance in Akita — in every case below business and city hotels. Resort hotels vary most by prefecture: Aomori is tight at 88.3%, while Akita at 65.4% and Yamagata at 67.7% carry substantial headroom.
Akita City is the case worth dwelling on. It absorbed 548 rooms in 2025 (13.4% of existing stock), yet Akita Prefecture’s business hotels held LT7 occupancy of 87.7% for July 2026 check-ins. Occupancy did not fall even immediately after a large supply injection. Read together with rate growth limited to +1.5%, Akita City can be characterised as a market that absorbed supply through occupancy while holding rate flat. Lodging demand there had enough depth to take up the added supply — an encouraging signal when considering the next entry opportunity.
For reference, the Japan Tourism Agency’s Accommodation Travel Statistics put the national room occupancy rate for 2025 at 61.6% for the year (business hotels 75.3%, city hotels 74.1%, resort hotels 56.9%, ryokan 38.2%). The estimates in this article measure absorption of OTA-listed inventory and are defined differently from statistics covering a property’s true overall occupancy, so levels cannot be compared directly — but the ordering by property type (business and city high, ryokan low) is consistent across both.
Sensitivity of Supply Absorption — the Demand Growth Needed to Hold Occupancy
Using the figures above, it is worth mechanically checking how added supply feeds through to occupancy. Since occupancy is rooms sold ÷ rooms supplied, writing the growth rate of demand (rooms sold) as gd and the growth rate of supplied rooms as gs, post-supply occupancy is given by the identity occupancy × (1 + gd) ÷ (1 + gs). The starting point is the LT7 occupancy of 87.7% for Akita Prefecture business hotels (July 2026 check-ins) confirmed above. What follows is arithmetic using only figures already stated in this article; it asserts no new measurement or forecast.
| Scenario | Demand-side assumption | Resulting LT7 occupancy | vs. current | Diagnosis |
|---|---|---|---|---|
| Pessimistic | Demand flat (0% growth) | 77.3% | -10.4pt | Headroom |
| Base | Demand grows in line with supply (+13.4%) | 87.7% | +0.0pt | Tight |
| Optimistic | Demand outgrows supply (+20.0%) | 92.8% | +5.1pt | Tight |
To absorb Akita City’s 548 rooms (13.4% of existing stock) without any loss of occupancy, demand must grow by the same 13.4%. That is the break-even demand growth rate; if demand were flat, occupancy would fall to 77.3% (−10.4pt against the July 2026 check-in benchmark). In practice the prefecture’s business hotels have held 87.7%, which implies that demand did deliver growth of that order.
| Demand +0% | Demand +5% | Demand +10% | Demand +15% | Demand +20% | |
|---|---|---|---|---|---|
| Supply +0.0% | 87.7% | 92.1% | 96.5% | 100.0% | 100.0% |
| Supply +5.0% | 83.5% | 87.7% | 91.9% | 96.1% | 100.0% |
| Supply +10.0% | 79.7% | 83.7% | 87.7% | 91.7% | 95.7% |
| Supply +13.4% (Akita City actual) | 77.3% | 81.2% | 85.1% | 88.9% | 92.8% |
| Supply +20.0% | 73.1% | 76.7% | 80.4% | 84.0% | 87.7% |
The diagonal of the grid is the line along which supply and demand grow at the same rate and occupancy is unchanged. The key reading is that the smaller a city’s existing stock, the larger the gs produced by the same number of rooms. Oga’s 47.3% (191 rooms onto 404 existing) means occupancy falls unless demand grows by 47% — consistent with the fact that the city’s estimated settled ADR is flat at +0.2% year on year. Conversely, in cities with a large base or firm weekday demand, such as Akita City and Misawa, the same room count produces a smaller gs and is more readily absorbed. For entry decisions, the practical reading is not the absolute number of rooms added but that number as a ratio to the target city’s existing stock.
Institutional Capital Holds Just Four Properties Across the Three Prefectures — What the Capital Vacuum Signals
Separately from supply and demand, capital structure is a precondition for any entry decision. Screening the 127 operating properties with 100 or more rooms across the three prefectures against the listed hotel REIT ownership master, only three matched. All are held by Invincible Investment Corporation, and all three are located in Aomori Prefecture. Removing the room-count floor and screening the three prefectures in full adds Tazawako Lake Resort with Natural Hot Spring in Semboku, Akita (80 rooms, acquired August 2023 for ¥1,475 million, held by the same REIT), bringing the total to four properties. Yamagata Prefecture has no properties held by a listed hotel REIT.
| Property | Location | Rooms | Acquired | Acquisition price | OCC | ADR | RevPAR |
|---|---|---|---|---|---|---|---|
| Art Hotel Aomori (アートホテル青森) | Aomori City, Aomori | 211 | July 2024 | ¥5,672mn | 87.6% | ¥10,080 | ¥8,830 |
| Hotel MyStays Aomori Station (ホテルマイステイズ青森駅前) | Aomori City, Aomori | 132 | August 2023 | ¥2,445mn | 90.8% | ¥9,551 | ¥8,670 |
| Art Hotel Hirosaki City (アートホテル弘前シティ) | Hirosaki, Aomori | 134 | February 2018 | ¥2,723mn | 86.8% | ¥13,535 | ¥11,751 |
| Tazawako Lake Resort with Natural Hot Spring (天然温泉田沢湖レイクリゾート) | Semboku, Akita | 80 | August 2023 | ¥1,475mn | — | — | — |
| Reference: Invincible Investment Corporation, 101 domestic hotels (June 2026) | 82.7% | ¥12,412 | ¥10,264 | ||||
Occupancy at the three disclosed Aomori properties runs 86.8-90.8%, above the 82.7% the REIT reports for its overall portfolio of 101 domestic hotels. ADR, at ¥9,551-13,535, straddles the portfolio-wide ¥12,412: the two properties in Aomori City sit below the portfolio average and only the Hirosaki property sits above. Portfolio-wide, occupancy is down 0.1 points year on year, ADR down 3.9% and RevPAR down 4.0% — so the three Aomori properties are being run at higher occupancy than the portfolio average.
It is also worth noting that Aomori City’s estimated settled ADR of ¥10,044 on a trailing 12-month average (N=37 properties) is almost identical to the ¥10,080 ADR disclosed for Art Hotel Aomori — a useful check on the accuracy of the estimates used throughout this article.
That listed REITs hold only four properties across the three prefectures (three in Aomori if restricted to 100+ rooms) indicates a limited stock of assets at a scale institutional investors can acquire — while equally meaning a market with little competition for regional financial institutions and local developers. Indeed, both of 2026’s major supply additions are in-house developments by non-REIT operators.
Inbound Growth Rates and Absolute Levels Diverge — Akita Is Up 47% yet Remains Tohoku’s Smallest
Inbound travel, routinely cited as a demand tailwind, also needs its level and its growth rate treated separately. According to the Tohoku District Transport Bureau, foreign guest nights across Tohoku’s six prefectures reached 2.77 million in 2025, a record high and up 21.8% on 2024. The momentum continued into 2026: April 2026 recorded 326,510 foreign guest nights across the six prefectures, with Akita up 47.2% year on year — the largest increase of the six.
Absolute levels are another matter. The March 2026 breakdown by prefecture shows Miyagi at 95,460 guest nights against Yamagata at 36,790, Aomori at 31,630 and Akita at 9,520. Akita’s leading growth rate is the flip side of a small base: its share of the 244,580 Tohoku total that month was just 3.9%.
This structure is consistent with the character of the three prefectures’ new supply. That 2026’s two major projects target energy-related extended stays rather than inbound demand is a rational choice given the reality of demand scale. Inbound is worth building into plans as a medium-term upside factor, but designs that make first-year economics dependent on inbound warrant caution — at least in Akita.
Leading indicators on the supply side are also worth checking. In the Ministry of Land, Infrastructure, Transport and Tourism’s Building Construction Starts Statistics, construction starts for lodging-industry buildings in 2024 — the most recent confirmed year — were 2 buildings and 41 m² in Aomori, 15 buildings and 6,800 m² in Akita, and 21 buildings and 7,223 m² in Yamagata. Aomori’s floor area of construction starts is effectively zero. Planning data from the ministry’s Building Dynamics Statistics Survey likewise shows virtually no registrations for the three prefectures at present. Both are compiled on a building-confirmation-application basis, and applications are usually filed one to two years before opening, so counts should rise as further applications come through. Read them as a lower bound on the confirmed pipeline as it stands.
Implications for Entry Decisions
Opportunity Limited-service formats show confirmed absorption headroom
Business and city hotels post LT7 occupancy of 85-89% across all three prefectures. In Akita City, prefectural business hotel occupancy held at 87.7% even after a supply injection equal to 13.4% of existing stock, demonstrating the depth of demand. Station-front sites in prefectural capitals and hub cities remain worth examining.
Question For ryokan and resorts, seasonal design is the key
Ryokan LT7 occupancy of 69-81% sits on the headroom side, and Golden Week early sell-out rates are below 10% in all three prefectures — yet the Marine Day weekend tightens to 68-94%. Rather than smoothing across the year, a design that concentrates earnings in summer and tightens the cost structure in the off-season fits this market’s demand curve more closely.
Premise For industrial-demand projects, schedule management drives the P&L
Both of 2026’s major projects are premised on energy-related extended-stay demand. Occupancy will be governed by the target project’s timetable and workforce trajectory rather than by lodging-market seasonality. In sensitivity analysis for the business plan, construction schedule shifts — not leisure demand volatility — should be the primary variable.
What emerges across the three prefectures is that total supply is not the problem: outcomes are decided by whether the receiving market has demand that can be absorbed through rate. Cities with firm weekday or date-specific demand, such as Misawa and Daisen, grew ADR by double digits, while season-skewed cities took the supply up through occupancy and held rate flat. For entry decisions, the practical starting point is to define what underpins demand in the target city before looking at supply concentration itself.
Note on handling of the data: New-opening data is counted once an OTA listing is confirmed. Because listings begin several months before opening, the most recent months and years may rise as further listings are reflected. Planning data based on the Building Construction Starts Statistics and the Building Dynamics Statistics Survey is compiled on a building-confirmation-application basis, so future years are structurally under-counted; please treat these as a lower bound on the confirmed pipeline as it stands. Sell-out signals and occupancy estimates are based on inventory observations accumulated since 10 March 2026; check-in dates earlier than that are outside the scope of the aggregation.
Related Reading
- Supply Absorption Headroom in Regional Core Cities — an Eight-City Map Read Through GW 2026 Sell-Out Rates and New Openings
- Investment Analysis: The Hotel Supply Pipeline Around Sendai Station — a Westin-Dominated Gap Above ¥40k, Shelved Redevelopment and Entry Room by Price Band
- Booking Pace for Tohoku’s Three Great Festivals 2026 — Reading the Summer Through Early-August ADR in Aomori, Akita and Sendai
References and Sources
■ Data sources
Daily observation of OTA-published inventory and listed prices by MetroEngines Research & Consulting. Coverage is 636 properties and 34,592 rooms under continuous tracking across Aomori, Akita and Yamagata (as of July 2026). New-opening data is counted once an OTA listing is confirmed (2025: 42 properties / 1,525 rooms; 2026: 7 properties / 554 rooms). City-level estimated settled ADR uses monthly N=8-58 properties, and monthly N=612-670 properties for the three prefectures combined. Occupancy by property type is derived from lead-time inventory absorption for July 2026 check-ins. Listed REIT ownership was cross-checked against the ownership master (as of July 2026, 301 domestic properties).
■ Calculation assumptions
Estimated settled ADR applies property-type correction coefficients to each property’s lowest plan rate (double occupancy, per room, tax included) to produce an estimated settled rate (tax-exclusive equivalent); area values are the monthly average of the median across target properties. “Early sell-out” is defined as a property’s remaining rooms reaching zero at least seven days before check-in, with the population limited to properties publishing 30% or more of their total rooms to OTAs. The supply-demand diagnosis classifies LT7 occupancy of 85% or above as “Tight”, 80-85% as “Balanced” and below 80% as “Headroom”. The supply absorption sensitivity analysis is a mechanical calculation from the identity occupancy’ = occupancy × (1 + demand growth) ÷ (1 + supply growth), with the base value being the 87.7% LT7 occupancy of Akita Prefecture business hotels (July 2026 check-ins) and results capped at 100%. It contains no new demand forecast.
■ Limitations and caveats
Occupancy and sell-out signals are estimates based on absorption of OTA-published inventory, and are defined differently from a property’s true overall occupancy including direct and group bookings (levels cannot be compared directly with the Japan Tourism Agency’s Accommodation Travel Statistics). New-opening data is based on confirmed OTA listings and therefore under-counts the most recent year; read it as a lower bound on the confirmed pipeline. For ryokan early sell-out rates in Yamagata, the number of target properties exceeds the ranking retrieval cap of 100, so the numerator is the count confirmed among the top 100 properties while the denominator is the full population (Golden Week 106 properties / Marine Day weekend 114 properties). Inventory observation data is based on accumulation since 10 March 2026; earlier check-in dates are outside the scope. OCC, ADR and RevPAR for Tazawako Lake Resort with Natural Hot Spring are omitted because no property-level disclosure could be confirmed.
■ Market data
- MetroEngines Research & Consulting — estimated settled ADR (3 prefectures, monthly N=612-670 properties), estimated occupancy based on OTA-listed inventory, room-level inventory absorption data, new-opening data (based on confirmed OTA listings)
- Ownership master (as of July 2026, 301 domestic properties)
■ Government statistics and public data
- Japan Tourism Agency, “Accommodation Travel Statistics” (confirmed annual values for 2025; first preliminary figures for May 2026)
- Japan Tourism Agency press release, “Accommodation Travel Statistics (second preliminary figures for April 2026, first preliminary figures for May 2026 and confirmed annual values for 2025)”
- e-Stat, “Statistical Survey on Building Construction Starts” (statistics ID: 0003114490, lodging-industry buildings by prefecture)
- Ministry of Land, Infrastructure, Transport and Tourism, “Building Dynamics Statistics Survey” (planned hotels, compiled on a building-confirmation-application basis)
- Tohoku District Transport Bureau, “Foreign guest nights in Tohoku reached a record 2.77 million in 2025” (3 March 2026)
- Tohoku District Transport Bureau, “Total guest nights within the Tohoku district”
■ REIT and IR materials
■ News and press releases
- Kinoshita Group, “Hotel Kinoshita Akita Oga Ekimae: grand opening 5 March 2026, reservations now open”
- Kinoshita Group, “Kinoshita Real Estate Development holds groundbreaking ceremony for its first hotel construction, in Oga City, Akita Prefecture”
- Nikkei, “Business hotel in Oga City, Akita Prefecture, with an eye on offshore wind coming online”
- Sun Frontier Fudousan, “Tabino Hotel Aomori Rokkasho: reservations now open”
- Sun Frontier Hotel Management, “Tabino Hotel Aomori Rokkasho, scheduled to open October 2026”
- Hoshino Resorts, “KAI Zao to open in autumn 2026”
- Kanko Keizai Shimbun, “Foreign guest nights across Tohoku’s six prefectures reached 326,510 in April 2026; Akita up 47.2% year on year”
- Kanko Keizai Shimbun, “Foreign guest nights in Tohoku totalled 244,580 in March 2026”