

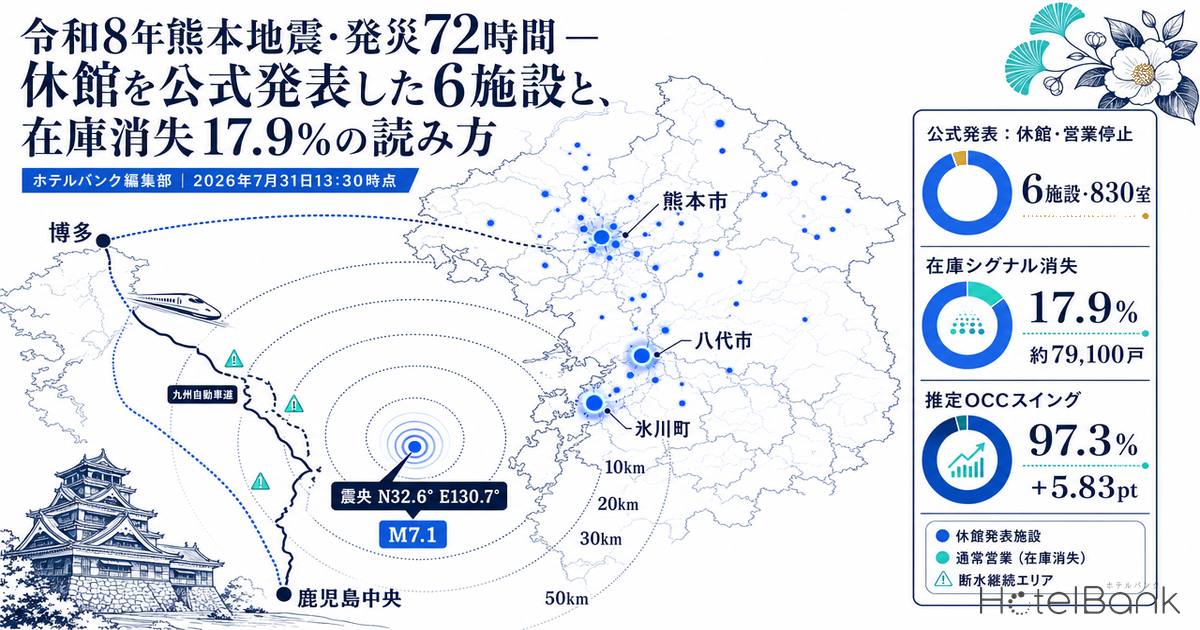
At 16:27 on 28 July of Reiwa 8 (2026), a magnitude 7.1 earthquake struck Kumamoto. As of this writing, a full three days have passed. On 29 July — the day after the quake — HotelBank published two pieces: one tallying the guest-room stock and epicentre distance bands across the 21 municipalities covered by the Disaster Relief Act, and one revisiting the demand asymmetry of 2016. This article is the follow-up, and it presents what has changed in the 72 hours since, as a comparison between the deltas in official announcements and re-aggregated values for the same indicators.
It also confronts head-on two questions the previous two articles deliberately left alone — “which properties have officially announced closure or suspension of operations?” and “does the disappearance of inventory in lodging data mean a property has closed?” To state the conclusion first: the two do not match at all. The errors run in both directions, and reading post-disaster supply-demand indicators without understanding that structure will badly misrepresent what is actually happening in the market.
Please note: This article covers an ongoing disaster. Figures for damage, evacuation, lifelines and transport are provisional values published by the Cabinet Office, the Ministry of Land, Infrastructure, Transport and Tourism (MLIT), the Japan Meteorological Agency (JMA) and Kumamoto Prefecture as of each stated point in time, and they will change. Statements about whether individual properties are operating reflect only the content of the official announcements cited here at the time they were checked. For actual travel or coordination, please always confirm the latest official announcements from each property and each municipality. Our deepest sympathies go out to everyone affected.
Metric Definitions Used in This Article
- ADR (average daily rate): An estimated transacted rate (tax-exclusive equivalent) calculated by applying category-specific adjustment coefficients to the lowest publicly listed plan level each property offers on OTAs and similar channels (two guests per room, per-room rate, tax included). Cross-checked against property-level actuals disclosed by listed hotel REITs (184 property-months, April–May 2026), the median error is approximately 7.5%. These are estimates and differ from each property’s actual transacted prices and accounting figures. Area-level ADR is the median of the properties covered (the level of a typical property in that area).
- OCC (occupancy rate): The share of sold rooms against total rooms in an area (an estimate based on OTA sales inventory; consistency checks against monthly REIT disclosures confirm accuracy generally within a few percentage points). The central argument of this article, however, is that in a disaster-hit area immediately after an event this indicator cannot be interpreted as demand (see Section 6).
- LT (lead time): Days remaining until the check-in date. LT0 = same day.
- Inventory signal: A classification original to this article. For properties whose August check-in sales inventory was observable before the quake, it sorts how that inventory changed in observations after the quake (from 29 July onward) into four categories. Definitions are given in the table in Section 2. This is not a determination of whether a property is operating.
- Data scope: Aggregated from information listed on online sales channels; this is not a complete census. Ryokan, minshuku and simple lodging houses that are not listed are excluded.
- Data sources: MetroEngines Research / Cabinet Office, MLIT, JMA, Kumamoto Prefecture, and materials published by individual properties
- — Six properties totalling 830 rooms have officially announced closure or suspension of new reservations (within the range this article could verify on property official sites, as of 31 July). The closest to the epicentre is a single property in Hikawa Town, 5.7 km away.
- — “Inventory disappeared” does not equal “closed.” The top three properties by room count whose inventory went to zero — 651 rooms in total — are all operating normally according to their operators’ official announcements (on a re-check the same evening, one of them had resumed selling). Conversely, there are cases where inventory persists in the data for properties that have officially stopped taking reservations. The errors run in both directions.
- — The inventory-loss rate decays monotonically by epicentre distance band, from 97.3% to 0.0%. The 0–10 km band is 97.3%, 10–20 km 55.1%, 20–30 km 21.9%, 30–50 km 3.4%, and beyond 50 km 0.0% (N=299 properties, 17,995 rooms).
- — Kumamoto Prefecture’s estimated OCC rose above the average of Kyushu’s other six prefectures after the quake, but this is not demand. Over the 13 days before the quake it ran 1.1 pt below that six-prefecture average; for 29–31 July check-ins it ran 4.8 pt above (a swing of +5.8 pt). The 1,851 rooms whose inventory went to zero alone create up to 9.4 pt of upward pressure, so the swing is fully explicable by inventory withdrawal.
- — Obon demand cannot yet be judged. The booking curve for 13 August arrivals has only one post-quake observation point, and the number of observed properties moved 7.8% (446 → 481). In addition, the LT70, LT68 and LT42 cross-sections carry only 21, 9 and 22 properties respectively, so this article excludes them from the chart.
- — Transport recovered substantially in three days. The Kyushu Shinkansen resumed service between Hakata and Kumamoto on 31 July (after three days), expressway closures fell from 17 sections on 3 routes to 9 sections on 2 routes, and closures on nationally administered highways fell to zero. Water outages, however, still affect approximately 79,100 households (Kumamoto Prefecture, 07:30 on 31 July).
1. What Changed Since the Last Report — How Official Announcements Were Updated in 72 Hours
First, we place side by side MLIT’s “Report No. 5” (as of 14:00 on 29 July), on which the previous two articles relied, and the latest “Report No. 12” (as of 13:30 on 31 July). The same bulletin format has now been updated 12 times, making it possible to read off which items improved and which worsened.
| Item | Report No. 5 (7/29 14:00) | Report No. 12 (7/31 13:30) | Direction |
|---|---|---|---|
| Expressway closures | 17 sections on 3 routes | 9 sections on 2 routes (some open to emergency vehicles) | Improved |
| Nationally administered highway closures | Route 57, 1 section (bridge damage) | None | Improved |
| Subsidised national highway closures | 3 sections | 2 sections in 1 prefecture (Routes 218 and 219) | Improved |
| Prefectural and other roads | 14 sections in 3 prefectures | 16 sections in 4 prefectures | Worsened |
| Kyushu Shinkansen | Service suspended on the entire line | Suspended only between Kumamoto and Kagoshima-Chuo (Hakata–Kumamoto resumed 7/31) | Improved |
| Conventional rail lines | 6 lines across 4 operators suspended | 3 lines across 2 operators suspended | Improved |
| Kumamoto Airport | 14 flights cancelled on 7/29 (runway reopened 7/28) | No cancellations from 7/30 onward | Improved |
| Highway buses | 27 routes across 9 operators suspended | 18 routes across 7 operators suspended | Improved |
| Local buses (within Kumamoto Pref.) | Suspensions at 3 operators | 13 routes at 1 operator suspended | Improved |
| Water outages | 11 municipalities in 2 prefectures, approx. 84,000 households | 10 municipalities in 1 prefecture, approx. 79,000 households (peak revised upward to approx. 108,100) | Marginally improved |
| Isolated communities | — | No isolated communities at this time | — |
| Earthquakes of seismic intensity 3 or above | — | 60 (one of intensity 7, four of upper 5, 15 of 4, 40 of 3) | — |
Source: Compiled by the HotelBank Editorial Team from MLIT, “On the Damage Situation Caused by the Reiwa 8 Kumamoto Earthquake,” Report No. 5 (as of 14:00, 29 July 2026) and Report No. 12 (as of 13:30, 31 July 2026)
From a lodging-demand standpoint, the single biggest change is the resumption of Kyushu Shinkansen service between Hakata and Kumamoto. In the previous article we wrote that the Kyushu Shinkansen was suspended along its entire length, effectively making all of Kyushu “hard to reach” for inbound travellers using rail passes. With that section reopening on 31 July after three days, the rail corridor from Fukuoka to Kumamoto has at least been restored. JR Kyushu notes, however, that it is running a reduced number of services, and through-services with the Sanyo Shinkansen remain suspended. Between Kumamoto and Kagoshima-Chuo, more than 200 locations of fallen or damaged noise barriers, two rail fractures and one displaced bridge girder have been confirmed, and the company states that “detailed damage is still under investigation.” A restoration plan for the Kagoshima Main Line between Kumamoto and Yatsushiro is also still being drawn up.
Seismic intensity determinations have also been updated. The table in the previous article listed upper 6 intensity for five municipalities — Kumamoto City, Yatsushiro City, Uto City, Misato Town and Mashiki Town — but Report No. 12 adds Kashima Town, bringing the total to six. Kosa Town has also been added at upper 5. Kashima Town, which the previous article classified as lower 6, is now published as upper 6. The fact that such updates continue as provisional values are refined is a characteristic worth bearing in mind when publishing anything grounded in seismic intensity.
The scale of casualties and evacuation has changed as well. At the time of the previous article (07:00 on 29 July, Cabinet Office), the number of evacuees was 9,186. At Kumamoto Prefecture’s disaster response headquarters meeting on 31 July, it was announced that 35 people have died, including one case where the connection to the disaster is still under investigation, and that just over 9,100 people remain evacuated. Water outages affected approximately 79,100 households in the prefecture as of 07:30 on 31 July, of which Yatsushiro City accounts for roughly 25,300. As the previous article noted, lodging capacity does not exist on an intact building alone — it is inseparable from restored water supply. Over these three days, the number of households without water has shrunk only from about 84,000 to about 79,100, a decline of roughly 6%.
2. By Epicentre Distance Band — The Inventory Signal Decays Monotonically from 97.3% to 0.0%
From here we turn to this article’s own aggregation. The previous article showed peacetime stock — how many rooms accumulate in each distance band from the epicentre. Here we use the same distance-band axis to re-aggregate how observation of sales inventory changed after the quake. Our earlier tally of how much room stock sits in each distance band across the 21 municipalities covered by the Disaster Relief Act found 13,269 rooms within 30 km of the epicentre and 17,708 rooms across 378 properties in those 21 municipalities.
The population is limited to properties in Kumamoto Prefecture for which sales inventory for August 2026 check-ins was observable on at least 10 days before the quake (before 16:27 on 28 July). Including thinly observed properties in the population would cause mere observation noise to be misread as “inventory loss.” Under this condition, 299 properties and 17,995 rooms remain. One property had a legacy record under a former name at the same coordinates; this was excluded as a duplicate.
Each property was sorted into the following four categories based on observations before and after the quake. This classification is strictly a data-level inventory signal, not a determination of whether a property is operating. Section 4 demonstrates why.
| Category | Definition | Properties / Rooms | |
|---|---|---|---|
| A: Listing continues normally | After the quake, inventory is observable on roughly the same number of days as before | 263 properties | 14,777 rooms |
| B: Listing continues, zero rooms remaining | The listing itself is observable, but remaining rooms fell to zero on every August date | 19 properties | 1,851 rooms |
| C: Listing itself disappeared | No post-quake observation data could be obtained at all | 6 properties | 75 rooms |
| D: Sharply reduced inventory days | The number of days with observable inventory fell to one-third or less of the pre-quake level | 11 properties | 1,292 rooms |
| B + C + D total | Properties that lost their inventory signal | 36 properties | 3,218 rooms (17.9%) |
Source: Compiled by the HotelBank Editorial Team from MetroEngines Research (N=299 properties / 17,995 rooms, aggregated 31 July 2026)
Splitting these 36 properties and 3,218 rooms by distance from the epicentre produces a clean monotonic decay.
| Distance band | Properties | Rooms | A Continued | B Zero rooms | C Listing gone | D Sharply reduced | Rooms losing signal (rate) |
|---|---|---|---|---|---|---|---|
| 0–10 km | 6 | 187 | 2 | 1 | 2 | 1 | 182 rooms (97.3%) |
| 10–20 km | 15 | 1,293 | 7 | 5 | 1 | 2 | 712 rooms (55.1%) |
| 20–30 km | 101 | 9,966 | 81 | 12 | 2 | 6 | 2,178 rooms (21.9%) |
| 30–50 km | 101 | 4,262 | 98 | 1 | 0 | 2 | 145 rooms (3.4%) |
| Beyond 50 km | 76 | 2,287 | 75 | 0 | 1 | 0 | 1 room (0.0%) |
| Total | 299 | 17,995 | 263 | 19 | 6 | 11 | 3,218 rooms (17.9%) |
Source: Compiled by the HotelBank Editorial Team from MetroEngines Research (N=299 properties; epicentre 32.6°N, 130.7°E as published by JMA; aggregated 31 July 2026)
Source: Compiled by the HotelBank Editorial Team from MetroEngines Research
In the 0–10 km band, 182 of the 187 rooms across six covered properties (97.3%) lost their inventory signal. This band contains only six properties, however, so movement at a single property swings the rate considerably and the figure should be discounted accordingly. The 10–20 km band shows 712 of 1,293 rooms across 15 properties (55.1%); the 20–30 km band 2,178 of 9,966 rooms across 101 properties (21.9%); the 30–50 km band falls to 3.4%, and beyond 50 km to 0.0%.
What matters here is that while this decay corresponds closely to the seismic intensity distribution, the absolute volume of rooms increases with distance. As the previous article showed, there are almost no rooms to serve as capacity in the immediate vicinity of the epicentre; the lodging cluster sits about 22 km to the north, in central Kumamoto City. Of the 3,218 rooms that lost inventory, therefore, the largest block by room count is the 2,178 rooms in the 20–30 km band — that is, central Kumamoto City. By rate, the area nearest the epicentre is the most severely affected; by volume, the prefectural capital takes the largest hit. This duality is easy to conflate when relief coordinators are judging “where has capacity thinned.”
The geographic distribution is worth confirming on a map. The concentric circles mark 10, 20, 30 and 50 km from the epicentre. Blue circles are properties that have officially announced closure or suspension of reservations (Section 3); grey circles are properties confirmed to be operating normally per official announcements (Section 4). Circle size represents room count.
Source: Compiled by the HotelBank Editorial Team from MetroEngines Research (property locations and room counts), JMA (epicentre) and official announcements from each property
3. Properties That Officially Announced Closure or Suspension — 6 Properties, 830 Rooms
This is the core of the article. We name properties only where closure, suspension of operations or suspension of new reservations is explicitly stated on the property’s own official site or in an official announcement from its operating company. We do not treat the absence of visible inventory on booking sites, or a mention in news coverage alone, as grounds for declaring a property “closed.” The next section explains why.
For each listing, we also confirmed that the closure notice was issued after the 28 July earthquake, ensuring these are not pre-existing closures unrelated to the quake.
| Property | Location | Rooms | Distance from epicentre | Content of official announcement | Announced / updated |
|---|---|---|---|---|---|
| HOTEL AZ Kumamoto Yatsushiro Miyahara (HOTEL AZ 熊本八代宮原店) | Hikawa Town, Yatsushiro District (intensity 7) | 93 rooms | 5.7 km | “Notice of temporary closure.” Power and water outages continue and the resumption date is reported as undecided | 28 July 2026 |
| Toyoko Inn Shin-Yatsushiro Ekimae (東横INN新八代駅前) | Yatsushiro City (upper 6) | 134 rooms | 10.9 km | Closure continues because air conditioning cannot operate due to the power outage; new reservations suspended | Posted 29 July 2026 / updated 23:30, 30 July |
| Yatsushiro Grand Hotel (八代グランドホテル) | Yatsushiro City (upper 6) | 74 rooms | 13.5 km | “Due to the impact of the earthquake that occurred at 16:27 on 28 July, we will suspend operations for the time being” | After the quake (no posting date given) |
| Super Hotel Kumamoto Yatsushiro (スーパーホテル熊本・八代) | Yatsushiro City (upper 6) | 100 rooms | 13.8 km | “For the time being, we will temporarily suspend lodging operations and acceptance of new reservations.” Safety checks of the building and equipment are being carried out in sequence | 28 July 2026 |
| THE BLOSSOM KUMAMOTO | Nishi Ward, Kumamoto City (upper 6) | 203 rooms | 21.1 km | “Regarding the suspension of in-house facilities and changes to operations due to the earthquake” | Posted 29 July 2026 / as of 10:30, 30 July |
| Mitsui Garden Hotel Kumamoto (三井ガーデンホテル熊本) | Chuo Ward, Kumamoto City (upper 6) | 226 rooms | 21.9 km | “Due to the impact of the earthquake, we have suspended acceptance of reservations through 30 September.” In-house elevators, the multi-storey car park and hot water systems were restored by 29 July | 28 July 2026 / updated 31 July |
| 6 properties, total | 830 rooms | Breakdown: closure / suspension of operations — 4 properties, 401 rooms; suspension of reservations or in-house facilities — 2 properties, 429 rooms | |||
Source: Compiled by the HotelBank Editorial Team from content posted on the official sites of each property and operating company (verified 31 July 2026). Room counts from MetroEngines Research; distance from the epicentre is the great-circle distance from the JMA-published epicentre (32.6°N, 130.7°E)
The figure of six properties and 830 rooms is the range for which this article was able to verify official announcements. In reality, it is highly likely that more properties are closed. Smaller ryokan and minshuku in particular may not have their own websites, or updates may have stopped because of telephone and water outages — meaning that “an announcement” was never possible in the first place. The gap between the 36 properties flagged by the inventory signal in Section 2 and the six that could be officially verified reflects the limits of information flow itself in the immediate aftermath.
Looking at the relationship with distance, three of the four properties that officially announced closure are in Yatsushiro City and one is in Hikawa Town — all within 14 km of the epicentre. The two properties in Kumamoto City (Nishi and Chuo wards), by contrast, have taken the form of “suspending reservations” or “suspending in-house facilities and changing operations” rather than closing. The former represents a physical stoppage from building and equipment damage plus severed lifelines; the latter reads as a decision to restrict new sales while operations themselves remain possible, given constraints on water, food supply and housekeeping capacity. The very shape of a suspension differs by distance band.
Background on Yatsushiro City: Yatsushiro recorded upper 6 intensity and, as of 07:30 on 31 July, had approximately 25,300 households without water — the most in the prefecture. City gas supply was also halted to approximately 8,892 households as a safety measure, with seven other gas utilities dispatching support crews (METI information, as of 05:30 on 30 July). At the Port of Yatsushiro, steps, liquefaction and subsidence have been confirmed behind the container terminal quay. The concentration of closures is best read not as damage to individual properties but as the consequence of the infrastructure that supports lodging capacity being constrained simultaneously.
4. “Inventory Disappeared” Does Not Equal “Closed” — The Errors Run Both Ways
This is the point this article most wants to stress. The “36 properties that lost their inventory signal” in Section 2 and the “six properties that officially announced closure” in Section 3 barely overlap. And the reason they do not overlap runs in more than one direction.
Error direction 1: inventory disappears but the property has not closed. Among the properties classified as “B: listing continues, zero rooms remaining” in Section 2, we checked the official announcements of the operators of the top three by room count. All three are operating normally.
| Property | Rooms | Inventory signal (observed through early morning, 31 July) | Official announcement (verified 31 July) | Re-check, evening of 31 July |
|---|---|---|---|---|
| Via Inn Prime Kumamoto <Hibari no Yu> (ヴィアインプライム熊本 <雲雀の湯>) | 232 rooms | Zero rooms remaining on every August date (31 days of inventory observed before the quake) | “Inspection and restoration work is complete.” Large communal bath, elevators, breakfast venue, business lounge, electricity, water and Wi-Fi all available; operating normally. Only housekeeping capacity is restricted (posted 30 July 2026 / updated 09:00, 31 July) | Sales resumed. Sales allocations confirmed listed for every August date |
| Washington R&B Hotel Kumamoto Shimotori (ワシントンR&Bホテル熊本下通) | 221 rooms | Zero rooms remaining on every August date except 9 and 12 August (31 days of inventory observed before the quake) | Safety checks conducted; “we have confirmed there is no impediment to operations” and “we are currently operating as normal” (30 July 2026) | No August sales plans listed (withdrawal of online sales allocations continues) |
| Toyoko Inn Kumamoto-jo Toricho-suji (東横INN熊本城通町筋) | 198 rooms | Zero rooms remaining on every August date (23 days of inventory observed before the quake) | Per the operator’s notice, only the Shin-Yatsushiro Ekimae property remains closed; the other six properties in Kumamoto Prefecture have resumed operations (posted 29 July 2026 / updated 23:30, 30 July) | No August sales plans listed (withdrawal of online sales allocations continues) |
| 3 properties, total | 651 rooms | All officially operating. On the evening re-check, one property had resumed selling and two continued to withhold sales allocations | ||
Source: Compiled by the HotelBank Editorial Team from content posted on each operator’s official site (verified 31 July 2026) and MetroEngines Research (inventory observation, including a re-retrieval of listing status on the evening of 31 July)
In other words, the 651 rooms that appear to have “disappeared” in the data are in fact operating. So what is happening? The most plausible explanations are several: (1) rooms are effectively filled by long-staying recovery and relief personnel, leaving no allocation for general sale; (2) constraints on water, food supply and housekeeping capacity mean properties are prioritising existing reservations and temporarily throttling new sales; and (3) operators have deliberately withdrawn online sales allocations and switched to handling direct enquiries. Publicly available online information alone cannot determine which of these is the primary cause. When Kumamoto Prefecture’s total guest nights turned positive year on year in June following the 2016 earthquake, lodging demand from recovery personnel was part of the background — and even if the same phenomenon is occurring now, it cannot be read as “a recovery in leisure demand.”
Part of this reading was borne out within the same day. On the evening of 31 July we re-checked the listing status of the three properties: Via Inn Prime Kumamoto had resumed selling across every August date, so a signal that had read “zero rooms remaining” until early morning cleared within half a day. Washington R&B Hotel Kumamoto Shimotori and Toyoko Inn Kumamoto-jo Toricho-suji, meanwhile, had moved from listings with zero remaining rooms to withdrawing their August sales plans entirely. Operating while manipulating only the sales allocation — this progression shows that pattern (3) is in fact a major dynamic. The inventory signal is not a mapping of operating status; it is point-in-time information that reflects a property’s sales operations on a scale of hours.
Error direction 2: a property has officially suspended, yet inventory persists in the data. Of the six properties in Section 3, Mitsui Garden Hotel Kumamoto officially announced on 28 July that it had suspended reservations through 30 September — yet sales inventory for August check-ins at that property was still observed on 11 days after the quake (31 days before it). THE BLOSSOM KUMAMOTO likewise showed seven days of post-quake inventory. HOTEL AZ Kumamoto Yatsushiro Miyahara announced a temporary closure on 28 July, yet the 31 July observation still recorded inventory on eight days of sales rows. This is because reservation suspensions are reflected at different times on different sales channels, and because a property announcing a suspension does not cause the listing information itself to disappear immediately. On the evening re-check of 31 July, Mitsui Garden Hotel Kumamoto’s August listing had disappeared and THE BLOSSOM KUMAMOTO’s remaining rooms had gone to zero on all dates — roughly three days from announcement to data reflection.
Addendum (evening of 31 July, prefecture-wide re-check) To gauge how widespread the false positives shown in this section are, we re-retrieved listing status for check-ins from 1 to 30 August that same evening across the 635 properties in Kumamoto Prefecture with online sales listings. The breakdown for the 519 properties whose August sales were observable in the pre-quake week (21–27 July) is as follows.
| Status as of the evening of 31 July | Properties | Rooms |
|---|---|---|
| Selling August dates (inventory present) | 473 properties | — |
| August sales plans withdrawn (not listed) | 43 properties | 3,593 rooms |
| Listing retained but zero rooms remaining on all dates 1–30 August | 8 properties | 1,154 rooms |
Most of the 43 properties that withdrew their sales plans have issued no official announcement of a suspension. Conversely, properties that did officially announce a suspension of reservations (such as THE BLOSSOM KUMAMOTO) appear on the “listing retained, zero rooms remaining” side. Combining the two, August sales have stopped at 51 of 519 properties (roughly one in ten by property count) — a figure whose population, definition and observation point all differ from the 17.9% inventory-signal loss in Section 2 (by room count, at the 72-hour mark, N=299 properties). Inventory figures move this much depending on the point in time and the definition — and that range is precisely why a single-point inventory tally must never be cited as a “closure count.”
Source: Compiled by the HotelBank Editorial Team from MetroEngines Research (prefecture-wide re-retrieval of listing status for 635 properties in Kumamoto Prefecture, evening of 31 July 2026)
Conclusion: lodging inventory data is not a primary source on whether a property is operating.
The disappearance of inventory is no more than an auxiliary signal suggesting the possibility of a suspension, and false positives (operating yet the inventory vanishes) and false negatives (closed yet the inventory persists) both genuinely occur. In our measurements, the top three properties by room count whose inventory went to zero — 651 rooms — were all operating normally, making false positives not an exception but the dominant pattern at larger properties. The inventory signal is also point-in-time information that shifts within hours: a property that “disappeared” in the morning may have resumed selling by the evening. Any discussion of inventory that does not state its point in time is itself a source of misreading. For travellers, municipalities and the press alike, the only place to confirm whether a property is operating is the property’s own official announcement.
5. How Large Is the Supply Loss? — Upper and Lower Bounds by Room Count
With the previous section in mind, there is still a need to grasp the order of magnitude of how much supply has been lost. This article presents two figures of differing certainty as an upper and a lower bound.
| Estimate | Basis | Properties | Rooms | Share of observed stock in the prefecture |
|---|---|---|---|---|
| Lower bound (certain) | Properties with closure, suspension of operations or suspension of reservations explicitly stated in an official announcement | 6 | 830 rooms | 4.6% |
| Upper bound (inventory signal) | Properties that lost their inventory signal after the quake (B + C + D). Includes many properties that are operating | 36 | 3,218 rooms | 17.9% |
| Reference: population | Properties in Kumamoto Prefecture with at least 10 days of observable August inventory before the quake | 299 | 17,995 rooms | 100% |
Source: Compiled by the HotelBank Editorial Team from MetroEngines Research and official announcements from each property (N=299 properties / 17,995 rooms, aggregated 31 July 2026)
The reality lies between the lower and upper bounds. The six properties and 830 rooms verified officially in this article represent supply that is certainly lost, while the 3,218-room upper bound certainly includes the 651 operating rooms identified in the previous section. Mechanically subtracting those 651 rooms gives 2,567 rooms (14.3% of the population), but similar false positives must also be present among properties we did not check — so it is reasonable to view the actual supply loss as somewhere between 830 and 2,567 rooms, on the order of 1,000–2,000 rooms.
It is worth setting this against the previous article’s figures. That analysis counted 378 properties and 17,708 rooms of stock across the 21 municipalities covered by the Disaster Relief Act, and 13,269 rooms within 30 km of the epicentre. If 1,000–2,000 rooms are in fact unusable, that corresponds to roughly 8–15% of the stock within 30 km. In the previous article’s “distance band × mobilisation rate” capacity calculation, meeting just over 10% of evacuees within the 30 km radius would require mobilising 5% of rooms — which means 8–15% has become unusable before that 5% can even be secured. Capacity planning needs to be reset to start not from total stock but from “rooms usable right now.”
6. The Apparent Rise in Demand Indicators Is the Flip Side of Inventory Disappearing
This is the most operationally dangerous point of all. In a disaster-hit area after an event, estimated occupancy (OCC) rises. But not because demand increased. When inventory is withdrawn, rooms whose remaining count has gone to zero are recorded as “sold.” Our aggregation measures this phenomenon directly.
First, we place Kumamoto Prefecture’s estimated OCC alongside the average of Kyushu’s other six prefectures (Fukuoka, Saga, Nagasaki, Oita, Miyazaki and Kagoshima), by check-in date. To cancel out common seasonal factors, we also show the gap between them (Kumamoto minus the six-prefecture average).
Source: Compiled by the HotelBank Editorial Team from MetroEngines Research (Kumamoto Prefecture N=436 properties / 19,623 rooms; other six prefectures N=2,327 properties / 128,051 rooms; July 2026 check-ins)
Now the numbers. For check-ins from 15 to 27 July (the 13 days before the quake), the gap averaged −1.07 points — Kumamoto consistently ran below the average of Kyushu’s other six prefectures. But for check-ins from 29 to 31 July (the three days after the quake), the gap averaged +4.76 points. That is a swing of 5.83 points across the event.
| Period | Kumamoto estimated OCC | Other six Kyushu prefectures, average | Gap |
|---|---|---|---|
| 7/15–7/27 (pre-quake, 13 days) | 85.8% | 86.9% | −1.07 pt |
| 7/29–7/31 (post-quake, 3 days) | 88.3% | 83.5% | +4.76 pt |
| Swing | — | — | +5.83 pt |
Source: Compiled by the HotelBank Editorial Team from MetroEngines Research (simple average of daily estimated OCC for July 2026 check-ins)
Extract the single sentence “immediately after a magnitude 7 quake, occupancy in the affected prefecture ran 4.8 points above neighbouring prefectures” and it could be read as a demand surge from an influx of recovery personnel. That reading is wrong — and the arithmetic proves it.
The properties classified as “B: listing continues, zero rooms remaining” in Section 2 numbered 19 properties and 1,851 rooms. Because their listings have not disappeared, they remain in the denominator of estimated OCC (total rooms), while the rooms whose remaining count went to zero are added directly to the numerator (sold rooms). The estimated-OCC population for Kumamoto Prefecture is 19,623 rooms, so 1,851 ÷ 19,623 = 9.4 points — the upper limit of the lift that category B alone can generate. The measured swing is 5.83 points, comfortably within the range that inventory withdrawal alone can explain. Add the partial contribution of the 1,292 rooms in “D: sharply reduced inventory days,” and the explanatory headroom is larger still.
There is one more discontinuity — in the observations themselves — that needs checking. The chart below plots the number of properties in Kumamoto Prefecture for which sales inventory for August check-ins could be observed, by observation date.
Source: Compiled by the HotelBank Editorial Team from MetroEngines Research (properties observed per observation date, August 2026 check-ins, Kumamoto Prefecture)
Between 20 and 28 July the observed property count moved between 304 and 394, then jumped to 493 on 29 July and 619 on 30 July, before returning to 340 on 31 July. The population itself is moving by nearly a factor of two from day to day. Running a daily comparison such as “occupancy on 30 July was higher than the day before” in this state measures a change in the observation set, not a change in demand. This is precisely why Section 2 fixed the population to “properties with at least 10 days of pre-quake inventory observation.”
Estimated OCC in a disaster-hit area cannot be interpreted as a demand indicator in the immediate aftermath.
When inventory is withdrawn, “inventory disappearing” is recorded as “rooms selling,” so the deeper the damage on the supply side, the higher occupancy reads. The indicator points in the opposite direction to reality. For an area immediately after a disaster, occupancy should not be used as a proxy for demand; look instead at the volume of inventory and the trajectory of the observed property count.
7. Obon Demand Cannot Yet Be Judged
The obvious next question is what happens over Obon, and this article’s position is unambiguous: the current data cannot answer it. Here is the reasoning, in numbers.
The chart below compares estimated OCC for check-ins on 13 August 2026 (the Obon peak) between Kumamoto and Kagoshima prefectures, with lead time (LT) on the horizontal axis. LT15 at the right-hand end is 29 July — the day after the quake.
Source: Compiled by the HotelBank Editorial Team from MetroEngines Research (Kumamoto Prefecture 519 properties / 21,333 rooms; Kagoshima Prefecture 531 properties / 20,802 rooms; 13 August 2026 check-ins)
Three things can be read from it, and all of them point toward “not yet judgeable.”
First, there is only one post-quake observation point. The pre-aggregated curve this article references runs to 29 July (LT15), so effectively that single point is the only data after the quake (16:27, 28 July). Kumamoto’s estimated OCC rose 1.0 point, from 86.2% on 28 July 2026 (LT16) to 87.2% on 29 July 2026 (LT15), while over the same period Kagoshima fell 0.1 point, from 71.9% to 71.8%. That is a relative rise of 1.1 points — but you cannot state a trend from a single observation. And as Section 6 showed, movement in exactly this direction is what inventory withdrawal produces.
Second, the observed property count moved substantially on that one day. For Kumamoto’s 13 August arrival curve, the observed property count rose 7.8%, from 446 on 28 July to 481 on 29 July. You cannot discuss changes in the numerator while the denominator is moving.
Third, the curve contains thin cross-sections to begin with. The median observed property count on Kumamoto’s 13 August arrival curve is 396, but LT70 has only 21 properties, LT68 only nine and LT42 only 22. These are thin cross-sections falling well below 60% of the median, and this article excludes them from the chart (the breaks in the line are where they were removed). Plotted without exclusion, an aggregate from nine properties would connect to an aggregate from 396 properties with a line of identical weight, showing readers “troughs” and “peaks” that do not exist.
What can be said about Obon demand at this point: Estimated OCC for Kumamoto’s Obon peak (13 August 2026 arrivals) stood at 86–88% at LT20–16 before the quake (July 2026), well above Kagoshima’s 71–72%. In other words, even before the quake, Kumamoto’s Obon was among the better-booked markets in Kyushu. How the quake moves that level cannot be separated out without at least one to two weeks of accumulated observation, because cancellations (downward pressure) and inventory withdrawal (apparent upward pressure) are acting at the same time.
8. Demand Shifts to Other Kyushu Prefectures — What Became of the Asymmetry Argument?
The previous article presented a record from 2016: Oita Prefecture, some 87 km away, fell further (−39.4% year on year in May) than Kumamoto Prefecture, which contained the epicentre (−10.6% in May). The argument was that “seismic intensity decays with distance, but cancellations do not.” Can that argument be tested three days after the quake?
The short answer is that it cannot yet be tested, but the direction to monitor can be identified.
Look again at the chart in Section 6. For check-ins from 29 to 31 July 2026, Kumamoto’s estimated OCC (July 2026 check-ins) appears to rise, while the average of Kyushu’s other six prefectures falls from 86.0% to 84.5% to 80.1%. Kumamoto over the same period runs 90.4% → 90.0% → 84.5%. What can be observed at this point, in other words, is not a picture of “the affected prefecture rising as demand flows to neighbouring prefectures” but one in which “the affected prefecture rises in appearance through inventory withdrawal, while neighbouring prefectures actually fall.”
That said, this three-day decline cannot be attributed definitively to the earthquake. 29–31 July are Wednesday, Thursday and Friday, so comparison with the immediately preceding weekend carries a day-of-week factor. The fact that all seven Kyushu prefectures show a decline in the same direction also suggests common factors other than the quake are at work (within-week demand patterns, last-minute cancellations being reflected, and so on). In the 2016 record, the deepest declines across Kyushu’s prefectures came in the month after the event (May, for an event on 14 April) — one of the previous article’s lessons being that you must not judge from the figures of the month in which the disaster occurs. As for how far that 2016 disaster area subsequently recovered, our analysis Kumamoto Quake 10Y x Aso: Data on Recovery and Tourism Brand Rebound traces the recovery curve over a ten-year span.
It is worth setting out the indicators to monitor.
| Monitoring target | Indicator to watch | Why watch it |
|---|---|---|
| Affected prefecture (Kumamoto) | Actual inventory volume (rooms) and observed property count. Do not use estimated OCC | Occupancy overshoots because of inventory withdrawal and points in the opposite direction to reality |
| Onsen areas (Oita, northern Kumamoto) | Inventory sell-through pace for late August–September; inventory returning from cancellations | In 2016 the drop in leisure demand was deepest here, and it did not correspond to distance |
| Urban markets (Fukuoka) | Weekday occupancy in the corporate segment | In 2016, Fukuoka — with its high share of business demand — had the shallowest downside and the fastest recovery |
| Inbound travellers | Trends in foreign-language review postings; whether multilingual status updates are being issued | The slowest segment to recover in 2016 — it took more than twice as long as domestic guests |
| All prefectures | The following month’s (August) monthly figures | The 2016 trough came in the month after the event. Do not judge from the figures of the month of the disaster |
Source: Compiled by the HotelBank Editorial Team (2016 actuals per the previous article’s analysis based on the Japan Tourism Agency’s “Overnight Travel Statistics Survey”)
The rate baseline is also worth recording. According to MetroEngines Research, Kumamoto Prefecture’s estimated transacted ADR for August 2026 was approximately ¥12,200 (N=389 properties), against an actual of approximately ¥11,400 for August 2025 (N=385 properties) — a level of +7.0% year on year. Note, however, that this August figure was aggregated as of 26 July 2026 and does not reflect the 28 July earthquake. It is meaningful to record as a pre-quake baseline, but it does not represent current sales conditions.
9. Restoration and Reopening Announcements — “Coming Back” Information Began on Day 3
Listing only closure information misrepresents the situation. 30–31 July, the third day after the quake, was also the point at which reopening and restoration notices began to appear.
| Issuing body | Content | Date/time |
|---|---|---|
| JR Kyushu | Kyushu Shinkansen service resumed between Hakata and Kumamoto on a reduced timetable (after three days). Through-services with the Sanyo Shinkansen remain suspended | 31 July 2026 |
| MLIT | No cancellations at either Kumamoto Airport or Amakusa Airfield from 30 July onward. Both have operated normally since 29 July | Report No. 12 / as of 12:00, 31 July 2026 |
| MLIT | Closures on nationally administered highways due to damage reduced to zero (the Route 57 closure was lifted) | Report No. 12 / as of 10:30, 31 July 2026 |
| MLIT | No isolated communities at this time | Report No. 12 / as of 10:30, 31 July 2026 |
| Via Inn Prime Kumamoto | Inspection and restoration work complete. Large communal bath, elevators, breakfast venue, business lounge, electricity, water and Wi-Fi all available; operating normally. Only housekeeping capacity restricted | As of 09:00, 31 July 2026 |
| Mitsui Garden Hotel Kumamoto | In-house elevators, multi-storey car park and hot water systems all restored. Suspension of reservations nonetheless continues through 30 September | 29 July 2026 (restoration) / 31 July (update) |
| Toyoko Inn | Six of the seven covered properties in Kumamoto Prefecture have resumed operations. Only the Shin-Yatsushiro Ekimae property remains closed | As of 23:30, 30 July 2026 |
| Washington Hotel | Safety checks conducted at two properties in Kumamoto City confirming no impediment to operations. Operating as normal | 30 July 2026 |
| Kumamoto Prefecture / Japan Water Works Association / MLIT | 81 water tankers deployed within the prefecture (62 of them active). Portable water purification units from the Japan Water Agency being prepared for dispatch | Report No. 12 / as of 11:30, 31 July 2026 |
Source: Compiled by the HotelBank Editorial Team from MLIT, “On the Damage Situation Caused by the Reiwa 8 Kumamoto Earthquake (Report No. 12)” (as of 13:30, 31 July 2026), JR Kyushu and official announcements from each operating company
On the other hand, no lodging property within the scope of this survey has published a definite reopening date. Every property that announced a closure has used phrasing such as “for the time being” or “undecided” — understandable when water outages continue and there is no visibility on lifeline restoration. Whether Yatsushiro City’s roughly 25,300 households without water begin to be reconnected is the single biggest variable governing when the area can reopen.
10. Practical Implications for Operators, Municipalities and Publishers
To lodging operators: publish “we are open” as primary information on your own site. As this article has confirmed, the absence of inventory on online sales channels can be received by a third party as a signal that “this property may be closed.” Even when the reality is that the property is full with recovery personnel, or is simply throttling new sales, that distinction cannot be made from outside. Properties that posted their operating status with a date and time on their operator’s official site have been handled accurately even in third-party research like ours. The cost of posting is low and the effect in preventing misunderstanding is large. Notices that include an update timestamp (phrasing such as “*as of 09:00, 31 July 2026”) were particularly useful, because the freshness of the information can be judged.
To municipalities and tourism associations: do not build a “list of properties that are open” — build a route to primary information. As the previous article noted, a third party cannot guarantee that an individual property is operating. Our measurements substantiate that difficulty in numbers. The inventory data makes 36 properties look as though they have “disappeared,” but the number officially suspended is six within the verifiable range — and the top three properties whose inventory vanished were operating. What should be aggregated is not a determination of operating status but a route to each property’s official announcement. Beyond that, continuously publishing municipality-level lifeline information such as the number of households without water has practical value as material for inferring whether lodging is possible.
To those working with the data: do not use post-disaster occupancy as a demand indicator. As Section 6 showed, estimated occupancy in a disaster-hit area overshoots because of inventory withdrawal, and the indicator points in the opposite direction to reality. To treat a post-disaster area quantitatively, the minimum procedure is: (1) fix the population using pre-quake observation records; (2) check the observed property count daily and stop comparing if there is a discontinuity; (3) take the difference against an unaffected control area; and (4) look at actual volume in rooms rather than rates. This article followed that procedure — and still arrives at the conclusion that “Obon demand cannot be judged.”
To those involved in wide-area coordination: start from “rooms usable right now,” not total stock. The previous article mapped stock of 13,269 rooms within 30 km of the epicentre and 40,661 rooms within 80 km. This article indicates that roughly 8–15% of the stock within 30 km may already be unusable. Further, the example of the 651 rooms whose inventory went to zero suggests that a substantial number of rooms, though operating, are already filled by recovery personnel. Capacity planning must start not from peacetime stock but from what remains after subtracting two stages: stoppages caused by damage, and pre-emption by recovery demand. And that remainder increases rapidly by widening the distance band one step — a conclusion from the previous article that still holds.
11. Data Notes, Methodology and Limitations
Aggregation methodology
- Fixing the population: Limited to lodging properties in Kumamoto Prefecture for which sales inventory for August 2026 check-ins was observable on at least 10 days before the quake (before 16:27 on 28 July 2026) — 299 properties, 17,995 rooms. Including thinly observed properties would cause observation noise to be misread as inventory loss.
- The four inventory-signal categories: For observations after the quake (from 29 July onward), cases where no observation data could be obtained are C; cases with zero days of observable inventory are B; cases falling to one-third or less of the pre-quake level are D; all others are A.
- Distance from the epicentre: Great-circle distance between the epicentre published by JMA (32.6°N, 130.7°E, depth 16 km, provisional) and each property’s location coordinates.
- Estimated OCC control: Daily estimated OCC for Kumamoto Prefecture and the simple average for Kyushu’s other six prefectures (Fukuoka, Saga, Nagasaki, Oita, Miyazaki, Kagoshima) were compared, taking the difference to cancel out common seasonal factors.
- Exclusion of thin cross-sections: On the booking curve, LT cross-sections whose observed property count fell below 60% of that series’ median were excluded from the chart (for 13 August arrivals in Kumamoto Prefecture: LT70 with 21 properties, LT68 with nine and LT42 with 22).
- Criteria for naming properties: Properties named in connection with closure, suspension of operations or suspension of reservations are limited to those where the relevant notice was confirmed on the official site of the property itself or its operating company. We confirmed that the notice was issued after the 28 July earthquake, excluding pre-existing closures unrelated to the quake. One record retaining a former name at the same coordinates was excluded from the aggregation as a duplicate.
Limitations and caveats
- Inventory data is not a primary source on whether a property is operating. This article measures directly that false positives (operating yet inventory disappears) and false negatives (suspended yet inventory remains) both genuinely occur. Please always confirm whether an individual property is operating via that property’s official announcement.
- This data is aggregated from information listed on online sales channels and is not a complete census. Ryokan, minshuku and simple lodging houses that are not listed are excluded. The fact that only six closed properties could be officially verified here does not mean only six are closed.
- Figures for damage, evacuation, lifelines and transport are all provisional values as of the point in time stated in the text and will change as they are refined. Seismic intensities, water-outage household counts and closed road sections were in fact updated even while this article was being written.
- The 0–10 km band contains only six properties and 187 rooms, so movement at a single property swings the rate considerably. Rates should be interpreted with care.
- Estimated transacted ADR is an estimate based on publicly listed sales prices and differs from actual transacted prices. The August 2026 value cited here was aggregated as of 26 July 2026 and does not reflect the 28 July earthquake.
- This article does not forecast future demand. As stated in Section 7, the impact on Obon demand cannot be judged from the data available at this point.
⚠ Note on ADR for future dates: ADR in this article is an estimate based on sales prices publicly listed on OTAs and similar channels at the time of the survey, and it fluctuates as the check-in date approaches. Values cited here for August 2026 and later were aggregated as of 26 July 2026 and do not reflect changes in sales conditions caused by the 28 July earthquake. Please note that they do not represent current sales prices.
Summary
In the 72 hours since the Reiwa 8 Kumamoto earthquake, transport has recovered substantially. The Kyushu Shinkansen resumed service between Hakata and Kumamoto on 31 July, expressway closures fell from 17 sections on 3 routes to 9 sections on 2 routes, and closures on nationally administered highways fell to zero. Neither Kumamoto Airport nor Amakusa Airfield has had a cancellation since 30 July. Water outages, however, still affect approximately 79,100 households, of which Yatsushiro City accounts for roughly 25,300. Just over 9,100 people remain evacuated, and 35 have died, including one case where the connection is still under investigation (both per Kumamoto Prefecture, 31 July).
On lodging supply, this article has presented two figures. Closure, suspension of operations or suspension of reservations could be verified through official announcements at six properties, 830 rooms; the inventory signal was lost in the data at 36 properties, 3,218 rooms. The reality lies between the two, and an order of magnitude of 1,000–2,000 rooms is the reasonable view. That corresponds to roughly 8–15% of the 13,269 rooms of stock within 30 km of the epicentre.
What this article most wants to say, however, is that the very fact that these two figures do not match is the lesson about how to read data during a disaster. The top three properties by room count whose inventory went to zero in the data — 651 rooms — were all operating normally according to their operators’ official announcements, and one of them had resumed online sales altogether by that same evening. Conversely, a property that officially announced it had suspended reservations through 30 September still showed 11 days of inventory in the data after the quake. The errors run in both directions.
That structure propagates straight into demand indicators. Kumamoto Prefecture’s estimated OCC (July 2026 check-ins) ran 1.07 points below the average of Kyushu’s other six prefectures over the 13 days before the quake, then 4.76 points above it over the three days after — a swing of 5.83 points. But this is not demand. The 1,851 rooms whose inventory went to zero represent 9.4% of the 19,623-room estimated-OCC population, creating up to 9.4 points of upward pressure on their own. Occupancy in a disaster-hit area reads higher the deeper the damage on the supply side. The indicator points in the opposite direction to reality.
The impact on Obon demand cannot be judged at this point. The booking curve for 13 August arrivals has only one post-quake observation point, the observed property count moved 7.8% on that single day, and the series contains cross-sections observed at just nine properties. In the 2016 record, the deepest declines across Kyushu’s prefectures came in the month after the event. Do not judge from the figures of the month of the disaster — that is the lesson carried forward from ten years ago.
We hope for the swiftest possible recovery in the affected areas.
Related Reading
- Kumamoto’s 11,702 Business Hotel Rooms: Can They Carry Recovery?
- Kumamoto Quake 2026: 2016 Recovery Curve as Kyushu’s 7-Pref Benchmark
- TSMC Fab 2 & Kumamoto’s Chip Corridor: Kikuyo–Koshi–Ozu ADR 2024–2026
- Kumamoto Quake 10Y x Aso: Data on Recovery and Tourism Brand Rebound
- Noto Earthquake +16 Months: Wakura Onsen Recovery & Summer 2026 ADR
References and Sources
■ Data sources
Lodging inventory, room counts, locations, estimated OCC and estimated transacted ADR are aggregated by MetroEngines Research. Damage, evacuation, lifeline and transport figures are values published by the Cabinet Office, MLIT, JMA and Kumamoto Prefecture (provisional at each point in time). Operating status of individual properties is from official announcements by each property and operating company (verified 31 July 2026).
■ Calculation assumptions
The population is fixed at the 299 properties and 17,995 rooms in Kumamoto Prefecture for which sales inventory for August 2026 check-ins was observable on at least 10 days before the quake (before 16:27 on 28 July 2026). Inventory signals use four categories A–D (definitions in Section 2). Distance from the epicentre is the great-circle distance from the JMA-published epicentre (32.6°N, 130.7°E). Estimated OCC is compared as the difference between daily simple averages for Kumamoto Prefecture and Kyushu’s other six prefectures. Details in Section 11.
■ Limitations and caveats
Lodging inventory data is not a primary source on whether a property is operating; false positives (operating yet inventory disappears) and false negatives (suspended yet inventory remains) both genuinely occur. This is aggregated from information listed on online sales channels and is not a complete census. The 0–10 km band has a small population of six properties. Figures from official announcements are all provisional and subject to future change. Details in Section 11.
■ Primary disaster information (public bodies)
- MLIT, “On the Damage Situation Caused by the Reiwa 8 Kumamoto Earthquake” (Report No. 12, as of 13:30 on 31 July 2026 / Report No. 5, as of 14:00 on 29 July 2026)
- Cabinet Office, “On the Damage Situation Relating to the Reiwa 8 Kumamoto Earthquake” (as of 06:30 on 30 July 2026)
- Kumamoto Prefecture, “Information on the Reiwa 8 Kumamoto Earthquake”
- NHK, “Kumamoto Earthquake: 35 Dead Including Cases Under Investigation, Kumamoto Prefecture Announces” (31 July 2026)
- NHK, “Approximately 79,100 Households Without Water in Kumamoto Prefecture; Water Supply Point Status” (as of 07:30 on 31 July 2026, announced at the Kumamoto Prefecture disaster response headquarters meeting)
- Kyushu Railway Company (JR Kyushu), service status and “On the Damage Caused by the Reiwa 8 Kumamoto Earthquake” (29 July 2026, updated 31 July)
■ Lodging property operating status (official announcements by each property and operating company / verified 31 July 2026)
- HOTEL AZ Kumamoto Yatsushiro Miyahara, “[Kumamoto Yatsushiro Miyahara] Notice of Temporary Closure” (28 July 2026)
- Toyoko Inn, “On Operating Status in Areas Affected by the Reiwa 8 Kumamoto Earthquake” (posted 29 July 2026 / updated 23:30, 30 July)
- Yatsushiro Grand Hotel official site, notice of suspension of operations
- Super Hotel Kumamoto Yatsushiro official site, notice of temporary suspension of operations (28 July 2026)
- Super Hotel, “News” (28 July 2026, operating status of properties in Kumamoto Prefecture)
- THE BLOSSOM KUMAMOTO, “Regarding the Suspension of In-House Facilities and Changes to Operations Due to the Earthquake” (posted 29 July 2026 / as of 10:30, 30 July)
- Mitsui Garden Hotel Kumamoto official site, notice of suspension of reservations (28 July 2026 / updated 31 July)
- JR-West Via Inn Hotels, “[Important] Information Regarding the Impact of the Earthquake” (posted 30 July 2026 / updated 09:00, 31 July)
- Fujita Kanko, “Notice of Operating Status Following the Kumamoto Earthquake” (30 July 2026)
■ News coverage
- Nihon Keizai Shimbun, “Successive Temporary Closures and Reservation Suspensions at Kumamoto Hotels” (29 July 2026)
- Kumamoto Nichinichi Shimbun, “Kumamoto–Hakata Reopens After Three Days: Kyushu Shinkansen, JR Kyushu” (31 July 2026)
■ Lodging market data
- MetroEngines Research — locations, room counts and category of lodging properties in Kumamoto Prefecture; observation of sales inventory for August check-ins (N=299 properties / 17,995 rooms, aggregated 31 July 2026)
- MetroEngines Research — daily estimated OCC for Kyushu’s seven prefectures (Kumamoto Prefecture N=436 properties / 19,623 rooms; other six prefectures N=2,327 properties / 128,051 rooms; July 2026 check-ins)
- MetroEngines Research — booking curve for 13 August 2026 check-ins (Kumamoto Prefecture 519 properties / 21,333 rooms; Kagoshima Prefecture 531 properties / 20,802 rooms)
- MetroEngines Research — monthly estimated transacted ADR for Kumamoto Prefecture (August 2026 N=389 properties; August 2025 N=385 properties; aggregated 26 July 2026)
- MetroEngines Research — prefecture-wide re-retrieval of listing status for check-ins from 1 to 30 August across 635 properties in Kumamoto Prefecture (conducted on the evening of 31 July 2026)
■ Historical records and statistics
- Japan Tourism Agency, “Overnight Travel Statistics Survey” (e-Stat table IDs 0003313520 and 0003313904)
- HotelBank Editorial Team, “Guest Room Stock Across the 21 Disaster Relief Act Municipalities of the Reiwa 8 Kumamoto Earthquake” (29 July 2026)
- HotelBank Editorial Team, “Seismic Intensity Decays with Distance, Cancellations Do Not — The Kumamoto Earthquake and Kyushu Lodging Demand” (29 July 2026)