

At 16:27 on July 28, 2026, a magnitude 7.1 earthquake struck with its epicenter in the Kumamoto region of Kumamoto Prefecture, registering a seismic intensity of 7 in Uki City and Hikawa Town, Yatsushiro District. The full extent of the damage is still being assessed, and our thoughts are with everyone affected. This article does not address the damage itself. Instead, it uses published statistics and lodging market data to map out how much lodging capacity — the regional infrastructure that will house the people carrying out the recovery — exists in the Kumamoto area, and in what form.
Scope and editorial care
The 2026 Kumamoto Earthquake is an ongoing disaster, and figures on casualties, housing damage, utilities and transport are being updated continuously. Every disaster-related figure cited here is attributed to a named publishing body and a specific point in time, and is limited to what could be confirmed as of July 29, 2026. For the latest situation, please refer to announcements from the Cabinet Office (Disaster Management), the Ministry of Land, Infrastructure, Transport and Tourism, Kumamoto Prefecture, and the Japan Meteorological Agency.
On whether individual properties are operating and what damage they have sustained, the only reliable sources are the official announcements each property issues itself. The lodging market data used here is based on inventory and rate listings; the presence or absence of a listing cannot be used to judge whether a property is operating. We make no reference whatsoever to damage at individual properties.
Metric Definitions Used in This Article
- ADR (average daily rate): An estimated settled rate (tax-exclusive equivalent), calculated by applying category-specific adjustment coefficients to the lowest-priced plan each property publishes on OTAs and similar channels (double occupancy, per-room rate, tax included). Cross-checked against property-level actuals disclosed by listed hotel REITs, the median error is approximately 7%. These are estimates and differ from each property’s actual transacted prices and accounting figures. Area-level ADR is the median across the properties in scope (the level of a typical property in that area).
- OCC (occupancy rate): The share of sold rooms against total rooms in an area (an estimate based on OTA sales inventory). Used only at the prefecture and municipality level, never for individual properties.
- Room occupancy rate (Accommodation Travel Statistics Survey): Official statistics published by the Japan Tourism Agency. Properties are tabulated in two groups — those where leisure guests account for 50% or more of stays, and those where they account for under 50%. In this article we refer to the latter as business-oriented properties and the former as leisure-oriented properties.
- Data sources: MetroEngines Research & Consulting (lodging market data) / Japan Tourism Agency, “Accommodation Travel Statistics Survey” / Ministry of Land, Infrastructure, Transport and Tourism, “Statistical Survey on Building Construction Starts” (both via e-Stat)
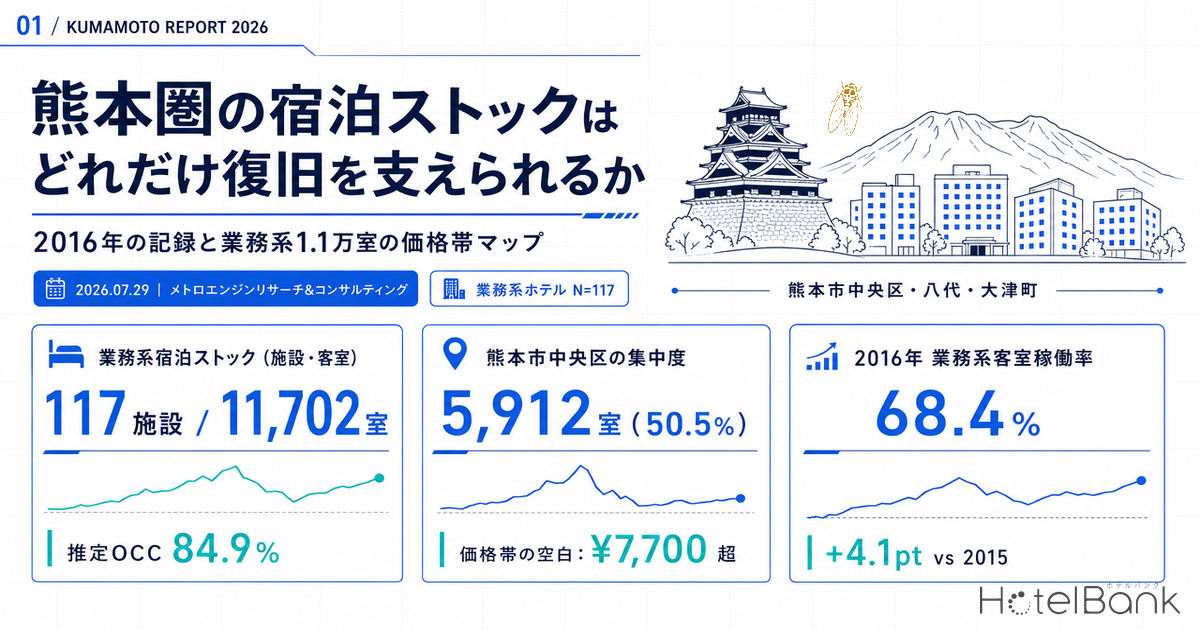
- — Kumamoto Prefecture’s business-use lodging stock totals 117 properties and 11,702 rooms. Of these, 5,912 rooms (50.5%) sit in Chuo-ku, Kumamoto City, and 7,359 rooms (62.9%) in Kumamoto City as a whole.
- — In 2016, room occupancy at business-oriented properties recovered to 68.9% in June, two months after the quake, exceeding the same month a year earlier by 11.3 points. The full-year figure was 68.4% (+4.1pt year on year).
- — Construction starts for lodging-use buildings ran at 3.6–3.7 times the pre-quake year’s building count from 2017 through 2019. Recovery-related construction activity stayed elevated for more than three years.
- — Current estimated OCC is 84.9% for the business hotel category (July 1–29, 2026). Spare capacity to absorb new demand comes to only about 1,160 rooms in the mid-case scenario.
- — Only 2 of 88 properties have an estimated settled ADR above ¥12,000. The prefecture is structurally short of mid-priced product built for extended stays.
Housing the people who carry out recovery — what lodging takes on immediately after a disaster
According to the Japan Meteorological Agency, the earthquake occurred at 16:27 on July 28, 2026, with its epicenter in the Kumamoto region of Kumamoto Prefecture, a magnitude of 7.1, and a maximum seismic intensity of 7 observed in Uki City and Hikawa Town, Yatsushiro District. The agency noted that four earthquakes of intensity 5-minus or above had occurred by 23:00 on July 28 and called for continued vigilance, citing “past cases in which quakes of similar scale continued for roughly a week.” The Prime Minister’s Office reported that, as of 17:35 on July 28, power outages affected a total of 48,280 households in Kumamoto Prefecture and elsewhere, and city gas supply was suspended to approximately 500 households. The tsunami advisory was lifted at 18:10 the same day. The Ministry of Land, Infrastructure, Transport and Tourism has published damage updates continuously, from its first report as of 18:10 on July 28 through its fifth report as of 14:00 on July 29, and the Cabinet Office (Disaster Management) has compiled the damage situation as of 07:00 on July 29.
In a disaster-struck region, the first role lodging plays is not to host tourism. During the emergency response phase, support units arrive from local governments, police, fire services, the Self-Defense Forces, and the electricity, telecommunications, gas and water utilities. After that the roster turns over — damage assessment, emergency repairs, then full-scale reconstruction work — and visitors from outside the region keep flowing in continuously over months and years. This kind of stay differs in character from both ordinary business travel and leisure travel.
First, it is long. Consecutive stays of several weeks to several months per work zone are the norm, and the same individual stays repeatedly at the same property. Second, it is weekday-centered. Because returning home on weekends is standard practice, demand stacks up heavily from Monday through Thursday. Third, room-only stays and simple meals are what is wanted. Early departures and late returns are routine, so practical features matter more than elaborate in-house dining: light meals available early in the morning, laundry facilities, parking space, and provision for handling work clothes. Fourth, price tolerance follows corporate rules. Rates that fit within per-diem and lodging allowance regulations get chosen, so demand does not flow readily to the very top of the price range.
In other words, a new layer of demand lands squarely on the territory that existing business hotel and city hotel stock is inherently good at serving. Below, we first review how the record from a decade ago captured this demand, then map where the current Kumamoto-area stock sits, at what price points, and in what volume.
The 2016 record — business-oriented properties beat the prior year from two months after the quake
The Japan Tourism Agency’s “Accommodation Travel Statistics Survey” publishes room occupancy rates with properties split into two groups: those where leisure guests account for 50% or more of stays, and those where they account for under 50%. The latter is effectively the set of properties serving primarily business use, and placing these two groups side by side makes what happened in Kumamoto Prefecture in 2016 clearly legible.
Room occupancy at business-oriented properties fell to 51.9% in April 2016, the month of the quake — a decline of 7.4 points from 59.3% in the same month a year earlier. Two months later, however, it had recovered to 68.9% in June, exceeding the prior-year 57.6% by 11.3 points. From there it stayed consistently above the prior year through the end of the year: 72.1% in July (+7.8pt), 76.4% in November (+7.0pt), and 69.9% in December (+6.9pt). The full-year figure came to 68.4%, up 4.1 points from 64.3% in 2015 and 7.0 points from 61.4% in 2014.
Leisure-oriented properties moved differently. May 2016 came in at 40.0%, 5.9 points below the prior-year 45.9%, and the shortfall persisted from summer into autumn — 52.9% in August (-2.6pt) and 43.5% in October (-3.7pt). The full year finished at 43.1%, only marginally above the prior year’s 41.8%, and the gap against the business-use segment widened.
| Segment | 2014 | 2015 | 2016 | 2016 change vs. prior year |
|---|---|---|---|---|
| Business-oriented properties (leisure share under 50%) | 61.4% | 64.3% | 68.4% | +4.1pt |
| Leisure-oriented properties (leisure share 50% or more) | 39.4% | 41.8% | 43.1% | +1.3pt |
| All properties | 52.7% | 55.3% | 58.0% | +2.7pt |
Total guest nights show the same pattern. Guest nights at business-oriented properties were down 3.3% year on year in May 2016, but by June had reached 338,170 — 19.0% above the prior-year 284,200 — and July continued with a 6.3% gain. The full year came to 4,033,170 guest nights (+3.2% year on year). Over the same period, leisure-oriented properties fell 19.0% year on year in May and 10.8% in August, ending the year at 3,242,020 guest nights (+0.7%).
What this time series shows is a particular shape of demand: both leisure and business demand fall in the first one to two months after a disaster, but the business side reverses within roughly two months and then holds at a high level for at least the remainder of the year. That said, inbound demand in Kumamoto Prefecture was also recovering over the same period in 2016, so not all of the occupancy gain can be attributed to recovery-related demand. Even so, the fact that business-use and leisure-use properties diverged clearly in both the timing and the slope of their recovery indicates that business-purpose stays were structurally thickening during this period. For how far the leisure side came back over the following decade, Kumamoto Quake 10Y × Aso: Data on Recovery and Tourism Brand Rebound traces the longer trajectory.
The timeline in construction starts — recovery-related building activity ran for more than three years
In gauging how long demand persists, the trajectory of construction activity itself is a strong clue. Lining up annual construction starts for lodging-use buildings in Kumamoto Prefecture from the Ministry of Land, Infrastructure, Transport and Tourism’s “Statistical Survey on Building Construction Starts” makes the shift from 2016 onward legible.
Activity had been running at low levels — 11 buildings and 8,283 m² in 2015, and 14 buildings and 7,551 m² in 2016 — before doubling to 31 buildings and 12,413 m² in 2017, then holding high for three consecutive years at 52 buildings and 31,374 m² in 2018 and 51 buildings and 32,256 m² in 2019. Building counts reached 3.6 to 3.7 times the 2016 level, and floor area around 4.2 times.
One caveat matters here: lodging-use construction starts in this period cannot be explained by recovery purposes alone. The years 2017 through 2019 were when inbound demand was expanding nationwide and new lodging development was at its most active. The increase therefore includes both the rebuilding and restoration of damaged lodging properties and new development betting on market growth. Even so, the timeline — starts ramping up from the year after the quake and staying elevated for at least three years — suggests that construction activity tied to recovery does not wind down quickly. The same question of duration has been observed after disasters elsewhere; on the aftermath of the Noto Peninsula earthquake, Noto Earthquake +16 Months: Wakura Onsen Recovery & Summer 2026 ADR sets out how the lodging side has moved.
More recently, 2024 again reached a high level at 59 buildings and 30,219 m². Behind this lies the semiconductor-related industrial cluster discussed next.
Where Kumamoto’s business-use lodging stock sits
Within the scope tracked by MetroEngines Research, operating business hotels, city hotels and capsule hotels in Kumamoto Prefecture total 117 properties and 11,702 rooms (as of July 29, 2026). Across all categories the figure is 476 properties and 18,377 rooms, meaning stock serving business use accounts for just over 60% of the prefecture’s rooms. Note that this tabulation covers properties whose listings can be confirmed on OTAs and similar channels; it is not a complete census, and unlisted ryokan, minshuku and simple lodging houses are excluded.
Three features characterize the distribution. First, concentration in Chuo-ku, Kumamoto City. Chuo-ku alone holds 43 properties and 5,912 rooms, or 50.5% of the prefecture’s business-use rooms. Adding Nishi-ku (930 rooms), Higashi-ku (342 rooms) and Kita-ku (175 rooms) brings Kumamoto City to 7,359 rooms, or 62.9% of the prefecture. The same area is where the prefectural and city government offices and the branch offices of infrastructure operators — the bases for recovery work — are clustered, and it has the greatest capacity to absorb business demand even in normal times.
Second, the weight of Yatsushiro City. With 8 properties and 889 rooms, it is the largest outside Kumamoto City after Ozu Town. Yatsushiro City adjoins Hikawa Town, where intensity 7 was recorded, and is also a transport hub for the south of the prefecture. Its estimated settled ADR was ¥6,500 as of June 2026, up 14.3% from ¥5,700 in the same month a year earlier (N=20 properties) — the clearest increase among the prefecture’s main cities.
Third, the industrial cluster area of Ozu Town, Kikuyo Town and Koshi City. These three municipalities hold 10 properties and 1,339 rooms. Ozu Town in particular has 6 properties and 912 rooms, a room count that stands out relative to its population. Business demand tied to semiconductor-related plant construction and ramp-up has underpinned lodging stock in this area even in normal times.
| Municipality | Properties | Rooms | Estimated settled ADR June 2026 | YoY | Properties in ADR calculation |
|---|---|---|---|---|---|
| Chuo-ku, Kumamoto City | 43 | 5,912 | ¥7,700 | -5.1% | 57 |
| Nishi-ku, Kumamoto City | 8 | 930 | ¥7,700 | -6.9% | 9 |
| Ozu Town | 6 | 912 | ¥8,000 | -8.0% | 13 |
| Yatsushiro City | 8 | 889 | ¥6,500 | +14.3% | 20 |
| Higashi-ku, Kumamoto City | 2 | 342 | ¥5,700 | +2.9% | 3 |
| Kikuyo Town | 3 | 276 | ¥6,800 | -9.4% | 4 |
| Uto City | 3 | 123 | ¥6,000 | +1.7% | 3 |
| Uki City | 2 | 97 | ¥5,400 | +3.8% | 4 |
Prefecture-wide estimated OCC (based on OTA sales inventory) stood at 84.9% for the business hotel category (July 1–29, 2026), 88.0% for the city hotel category (same period), and 83.9% across all categories (same period). These are high levels for a summer average, and they show that there is no large pool of unsold rooms even in normal times. When recovery-related stays are added, it is hard to argue that existing stock has much room to absorb a large increase — and longer stays simultaneously reduce turnover. The following chapters examine this in detail.
How semiconductor construction demand overlaps — competing for the same rooms
Business demand in the Kumamoto area has already thickened by one notch over the past few years. The semiconductor-related industrial cluster centered on Kikuyo Town, Ozu Town and Koshi City has made extended stays tied to plant construction and production ramp-up a permanent fixture. This demand closely resembles recovery-work demand in terms of the kind of room it needs. Four conditions — long stays, weekday-centered, room-only, corporate price bands — align almost exactly, so the two compete for the same room inventory. For how this industrial demand has actually moved ADR in Kikuyo, Koshi and Ozu, TSMC Fab 2 & Kumamoto’s Chip Corridor: Kikuyo–Koshi–Ozu ADR 2024–2026 examines 32 months of data.
Estimated settled ADR in Chuo-ku, Kumamoto City held steady in the ¥8,000s through 2025, then became more volatile entering 2026, with June at ¥7,700, down 5.1% year on year. Looking ahead, the listings observed at the time of this survey imply levels above ¥10,000 for September through November 2026. Yatsushiro City shows a clearer move: after running in the ¥5,700–¥6,300 range in the first half of 2025, it rose to ¥6,500 in June 2026 (+14.3% year on year), with rates in the ¥7,900–¥8,700 range listed for July onward. Ozu Town is similar, moving from ¥8,000 in June 2026 to levels above ¥10,000 from September.
Note, however, that figures from July onward are estimates derived from selling rates listed on OTAs and similar channels at the time of the survey, and they shift as the check-in date approaches. It should also be kept in mind that the effects of this earthquake are not necessarily reflected in these figures.
Movement on the supply side
Supply additions continue. Within the scope tracked by MetroEngines Research, Kumamoto Prefecture saw 37 openings and 823 rooms confirmed in 2025 and 33 openings and 1,164 rooms in 2026. The main 2026 additions are Via Inn Prime Kumamoto (232 rooms), Tabino Hotel Aso Kumamoto Airport (213 rooms), Workers Hotel Kumamoto Ozu (202 rooms) and Hotel Amanek Kumamoto (176 rooms). In 2025, Toyoko Inn Kumamoto Airport (208 rooms), Super Hotel Premier Aso Kumamoto Airport (203 rooms) and Onyado Nono Kumamoto Natural Hot Spring Higo-no-Yu (191 rooms) came on line.
Notably, a property explicitly designed around extended stays has opened in Ozu Town. That is a sign that demand generated by the industrial cluster calls for a product specification different from a conventional business hotel.
How to read the supply data: New opening counts are based on the point at which a listing could be confirmed on OTAs and similar channels. Because listings appear several months before opening, counts and room numbers for the most recent months and years will rise as further listings are added. Figures for the second half of 2026 onward reflect what has been confirmed to date and are not final.
Against the prefecture’s 11,702 business-use rooms, new openings in 2025 and 2026 combined total approximately 1,987 rooms. That figure includes resort and ryokan categories, however, so the net addition to business-use stock is smaller. When recovery-related stays are layered on, supply additions will not necessarily keep pace with the increase in demand.
The price-band map — white space above ¥10,000
Breaking down the 88 business-use lodging properties and 10,420 rooms for which an estimated settled ADR could be calculated as of June 2026 by price band brings the market structure into focus.
The ¥6,000-to-under-¥8,000 band concentrates 42 properties and 5,254 rooms, or 50.4% on a room basis. Adding the under-¥6,000 band brings the total to 70 properties and 7,799 rooms — fully 74.8% falling within these two bands. By contrast, the ¥10,000-to-¥12,000 band holds just 5 properties and 717 rooms, the ¥12,000-to-¥15,000 band just 2 properties and 378 rooms, and above ¥15,000 there is nothing at all.
The scatter plot shows properties packed into the mid-scale range of 100 to 250 rooms at ¥6,000 to ¥8,000. This is the standard template common to business hotel markets nationwide, and the Kumamoto area is no exception. Above it, in the territory of ¥10,000 to ¥15,000 at around 100 rooms, almost no properties exist apart from a handful in Chuo-ku, Kumamoto City.
Crowded Standard business hotel band
Estimated settled ADR in the ¥6,000–¥8,000 range × 100–250 rooms. 42 properties and 5,254 rooms concentrate here, half of the prefecture’s business-use rooms. Differentiating on entry is not easy.
Room to grow Extended-stay specialist band
Estimated settled ADR of ¥8,000–¥12,000 × 80–180 rooms. Currently 16 properties and 2,243 rooms. Territory where stay-oriented product with a kitchenette, laundry and a larger work area can find a place.
White space Mid-scale above ¥12,000
The ¥12,000–¥15,000 band holds 2 properties and 378 rooms, and above ¥15,000 there is nothing. Product serving managers and engineers, or medium-term stays with family in tow, barely exists in the prefecture.
Room to grow in product design for consecutive and extended stays
Taking the analysis so far together, Kumamoto-area lodging stock has room to grow in three directions. All three combine raising the capacity to house the people carrying out the region’s recovery over an extended period with the properties’ own profitability.
First, rate design built around consecutive nights. Both recovery-related and industry-related stays run in weekly and monthly units. With a per-night rate structure left unchanged, extended-stay guests see the price as expensive while properties accumulate booking-acquisition costs and cleaning frequency. Designing tiered consecutive-night discounts and making cleaning frequency optional lowers the guest’s effective burden while compressing operating costs. Returning the cost saved through adjusted cleaning frequency into the rate creates room to improve profitability while holding the displayed price steady.
Second, adding stay functionality. Laundry, a kitchenette or shared kitchen, storage space for work clothes and tools, light meals available from early morning, and parking bays that accommodate large vehicles. For extended-stay guests these are reasons to choose a property that outweigh price, and they provide the basis for placing product in the ¥8,000-to-¥12,000 band where the gap has opened. That band currently holds only 16 properties and 2,243 rooms, so even converting a portion of rooms at an existing property to this specification can shift its price-band position.
Third, inventory allocation matched to the time structure of demand. As the 2016 record shows, business-use demand ramps up roughly two months after a disaster and then continues for years. Leisure demand, meanwhile, falls during the same period and returns gradually afterward. This asymmetric recovery curve strengthens the logic of an inventory design that combines period and day of week — allocating weekdays to extended stays and weekends to leisure. A two-tier structure that builds an occupancy base on weekday consecutive stays and layers higher-rate demand on weekends contributes to stabilizing RevPAR across the year.
This chapter does not evaluate how existing properties are operated; it presents product-design options derived from market structure. Actual design requires case-by-case consideration of each property’s location, room specifications and staffing.
Estimating absorption capacity — three scenarios and a two-axis sensitivity on stay length and occupancy ceiling
Let us bundle the figures so far into a single measure: absorption capacity. Against the prefecture’s 11,702 business-use rooms, estimated OCC for the business hotel category was 84.9% (July 1–29, 2026). Since occupancy never reaches 100% in practice, we set a practical occupancy ceiling that accounts for cleaning, renovation and out-of-order rooms, and treat the gap between that ceiling and current occupancy as “spare rooms.” On top of that, we layer an assumption that a certain share of non-business-use rooms (the 6,675 rooms left after subtracting 11,702 business-use rooms from 18,377 rooms across all categories) is converted to business use. All of the following is derived mechanically from market structure and is not actual performance.
| Scenario | Practical occupancy ceiling | Conversion rate from non-business stock | Spare rooms in business-use stock | Additional rooms from conversion | Total absorption capacity | New arrivals absorbed per month |
|---|---|---|---|---|---|---|
| Pessimistic | 88% | 0% | 363 rooms | 0 rooms | 363 rooms | approx. 780 people |
| Mid-case | 92% | 5% | 831 rooms | 334 rooms | 1,165 rooms | approx. 2,500 people |
| Optimistic | 95% | 10% | 1,182 rooms | 668 rooms | 1,850 rooms | approx. 3,960 people |
Even in the mid-case scenario, absorption capacity is about 1,160 rooms and new arrivals absorbed per month come to roughly 2,500 people. Given that the prefecture’s business-use stock exceeds 10,000 rooms, that margin is by no means large. The longer stays become, the lower the turnover per room, so the same room count houses fewer people. The table below develops this relationship along two axes: the practical occupancy ceiling and average stay length.
| Occupancy ceiling | Spare rooms | 7-night stay | 14-night stay | 21-night stay | 30-night stay | 60-night stay |
|---|---|---|---|---|---|---|
| 86% | 129 rooms | 550 | 280 | 180 | 130 | 60 |
| 88% | 363 rooms | 1,560 | 780 | 520 | 360 | 180 |
| 90% | 597 rooms | 2,560 | 1,280 | 850 | 600 | 300 |
| 92% | 831 rooms | 3,560 | 1,780 | 1,190 | 830 | 420 |
| 95% | 1,182 rooms | 5,070 | 2,530 | 1,690 | 1,180 | 590 |
Two things stand out. First, as average stay length extends from 7 days to 30 days, monthly absorption falls to less than a quarter. The longer recovery-work stays run, the more sharply the number of people the same stock can rotate through declines. Second, pushing the occupancy ceiling up 4 points from 88% to 92% multiplies spare rooms by roughly 2.3 times. A few points of upside from better cleaning and inventory management has an impact on absorption capacity comparable to shortening stay length. Consecutive-night discounts and optional cleaning frequency ease the guest’s burden and, at the same time, are levers for raising that occupancy ceiling.
This estimate is a structural calculation derived mechanically from published statistics and lodging market data. Actual absorption capacity will vary widely with each property’s damage status, staffing and corporate contract arrangements. It does not indicate whether any specific property is operating.
Conclusion — lodging as regional absorption capacity
The Kumamoto area’s business-use lodging stock comes to 117 properties and 11,702 rooms, half of it concentrated in Chuo-ku, Kumamoto City. Estimated OCC for the business hotel category is already high at 84.9% (as of July 2026). If recovery-related extended stays are added on top, it is hard to argue that existing stock holds much spare capacity. Because longer stays lower turnover per room, the total number of people the same room count can house actually moves in the opposite direction — down.
The record from a decade ago shows this demand ramping up roughly two months after the quake and holding at a high level for at least the rest of that year. The construction-starts statistics show lodging-use building activity staying elevated for more than three years from the year after the quake. The timeline is not short.
On top of that, the price-band distribution shows a structure that is thin above ¥10,000. That also means product with features suited to extended stays barely exists in the prefecture. How much accommodation can be prepared where the people carrying out the recovery can stay for months while maintaining their quality of life? That is an investment question, and at the same time a condition that sets the very pace of the region’s recovery. What is needed most right now is a shift in perspective — seeing lodging not only as a receptacle for tourism, but as the region’s absorption capacity.
⚠ Note on ADR for future dates: The estimated settled ADR figures shown in this article for July 2026 onward are estimates based on selling rates published on OTAs and similar channels at the time of the survey, and they shift as the check-in date approaches. In addition, the effects of the earthquake that occurred on July 28, 2026 are not necessarily reflected in these listed rates. For actual selling and operating status, please check each property’s official announcements.
Related reading
- TSMC Fab 2 & Kumamoto’s Chip Corridor: Kikuyo–Koshi–Ozu ADR 2024–2026
- Kumamoto Quake 10Y × Aso: Data on Recovery and Tourism Brand Rebound
- How TSMC’s Arrival Moved Kumamoto Hotel ADR — Expectations vs. Data Reality
- Noto Earthquake +16 Months: Wakura Onsen Recovery & Summer 2026 ADR
References and sources
■ Data sources
MetroEngines Research & Consulting (estimated settled ADR = municipality-level median, June 2026 / estimated OCC = OTA sales inventory basis, July 1–29, 2026 / lodging property master = as of July 29, 2026 / new openings = OTA listing confirmation basis), Japan Tourism Agency, “Accommodation Travel Statistics Survey” (table IDs 0003313903 and 0003313520), Ministry of Land, Infrastructure, Transport and Tourism, “Statistical Survey on Building Construction Starts” (table ID 0003114490), and published materials from the Cabinet Office (Disaster Management), the Ministry of Land, Infrastructure, Transport and Tourism, the Japan Meteorological Agency, the Prime Minister’s Office and Kumamoto Prefecture (all confirmed as of July 29, 2026).
■ Estimate assumptions
The absorption-capacity estimate takes current estimated OCC of 84.9% (as of July 2026, business hotel category, average for July 1–29) against 11,702 business-use rooms as its baseline, and sets the practical occupancy ceiling at 86–95%, occupancy per room at one guest, and average stay length at 7–60 days. The mid-case scenario assumes a 92% occupancy ceiling and that 5% of the 6,675 non-business-use rooms (18,377 rooms across all categories minus 11,702 business-use rooms) is converted to business use. Monthly absorption capacity is calculated as “spare rooms × 30 days ÷ average stay length.”
■ Limitations and caveats
Estimated settled ADR is an estimate produced by applying category-specific coefficients to the lowest-priced plans listed on OTAs; cross-checked against property-level disclosures from listed hotel REITs, the median error is approximately 7%. It differs from actual transacted prices and accounting figures. Estimated OCC is an estimate based on OTA sales inventory and does not reflect unlisted properties or direct-booking inventory. The lodging property master covers only properties whose OTA listings can be confirmed and is not a complete census. ADR for July 2026 onward is estimated from listed rates at the time of the survey and does not necessarily reflect the effects of the July 28, 2026 earthquake. Whether individual properties are operating, and their damage status, are outside the scope of this article; please refer to each property’s official announcements.
■ Disaster-related (publishing body and reference time noted)
- Cabinet Office (Disaster Management), “On the damage situation related to the 2026 Kumamoto Earthquake” (as of 07:00, July 29, 2026)
- Ministry of Land, Infrastructure, Transport and Tourism, “On the damage situation caused by the 2026 Kumamoto Earthquake” (1st report as of 18:10, July 28 through 5th report as of 14:00, July 29)
- Japan Meteorological Agency, “Information related to seismic activity of the 2026 Kumamoto Earthquake” (time and date of occurrence, magnitude, aftershock activity)
- Prime Minister’s Office, “On the 2026 Kumamoto Earthquake” (July 28, 2026; power outages and city gas suspensions as of 17:35, July 28)
- Kumamoto Prefecture, “Information on the 2026 Kumamoto Earthquake”
■ Government statistics
- Japan Tourism Agency, “Accommodation Travel Statistics Survey,” Table 8: Room occupancy rate (by stay-purpose share) / table ID 0003313903 (e-Stat)
- Japan Tourism Agency, “Accommodation Travel Statistics Survey,” Table 2: Total guest nights (by stay-purpose share) / table ID 0003313520 (e-Stat)
- Ministry of Land, Infrastructure, Transport and Tourism, “Statistical Survey on Building Construction Starts,” by use (52: lodging use) / table ID 0003114490 (e-Stat)
- e-Stat, Portal Site of Official Statistics of Japan
■ Lodging market data
- MetroEngines Research & Consulting — estimated settled ADR (by municipality and by property), estimated OCC (OTA sales inventory basis), lodging property master (category, room count, location), new opening data (OTA listing confirmation basis)
Source: MetroEngines Research & Consulting / Japan Tourism Agency, “Accommodation Travel Statistics Survey” / Ministry of Land, Infrastructure, Transport and Tourism, “Statistical Survey on Building Construction Starts”