

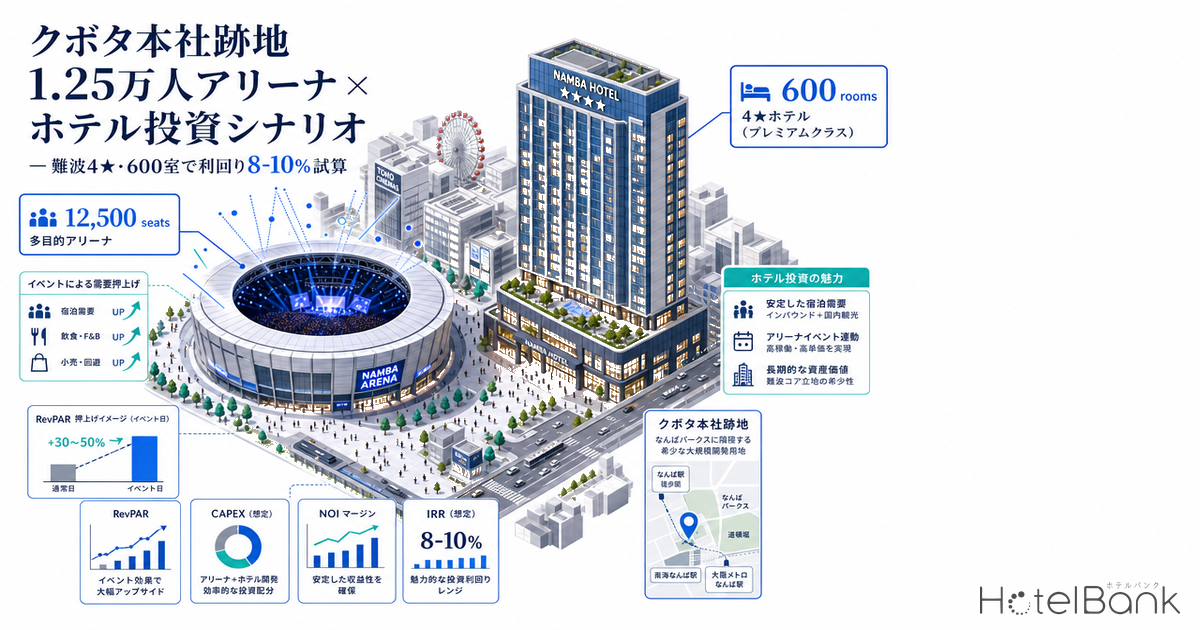
On May 11, 2026, Kubota announced that it had selected a consortium of Mitsui Fudosan and Kanden Realty & Development as the preferred negotiating party for the redevelopment of its former headquarters site in Naniwa-ku, Osaka. On the approximately 24,000m site, an arena seating 12,500, a hotel, and commercial facilities will be constructed, with opening scheduled for 2032 or later. As reported by Sankei Shimbun, a major new entertainment and gathering hub will emerge in the heart of Osaka’s Minami district.
In this article, we examine the scenario “if our firm were to invest in and operate the hotel portion of this development project, what scenarios could be drawn?” Based on the area’s actual ADR and supply-demand data, REIT disclosure performance, and industry benchmarks for construction costs and GOP margins, we have modeled three scenarios. We present projected revenue, GOP, yield, and payback period for each room scale and price segment, exploring optimal positioning that leverages the location’s characteristics (arena and MICE demand).
Metric Definitions Used in This Article
- ADR (Average Daily Rate): Average of publicly listed rates on OTAs. This differs from actual booked prices (compared to REIT disclosure data, the public-rate ADR tends to be +25-30% higher than booked ADR. This is because unsold high-price plans remain visible on OTAs, structurally inflating the average public price above the booked price). Rate per room (tax-inclusive) for 2-person occupancy, averaged across all plans (room-only to plans with meals).
- OCC (Occupancy Rate): Sold rooms as a percentage of total rooms in the area (estimated based on OTA inventory). For long-term macro trends, we use official OCC from the Japan Tourism Agency’s “Overnight Travel Statistics Survey.”
- RevPAR: ADR x OCC (revenue per available room).
- Data Sources: MetroEngines Research & Consulting, monthly operating performance IR of REITs, Japan Tourism Agency, e-Stat, Ministry of Land, Infrastructure, Transport and Tourism (MLIT)
Location Analysis — The Heart of Osaka Minami, Uniquely Paired with a 12,500-Seat Arena
The target site is in 1-chome Shikitsu-higashi, Naniwa-ku, Osaka, within walking distance of Namba Parks and Takashimaya Osaka, and 6-8 minutes on foot from Namba Station, where the Nankai, JR, and subway lines intersect — the core of Minami. The daily ridership at Osaka Metro Midosuji Line’s Namba Station is approximately 360,000 (second only to Umeda), Nankai Namba Station handles approximately 200,000, and JR Namba Station handles approximately 33,000, making Minami one of the largest transit hubs in the Kansai region.
The 12,500-seat arena at the core of the plan ranks among the largest in Osaka Prefecture, second only to Osaka-jo Hall (approximately 16,000), and will function as a device for capturing live tourism demand. On arena event days, structures emerge where thousands to over 10,000 distant visitors stay at surrounding hotels, and hotels must incorporate the leverage of “arena utilization x lodging rate” into their design.
The site is designated as a commercial district, with floor-area ratio generally 600% (some surrounding areas 700%). In total floor space equivalent, approximately 140,000m of building capacity is available, presumably allocated across the arena, commercial, and hotel uses in a mixed-use design.
| Location | 1-chome Shikitsu-higashi, Naniwa-ku, Osaka |
| Coordinates | 34.6584, 135.5014 |
| Site Area | Approx. 24,000m |
| Zoning | Commercial District |
| Floor-Area Ratio | 600% |
| Opening Schedule | 2032 or later |
| Preferred Negotiator | Mitsui Fudosan, Kanden Realty |
The official 2025 commercial land price for Naniwa-ku overall averages approximately ¥789,000/m. The Namba area has sustained double-digit YoY appreciation over the past five years. A simple valuation based on the approximately 24,000m site is estimated at around ¥19 billion.
Area Competitive Structure — 251 Properties / 20,699 Rooms within 1.5km, Supply Skewed to Budget Tier
Within a 1.5km radius from the Kubota site (covering Namba, Shinsaibashi, Nipponbashi, and Ebisucho), there is a supply of 251 properties / 20,699 rooms. Broken down by grade, the budget tier (capsule and under ¥15,000/night) accounts for 145 properties / 11,496 rooms (56% of total), while the luxury tier is limited to 5 properties / 839 rooms including Swissotel Nankai Osaka, Fairfield by Marriott Osaka Namba, and Namba Oriental Hotel. The upper-midscale tier (4-star equivalent) is thin at 10 properties / 1,891 rooms, including Sotetsu Grand Fresa, Candeo, and Citadines.
By category, business hotels make up the majority at 118 properties / 12,712 rooms, while city hotels number only 6 properties / 1,554 rooms. The area is extremely densely packed with the “business / low-price mass production” model, while the city/upper-midscale tier with the banquet and large hall capacity needed for large-scale events is structurally undersupplied. This represents an important white space for absorbing MICE and live tourism demand after the new arena opens.
The chart above plots the ADR x room count of 242 properties within a 2km radius of the Kubota site. In the ADR ¥30,000-50,000 x 400+ room zone, only two properties exist — Candeo Hotels (496 rooms / ¥46,400) and Citadines (313 rooms / ¥49,100) — confirming a large supply gap. The 600-room, ADR ¥38,000 position assumed in Scenario B sits at the center of this white space, allowing differentiation versus the closest competitor (Candeo) of +100 rooms and approximately ¥8,000 lower ADR. Meanwhile, the ADR-under-¥15,000 x 200-700 room zone is densely populated with APA Hotel, Toyoko Inn, and others — visually demonstrating that large-scale entry at midscale (Scenario A) carries high price-competition risk.
Top Area Competitors (Sales-Observed ADR, Recent 6 Months)
| Hotel | Rooms | Grade | ADR (¥) | Distance (m) |
|---|---|---|---|---|
| Swissotel Nankai Osaka | 546 | Luxury | 55,400 | 640 |
| Candeo Hotels Osaka Namba | 496 | Upper-Mid | 45,000 | 1,420 |
| Hotel Monterey Grasmere Osaka | 348 | Mid | 40,700 | 1,040 |
| Osaka Itsuno-irodori Hotel | 354 | Budget | 29,900 | 510 |
| Citadines Namba Osaka | 313 | Upper-Mid | 27,500 | N/A |
| Sotetsu Grand Fresa Osaka Namba | 698 | Upper-Mid | 21,700 | 1,200 |
| APA Hotel Namba-Eki Higashi | 380 | Mid | 18,200 | 720 |
| Sauna & Capsule AMZA | 590 | Budget | 14,800 | 940 |
Demand Environment — Osaka’s Lodging Demand Structurally Above Trend, ADR Posts YoY Gains Every Month
Osaka’s overall ADR, per MetroEngines Research (public-price basis), stood at ¥26,000 in April 2026 with +4.5% YoY. Full-year 2025 also maintained gains in the +4% to +18% range, with double-digit increases especially during the Expo period (May-October 2025). Notably, after ADR briefly turned negative post-Expo (November-December 2025), demand re-accelerated entering 2026, indicating that underlying demand remains strong even after the Expo special-demand effect dissipated. We analyzed the ADR uplift effect during the Expo period and the post-Expo demand structure from both REIT and OTA angles in Osaka Expo’s Impact on Hotel ADR: REIT & OTA Data Analysis.
According to the latest values from the Japan Tourism Agency’s Overnight Travel Statistics (full-year 2025), Osaka Prefecture’s occupancy rate of 78.8% ranks first nationally. By facility type, business hotels maintain 83.0% and city hotels 79.4%, both at high levels. Furthermore, the 2024 inbound visitors to Osaka reached 14.64 million (+47% YoY, +19% vs. pre-COVID) — a record high — and total overnight stays by foreign visitors hit 25.39 million (+35%). The prefecture has set a 2025 target of 16 million, suggesting a much larger demand scale at the 2032 opening.
REIT Performance Cross-Check — Real Operating Metrics from Properties in the Area
Since OTA public prices tend to exceed actual booked prices, investment decisions should also reference actual operating data. Looking at investment trust disclosures from properties near the target area, Japan Hotel REIT Investment Corporation (8985) discloses the following recent performance for the “Osaka” area: ADR ¥25,000 / OCC 90.4% / RevPAR ¥22,500. Within the same REIT portfolio, this exceeds Tokyo (¥13,500), Kanto (¥19,900), and Kyushu (¥21,700), and even surpasses Hokkaido and Okinawa resorts — a top-tier booked ADR level.
This indicates that in Osaka city centers like Namba and Umeda, the supply-demand balance allows city/upper-midscale hotels to operate stably with OCC over 90% and ADR around ¥25,000, providing a highly valuable reference for the revenue assumptions in this project’s hotel business plan.
Investment Scenario Modeling — Revenue and Yield Across 3 Patterns
Here we model three positioning scenarios for the hotel portion of the development plan. We assume 30,000-35,000m of floor area allocated to hotel use (20-25% of the entire mixed-use development). Room sizes, construction cost per tsubo, and GOP margin assumptions follow industry benchmarks (detailed below).
A. Midscale (800 rooms)
Room-focused business + light leisure. 22m standard room. ADR ¥22,000 / OCC 82%. Construction cost ¥2.4M/tsubo (2025 actuals base), GOP margin 40%. Higher yield but weak synergy with arena.
B. Upper-Mid / 4-Star (600 rooms) Recommended
4-star lifestyle hotel capturing arena and MICE demand. 32m standard room + full banquet and F&B. ADR ¥38,000 / OCC 83%. Construction cost ¥2.45M/tsubo (2025 actuals base), GOP margin 32%. Best overall balance.
C. Luxury / 5-Star (320 rooms)
5-star with foreign brand. 50m larger rooms + dedicated floor and spa. ADR ¥75,000 / OCC 72%. Construction cost ¥3.3M/tsubo (2025 actuals base), GOP margin 25%. Maximum differentiation but long payback.
| Item | A. Midscale | B. Upper-Mid Recommended | C. Luxury |
|---|---|---|---|
| Rooms | 800 | 600 | 320 |
| Avg. Room Size | 22m | 32m | 50m |
| Assumed ADR | ¥22,000 | ¥38,000 | ¥75,000 |
| Assumed OCC | 82% | 83% | 72% |
| RevPAR | ¥18,040 | ¥31,540 | ¥54,000 |
| Annual Room Revenue | ¥5.27B | ¥6.91B | ¥6.31B |
| Annual Total Revenue (incl. F&B) | ¥6.32B | ¥9.32B | ¥9.46B |
| GOP Margin | 40% | 32% | 25% |
| Annual GOP | ¥2.53B | ¥2.98B | ¥2.37B |
| Construction Cost (per tsubo) | ¥2.4M | ¥2.45M | ¥3.3M |
| Total Construction Cost | ¥19.7B | ¥23.7B | ¥29.0B |
| Land Allocation | ¥5.0B | ¥5.8B | ¥5.0B |
| Total Investment | ¥24.7B | ¥29.5B | ¥34.0B |
| Gross Yield (GOP/Investment) | 10.3% | 10.1% | 6.9% |
| Payback (Simple GOP Recovery) | 9.8 yrs | 9.9 yrs | 14.4 yrs |
| With Construction-Period Inflation (2028-2031 build, +5%/year assumption) | |||
| Construction Cost (per tsubo, post-inflation) | ¥3.0M | ¥3.05M | ¥4.1M |
| Total Investment (post-inflation) | ¥29.6B | ¥35.3B | ¥41.1B |
| Yield (post-inflation) | 8.6% | 8.4% | 5.8% |
| Payback (post-inflation) | 11.7 yrs | 11.8 yrs | 17.4 yrs |
Basis for Construction Cost and GOP Margin Assumptions
Construction cost per tsubo references the MLIT “Construction Statistics” latest 2025 actuals. The statistics show construction cost for hotel use (S-structure) at ¥2.405M/tsubo (up +46% from previous year’s ¥1.648M) and RC-structure at ¥2.026M/tsubo (up +17% from previous year’s ¥1.736M), both reaching record highs. Continued steep growth from the 2022 all-structure average of ¥1.38M (+41% over 3 years) is evident. This analysis adopts 2025 actuals as base, applying ¥2.4M for midscale (S-structure-dominant), ¥2.45M for upper-midscale (RC-structure-dominant, Osaka premium), and ¥3.3M for luxury (SRC high-spec). Furthermore, we also include a scenario that factors in construction-cost inflation over the 2028-2031 build period through the 2032 opening. Based on the Turner & Townsend forecast (2025 +5.6%, 2026 +5.3%, 2027 +5.0%) and the Construction Research Institute’s construction price index (RC YoY +5.5%, S +3.4% as of March 2026), we assume +5% annual inflation and estimate the mid-construction (2029-2030) tsubo unit price. Post-inflation, midscale becomes ¥3.0M, upper-mid ¥3.05M, and luxury ¥4.1M; yield drops 1.5-2 points from the 2025 base. As for GOP margin, Invincible Investment Corporation discloses 38.9% across 91 MHM-operated properties (Dec 2024), and per JLL, many operators expect GOP increases through 2025-2026. As a conservative first-year value for new openings, we use 40% for midscale (room-focused), 32% for upper-mid, and 25% for luxury.
Recommended Scenario B — Strategic Justification for Upper-Mid / 4-Star / 600-Room
Comparing the three scenarios, gross yield is highest in A (10.3%), but because Minami already has 118 properties / 12,712 rooms of densely packed business hotels, maintaining the OCC assumption with new large-scale supply is difficult, with significant sensitivity risk. Meanwhile, C (luxury) achieves standalone profitability but with a payback over 14 years and long lead times for brand selection and operator-contract negotiation. We covered similar themes regarding the impact and investment economics of new luxury supply in major metropolitan areas in Nagoya Hotel Investment 2026: Conrad Opening, Luxury Gap & Linear Delay Reshape Strategy.
Scenario B (upper-mid / 4-star / 600 rooms) is recommended for four reasons. First, on arena event days with 12,500 capacity, substantial visitors from regional Japan and overseas arrive, and the “mid-price x high room quality x full F&B” segment grows the most. Second, the area’s current upper-midscale supply at 10 properties / 1,891 rooms is thin, leaving substantial room for new entry (we examined the Kansai-wide supply-demand gap structure by cross-referencing DBJ estimates with OTA actuals in Kansai Luxury Hotel Supply-Demand Turning Point: 2026 Outlook from DBJ & OTA Data). Third, as Japan Hotel REIT’s Osaka property performance (OCC 90.4% / ADR ¥25,000) demonstrates, the central Osaka market sustains extremely high and stable OCC and ADR in this tier. Fourth, with F&B and banquet co-location, non-room revenue adds 35% (in case B, total revenue is 1.35x room revenue), reducing single-stream dependency risk.
Sensitivity Analysis — Yield Resilience under ADR / OCC / Construction Cost Variations
Taking recommended Scenario B (600 rooms / ¥38,000 / OCC 83%) as the base case, we show yield changes when ADR and OCC vary.
| Case | ADR | OCC | Construction Cost | Total Investment | Annual GOP | Yield |
|---|---|---|---|---|---|---|
| Base (2025 Actuals) | ¥38,000 | 83% | ¥2.45M/tsubo | ¥29.5B | ¥2.98B | 10.1% |
| ADR -10% | ¥34,200 | 83% | ¥2.45M/tsubo | ¥29.5B | ¥2.69B | 9.1% |
| OCC -5pt | ¥38,000 | 78% | ¥2.45M/tsubo | ¥29.5B | ¥2.80B | 9.5% |
| Both Downside | ¥34,200 | 78% | ¥2.45M/tsubo | ¥29.5B | ¥2.52B | 8.6% |
| ADR +10% / OCC +2pt | ¥41,800 | 85% | ¥2.45M/tsubo | ¥29.5B | ¥3.36B | 11.4% |
| With Inflation (Base) | ¥38,000 | 83% | ¥3.05M/tsubo | ¥35.3B | ¥2.98B | 8.4% |
| Inflation + Both Downside | ¥34,200 | 78% | ¥3.05M/tsubo | ¥35.3B | ¥2.52B | 7.1% |
| Inflation + Upside | ¥41,800 | 85% | ¥3.05M/tsubo | ¥35.3B | ¥3.36B | 9.5% |
Under the 2025 actuals base, even the downside scenario (ADR -10% / OCC -5pt) maintains 8.6% yield. However, factoring in construction-period inflation (+5%/year), yield drops to 8.4% in the base case and to 7.1% in the full-downside case. Even under the post-inflation scenarios, the upside case (ADR +10% / OCC +2pt) secures 9.5%, and the structure where baseline demand uplift from arena utilization and Osaka’s structural demand (national-leading OCC, record-high inbound) supports the downside remains intact. Note that rising construction costs also tend to suppress new supply, easing price competition with existing properties — a point to be noted as an upside factor.
Risk Factors — Four Points to Consider at 2032 Opening
| Category | Risk Description | Mitigation |
|---|---|---|
| Demand | Medium- to long-term trend changes in inbound and domestic demand (FX, geopolitics, pandemic, etc.) | Multi-revenue with F&B/MICE/banquet co-location; secure ADR flexibility |
| Supply | ADR compression from new supply expansion in Osaka 2026-2032 (multiple large developments in progress) | Price defense via the rare arena-adjacent positioning; brand-contract credibility |
| Construction Cost | Construction costs +41% from 2022 to 2024; further upside potential at 2032 opening | EPC fixed-price contracts; specification adjustment in design phase |
| Regulation | Osaka accommodation tax hike, new tax introductions, inbound policy shifts | Pass-through design in pricing; rate-lock terms for long-term reservations |
Note on Assumptions: The revenue estimates in this article are simplified feasibility analyses based on publicly available data as of 2026 (OTA sales prices, REIT monthly operating performance IR, JTA overnight statistics, MLIT construction statistics) and industry benchmarks. At the 2032 or later opening, macro conditions, construction costs, and competitive supply may have significantly changed, and actual investment decisions require more detailed due diligence, market testing, and scrutiny of operator-contract terms.
Summary — Arena Co-Location Could Rewrite the Playbook for Urban Hotels
The Kubota HQ site is a mixed-use development pairing Osaka Minami’s prime location with a unique 12,500-seat arena demand-generation device. While 251 properties / 20,699 rooms of supply exists within a 1.5km radius, the majority is budget-tier business hotels, and the upper-midscale (4-star class) tier — needed to capture arena-day live tourism and MICE demand — is structurally thin. Given Osaka’s demand environment (national-leading OCC, record-high inbound visitors) and the JHR Osaka portfolio’s ADR ¥25,000 / OCC 90.4% performance, a 4-star, 600-room hotel investment at this location offers a 10.1% gross yield and sub-10-year payback on the 2025 construction-cost base. Factoring construction-period inflation (+5%/year), yield drops to 8.4% with payback at ~12 years. Even under downside stress (ADR -10% / OCC -5pt), yields remain at 8.6% (2025 base) and 7.1% (post-inflation) — both maintaining investment-grade resilience.
Six-plus years of preparation remain until the 2032 opening. During this period, Osaka and Kansai supply-demand will pass through major shifts including new supply, Expo legacy, and IR effects, making periodic market monitoring and scenario updates critical for investment decision precision. We hope this analysis serves as a useful starting point for industry discussion.
Related Reading
- Osaka Expo’s Impact on Hotel ADR: REIT & OTA Data Analysis
- Kansai Luxury Hotel Supply-Demand Turning Point: 2026 Outlook from DBJ & OTA Data
- Nagoya Hotel Investment 2026: Conrad Opening, Luxury Gap & Linear Delay Reshape Strategy
- GIC’s Japan Hotel Strategy: ¥150B Prince 31-Property Acquisition Decoded
- Nankai Trough 80% Era: Pacific Coast Hotel Investment — Disaster Risk x ADR x Risk-Adjusted Yield
- Six Luxury Hotels Opening in Japan in 2026: Investor Market Impact Analysis
- Face Recognition Check-In: Survival Strategy for Mid-Size Business Hotels (80 vs 150 Room GOP Simulation)
- Osaka-Kansai Expo Visitors Drove Wide-Area Tourism Despite Lodging Demand Decline
- Weekday ADR in Tokyo, Nagoya, Osaka & Fukuoka: Business Demand Recovery 2026
- Are Japan Hotels Still Underpriced? Tokyo $245, Kyoto $305 ADR vs NY, Paris, London
References & Sources
Market Data
- MetroEngines Research & Consulting — OTA public-price data (Osaka N=860 properties, 1.5km radius N=251 properties), monthly ADR trends, estimated OCC and supply-demand data
Government Statistics & Public Data
- Japan Tourism Agency “Overnight Travel Statistics Survey” (Full-year 2025 preliminary, Osaka OCC 78.8% No.1 nationally)
- Japan Tourism Agency “Overnight Travel Statistics 2025 Annual Values (preliminary)” PDF
- Osaka City “Land Price Survey & Official Land Price”
- e-Stat “Consumer Price Index (Accommodation)” (Statistics ID: 0003427113)
- MLIT “Construction Statistics” (hotel use, construction cost per tsubo)
REIT & Industry Reports
- Japan Hotel REIT Investment Corporation (8985) monthly operating performance (March 2026, portfolio average OCC 85.1% / ADR ¥20,827)
- Hoshino Resorts REIT Investment Corporation (3287) monthly operating performance (March 2026)
- Invincible Investment Corporation (8963) monthly operating performance (March 2026, MHM-operated 91 properties GOP 38.9%)
News & Press Releases
- “Kubota HQ Site Redevelopment by Mitsui Fudosan and Kanden Realty — Large Arena, Hotel, etc.” Sankei Shimbun, May 11, 2026
- “12,500-Capacity Arena in Osaka Minami: Mitsui Fudosan to Develop Kubota HQ Site” Nikkei, May 2026
- Kubota “Relocation of HQ to Umekita Phase 2 / Grand Green Osaka” May 22, 2024
- “Kubota HQ Site ‘(Tentative) Namba Arena’ Concept” Re-urbanization
- “Osaka Inbound Visitors 14.64M in 2024 — Record High” Nikkei
- Turner & Townsend “Trends shaping Japan’s construction market in 2026” (construction-cost inflation forecast: 2025 +5.6%, 2026 +5.3%, 2027 +5.0%)
- archi-book “Hotel Construction Cost per Tsubo Levels [2025 Edition]” (Construction Statistics 2025 actuals: S-structure ¥2.405M/tsubo, RC-structure ¥2.026M/tsubo)
- Construction Research Institute “Construction Price Index” March 2026 (RC YoY +5.5%, S +3.4%)