

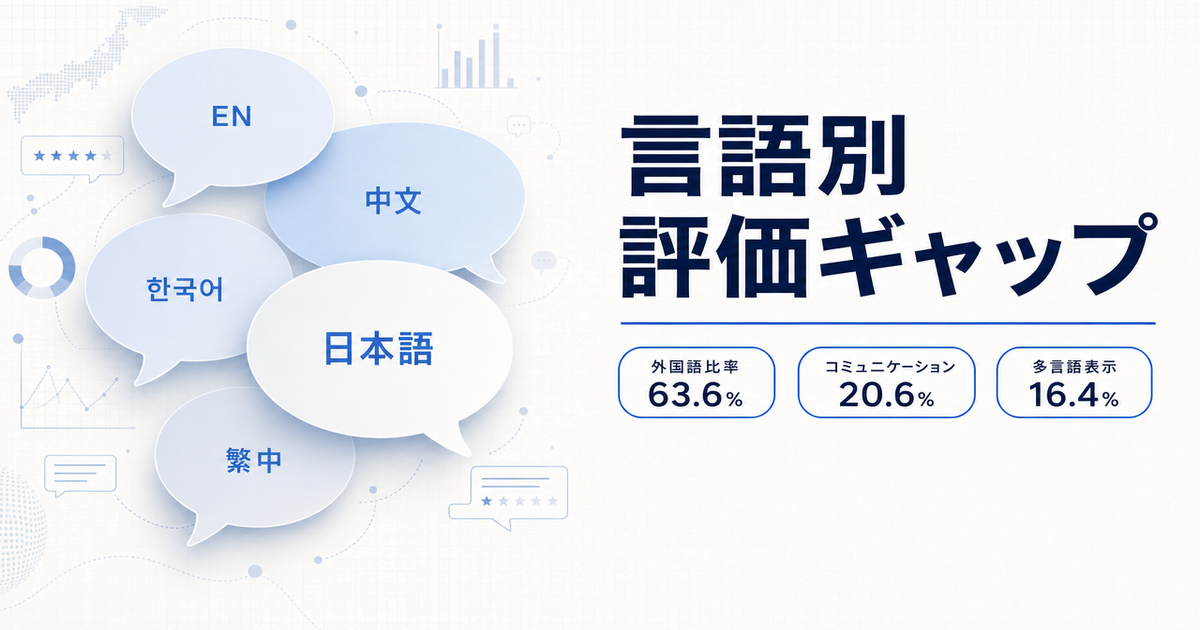
According to Honichi Lab‘s April 2026 report “Top 10 Hotels & Ryokan in Tokyo Most Popular Among Foreigners,” 16,293 of the 25,607 reviews aggregated across 200 Tokyo properties (63.6%) were posted in foreign languages. As inbound demand continues to reshape the market structure, the dominant language of bookings, stays, and reviews at popular Tokyo hotels has shifted from Japanese to English, Chinese, and Korean. In this article, the HotelBank Editorial Team analyzes approximately 276,000 reviews collected from 40 popular hotels in Tokyo’s 23 wards (each with 500+ reviews), broken down by language, to quantify the differences in evaluation criteria between Japanese and inbound guests and identify segments with the highest improvement priority.
Metric Definitions Used in This Article
- Analysis Scope: 40 popular hotels in Tokyo’s 23 wards with 500+ reviews each (currently operating, with grade classification)
- Review Volume: Approximately 276,000 reviews posted between January 2023 and April 2026, written in 28 different languages
- Language Score: Average rating on a 5-point scale, aggregated from publicly available OTA review data
- Category Score: Average of category-specific ratings assigned by reviewers (cleanliness, service, location, room, etc.)
- Data Source: HotelBank Editorial Team research. Individual review text and reviewer attributes are not cited anywhere in this article
What 63.6% Foreign-Language Reviews Tells Us
According to the latest survey published by Honichi Lab (August 2025 to April 2026), of 25,607 reviews collected across 200 hotels and ryokan in Tokyo, 16,293 (63.6%) were posted in foreign languages. “MIMARU TOKYO Kinshicho,” ranked No. 1 in inbound popularity in the same survey, received 581 foreign-language reviews over a roughly seven-month period. We have entered an era in which it is no longer unusual for popular hotels to have a Japanese-guest share in the low 30% range, and at many properties the core customer base has shifted toward foreign visitors. The rise in foreign guest share is particularly pronounced in Tokyo, and we have analyzed its structural background in detail in Tokyo’s Foreign Guest Ratio Now Exceeds 50%: A Tectonic Shift Diluting Domestic Demand.
Meanwhile, the Japan Tourism Agency’s FY2025 “Survey on the Reception Environment for Inbound Travelers” (survey period: November 18, 2025 to January 13, 2026; 4,110 valid responses) continues to identify “communication with facility staff” (20.6%) and “lack or unclarity of multilingual signage” (16.4%; 10.9% in the latest published figure) among the top inconveniences faced during a visit to Japan. Insufficient multilingual support remains a major friction point in the inbound experience, and that friction is directly reflected in hotel reviews.
This article therefore decomposes approximately 276,000 reviews from 40 popular hotels in Tokyo’s 23 wards by language, hotel grade, and category to quantify exactly where the gap in evaluation criteria emerges.
Review Mix by Language Across 40 Popular Tokyo Hotels
Breaking down the roughly 276,000 reviews from the 40 target hotels by posting language, the composition is: English 46.0%, Japanese 34.7%, Chinese 9.8%, Korean 2.3%, and other foreign languages 7.2%. English and Japanese together account for over 80% of the total, but voices in Chinese, Korean, Spanish, German, French, and other languages aggregate to a volume too significant to ignore.
Source: HotelBank Editorial Team research (40 hotels in Tokyo’s 23 wards, January 2023 to April 2026, N=275,853)
What stands out is that English has overtaken Japanese to become the single largest language segment. In addition to inbound visitors from English-speaking countries (US, UK, Australia), many travelers from Southeast Asia and various European countries also post reviews in English, so English functions less as “the voice of English speakers” and more as “the de facto common language of non-Japanese speakers.” This means that a decline in English-language scores likely reflects not only the dissatisfaction of North American guests, but the perceived quality experienced by a multinational inbound population as a whole.
Overall Score Comparison by Grade and Language
Classifying the 40 properties by hotel grade (Luxury, High Grade, Upper, Economy, Budget) and comparing overall scores by language reveals a clear pattern: in the mid- to upper-grade tiers, foreign-language users rate hotels more favorably than Japanese-language users, but in the Economy and Budget tiers this pattern reverses or disappears.
Source: HotelBank Editorial Team research (40 hotels in Tokyo’s 23 wards, N=275,853)
In the Luxury tier, Korean 4.48, English 4.39, Chinese 4.35, and Japanese 4.20 — every foreign language exceeds the Japanese-language score. Japanese-language users tend to be tougher critics because they bring familiar service standards as their “expectation baseline,” while overseas guests assign high scores reflecting the gap between their expectations and reality (“more attentive than I imagined,” “the level of fine detail surprised me”). In the Economy tier (Korean 3.90, English 3.95, Chinese 4.02, Japanese 4.00), differences between languages narrow, and English and Korean scores are actually below Japanese. The lower the price point, the more directly “physical specifications” — room size, soundproofing, climate control — drive the rating, and the influence of cultural expectations fades. For the evaluation criteria specific to the Luxury tier, our analysis from the angle of dining at Hotel Dining Review Ranking for Special Occasions is also a useful reference.
| Grade | Japanese | English | Chinese | Korean | English − Japanese |
|---|---|---|---|---|---|
| Luxury | 4.20 | 4.39 | 4.35 | 4.48 | +0.19 |
| High Grade | 4.24 | 4.33 | 4.32 | 4.41 | +0.09 |
| Upper | 4.08 | 4.23 | 4.28 | 4.27 | +0.15 |
| Economy | 4.00 | 3.95 | 4.02 | 3.90 | −0.05 |
| Budget | 4.04 | 4.14 | 4.24 | 4.26 | +0.10 |
The key takeaway is that for Economy-tier hotels, “winning the support of foreign-language users” is by no means automatic. Price-driven properties are in fact judged more strictly than they would be by Japanese guests on multilingual support, physical room comfort, and basic English communication from staff.
Category Gaps: How “Service” and “Cleanliness” Reveal Different Evaluation Criteria
Aggregating category-specific scores attached to reviews (cleanliness, service, location, etc.), language gaps emerge most prominently in the two main categories that are commonly comparable across languages: “Service” and “Cleanliness.” These are the areas where Japanese-language users rate substantially more strictly than other languages.
Source: HotelBank Editorial Team research (category score aggregation, N=140,272)
In the “Service” category, English 4.63, other foreign languages 4.55, Korean 4.53, and Chinese 4.43 stand against a notably low Japanese score of 4.20. The gap with English-language users alone is a full 0.43 points — a very large divergence on a 5-point scale. Japanese guests tend to take “anticipatory service” and “consideration beyond the manual” for granted and are not satisfied with by-the-book hospitality. Foreign-language users, on the other hand, give high marks for “visible basic actions” — politeness, efficiency, clean uniforms, and consistent greetings.
The “Cleanliness” category shows the same pattern: English 4.63, other foreign languages 4.53, Korean 4.46, Chinese 4.32, and Japanese the lowest at 4.25. By global standards, Japanese hotels’ cleanliness is among the best in the world, but Japanese guests do not overlook fine details such as bathroom water stains, dust in air conditioners, or wrinkled sheets. Inbound guests arrive with a strong baseline expectation of “clean Japanese hotels” and tend to give higher scores when comparing to Western hotel norms.
Note: Category structures themselves vary by OTA and language — Japanese-language reviews tend to be aggregated on more granular items such as “room,” “breakfast,” “location,” and “bathroom,” while English, Chinese, and Korean reviews are typically aggregated on broader umbrella categories such as “service,” “cleanliness,” and “comfort.” This reflects different review design philosophies between domestic and international OTAs. This article therefore focuses on “Service” and “Cleanliness” as the two categories that are commonly comparable across both groups.
Property-Level Gaps: How the Same Hotel Can Look So Different by Language
Comparing language-level overall scores across 12 major properties (mostly Luxury and High Grade), it becomes clear that each hotel has its own distinctive “language-based support structure.” Several characteristic cases stand out.
Source: HotelBank Editorial Team research (language-by-language scores for 12 major properties, each cell N≧30)
For example, at Hyatt Regency Tokyo (ハイアット リージェンシー 東京), Japanese sits at 4.40 versus English 4.12 — a reversal in which Japanese exceeds English by 0.28 points. While appreciated by Japanese family and business segments, the property receives relatively tougher reviews from English-speaking users who hold high expectations of a global brand. Hilton Tokyo (ヒルトン東京) shows a similar 0.39-point gap (Japanese 4.34 vs Chinese 3.95), with Chinese-language users rating more strictly than other languages.
The opposite pattern appears at Conrad Tokyo (コンラッド東京), where English 4.73, Korean 4.65, and Japanese 4.46 show foreign-language users scoring well above Japanese. Hotel Metropolitan Edmont (ホテルメトロポリタン エドモント) follows the same shape with English 4.62, Korean 4.60, Chinese 4.50, and Japanese 4.40 — overwhelming support from foreign-language users. By contrast, Hotel Chinzanso Tokyo (ホテル椿山荘東京) posts uniformly high 4.5–4.8 scores across all languages as an “all-direction” type, while Imperial Hotel Tokyo (帝国ホテル東京) leans the other way as a “Japanese fan-base” type, with Japanese-language scores above foreign languages.
In short, very few properties can simply be labeled “popular with inbound guests” — each hotel carries a distinct evaluation structure across language segments. This suggests that the first step in setting review-improvement priorities is to visualize one’s own language-by-language score distribution.
Improvement Priority Matrix: Where to Start
Mapping the language × grade combinations along two axes — “Japanese minus foreign-language score” and “review volume” — surfaces the segments with the highest improvement priority.
Source: HotelBank Editorial Team research (priority mapping for 15 language × grade cells)
The lower-right quadrant (high foreign-language volume, scores below Japanese) contains the segments “Economy × English” and “Economy × Korean.” Despite Economy being one of the largest foreign-language volume tiers among the 40 target hotels, its English score (3.95) and Korean score (3.90) fall below the Japanese baseline (4.00). For price-driven properties in particular, improvements to “visible functionality” — bed comfort, climate-control performance, Wi-Fi speed, front-desk English — translate directly into higher review scores. For supply trends in the Economy tier, our piece In-depth Analysis of Tokyo’s 23 Wards Business Hotels organizes the area-by-area market structure.
The upper-left quadrant (foreign-language scores well above Japanese; low improvement priority but a branding opportunity) is occupied by “Luxury × Korean” and “High Grade × Korean.” The consistent pattern of Korean-language users being more satisfied than other languages can be converted into an opportunity: stronger advertising and OTA exposure aimed at the Korean market, plus richer Korean-language content to drive repeat visitation.
| Priority | Segment | Recommended Actions |
|---|---|---|
| High | Economy × English / Korean | Front-desk English training, room-functionality checklists, automatic translation tools |
| High | Upper × English | Better English-language in-room guides and breakfast menu explanations; English-version concierge functions |
| Medium | Upper × Chinese | Distinguishing Traditional/Simplified Chinese, support for Chinese payment methods, Chinese-language guides for popular areas |
| Medium | Luxury × Japanese | Move beyond “scripted” service to per-guest personalization (guest history, anticipating preferences) |
| Low | Luxury / High Grade × Korean | OTA exposure for the Korean market, social-media advertising, and richer Korean-language content to drive repeat visits |
Language-Based Training to Prioritize During the Late-May to June Rainy-Season Lull
From late May through the end of the rainy season, Tokyo enters a tourism off-peak window in which many properties experience temporary occupancy slack. This period is an excellent opportunity for staff training ahead of the next full peak. The priority training themes that emerge from this language-gap analysis are as follows.
| Training Theme | Audience | Expected Effect |
|---|---|---|
| Basic English conversation + complaint-handling English | All front-desk and reservations staff | Lift English scores in Economy through Upper tiers |
| 10 essential Chinese / Korean greetings and in-house guidance phrases | Front-desk and housekeeping | Improve “feeling welcomed” for Chinese- and Korean-language users |
| Physical room-quality checks (soundproofing, HVAC, Wi-Fi, bedding) | Housekeeping and facility management | Address the “functionality” axis where foreign-language users rate strictly |
| Multilingual signage and guidance audit | Operations managers | Respond to the 16.4% citing “lack or unclarity of multilingual signage” |
| “Personalization” training for Japanese guests | Luxury-tier concierges | Address the room for improvement on Japanese “Service” scores (4.20) |
Conclusion: Operating on the Premise that Evaluation Criteria Differ by Language
What emerges from analyzing 276,000 reviews across 40 hotels in Tokyo’s 23 wards is the structural fact that “Japanese guests and inbound guests evaluate the same hotel by different standards.” In the mid- to upper-grade tiers, foreign-language users post higher overall scores than Japanese-language users; in the Economy tier this advantage disappears, and properties are rated strictly on functionality. By category, Japanese trails other languages by 0.4 points on “Service” and “Cleanliness,” reflecting the high expectations of Japanese guests.
At the same time, property-level dispersion is wide. Some properties — like Hyatt and Hilton — receive relatively strict reviews from foreign-language users; others — like Conrad and Edmont — enjoy overwhelming support from the same segment; some, like Chinzanso, score uniformly high across all languages; and others, like Imperial Hotel Tokyo, are sustained by a Japanese fan base. Positioning varies. Visualizing one’s own language-by-language scores and identifying the segments with the highest improvement priority is the starting point for allocating limited training and renovation budgets effectively.
The reality of 63.6% foreign-language reviews signals that the industry has moved beyond the “just translate” stage and into the “operate to different standards by language” stage. The late-May to June rainy-season lull is a prime window to invest in staff training and physical room-quality improvements that respond to this structural shift.
About the Data in This Article: The analysis covers 40 popular hotels in Tokyo’s 23 wards with 500+ reviews each, currently operating and grade-classified. The aggregation period is January 2023 to April 2026. Reviewer attributes and individual review text are not cited anywhere in the article. The review data are secondary aggregates of publicly available reviews, and reflect differences in review-design philosophy across properties and OTAs (category granularity, score scales) — they should be read as reference values that incorporate those differences.
Related Articles
- Hotel Dining Review Ranking for Special Occasions: Luxury Hotels in Tokyo, Osaka, and Nagoya (2026)
- [March 2026 Update] In-depth Analysis of Tokyo’s 23 Wards Business Hotels: Diversifying Supply by Area and the Supply-Demand Balance Supporting the Urban Lodging Market
- Deep Dive into JTA’s January 2026 Flash Report: Tokyo’s Foreign Guest Ratio Now Exceeds 50% — A Tectonic Shift Diluting Domestic Demand
- Mitsui Fudosan Hotel Management Rolls Out Online Medical Service for Inbound Guests Across 39 Properties Nationwide: 24-Hour, 256-Language Support
- Resorttrust Earns “Welfare Promotion Corporation” Certification for the Third Consecutive Year — Recognition for HR-Linked Initiatives
- JNTO Reports 3,597,500 Inbound Visitors to Japan in January 2026, Down 4.9% YoY but Korea Sets a Single-Month Record Above 1.1 Million
- The Long-Stay Hotel Market Comes of Age — Mitsubishi Estate’s WAYPOINT and Hilton Reshape Tokyo Lodging