

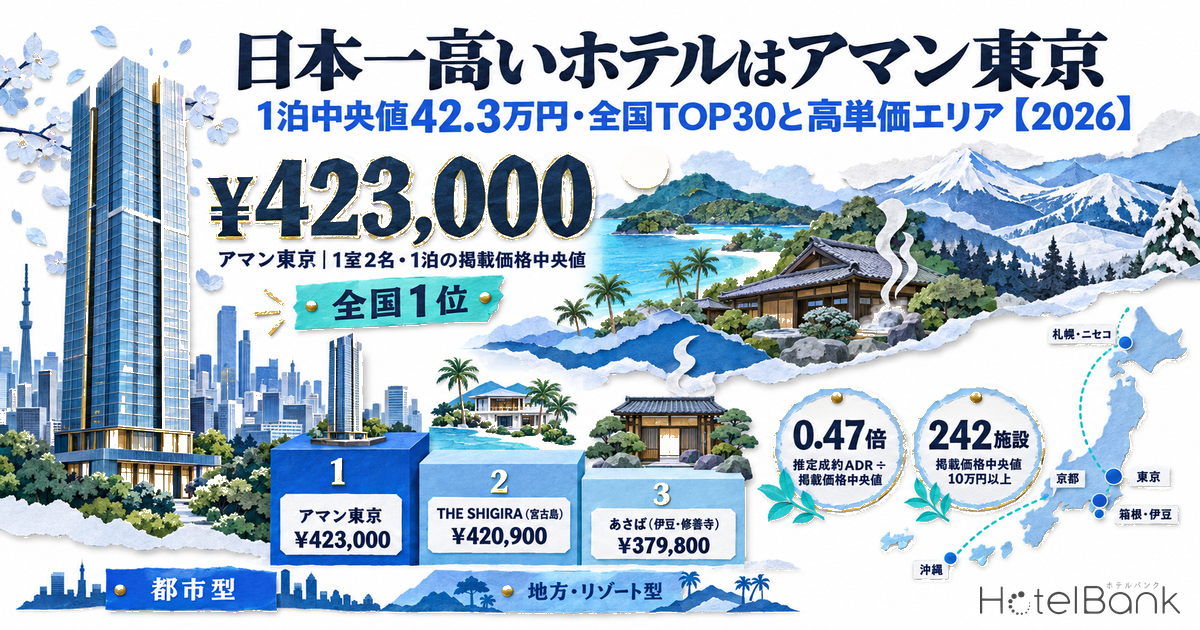
Within the coverage of MetroEngines Research, the most expensive hotel in Japan is Aman Tokyo (アマン東京; Chiyoda, Tokyo; listed from ¥280,700 per room per night for two guests). Aggregating every one-night, two-guest plan listed for stays from September 2025 to August 2026, property by property, Aman Tokyo’s median listed price was ¥423,000 — the highest in the country.
In second place is THE SHIGIRA on Miyakojima (median ¥420,900), just 0.5% behind the leader. Third is Asaba (あさば) in Shuzenji, Izu (median ¥379,800). Of the top 30 properties, only nine are urban hotels in Tokyo’s 23 wards or Kyoto City (six in Tokyo, three in Kyoto); the remaining 21 are ryokan and resorts in hot-spring towns, on remote islands and in highland areas. This article answers the question “which properties are the most expensive?” directly, keeping listed prices and estimated settled ADR strictly separate. If you are looking for the tallest hotel in Japan by building height, see the FAQ at the end of this article.
Metric Definitions Used in This Article
- Listed price: The selling price as published on OTAs and similar channels. Per-room, per-night rate for two guests sharing one room (tax included), covering every plan from room-only to meal-inclusive and from standard rooms to suites.
- Median listed price: The middle value of all one-night, two-guest listed prices observed for the property during the period (counted per stay date × room × plan). Used for ranking because it is less distorted by a handful of ultra-expensive suites.
- Median daily lowest price: The lowest listed price on each stay date, then the median of those values. It indicates the “entry level” at which a guest can stay at the property.
- Core range (P10–P90): Listed prices sorted from low to high, taking the values at the 10th and 90th percentiles. This is the commonly seen price band, excluding the extreme lows and highs.
- ADR (Average Daily Rate) / Estimated settled ADR: An estimated settled room rate (tax-excluded equivalent), calculated by applying a property-type-specific adjustment factor to the lowest plan level each property publishes on OTAs (per room for two guests, tax included). Cross-checked against property-level results disclosed by listed hotel REITs (91 properties, most recent three months), the median error is approximately 7%. These are estimates and differ from each property’s actual transaction prices and accounting figures. Estimates cover five property types — business, city, resort, ryokan and capsule; properties classified as deluxe hotels are shown with listed prices only. Area-level ADR is the median of target properties (the level of a typical property in the area).
- Data source: MetroEngines Research
Key Takeaways
— ¥423,000: Aman Tokyo’s median listed price per room per night for two guests (September 2025–August 2026). No. 1 nationwide, just 0.5% ahead of No. 2 THE SHIGIRA (¥420,900).
— 0.47x: Among the top-15 properties for which estimated settled ADR could be calculated, settled ADR was 0.36–0.65x the median listed price (median 0.47x). “Expensive on listings” and “expensive in actual rates” produce different rankings.
— 242 properties, 12,433 rooms: Properties with a median listed price of ¥100,000 or more. Regional and resort properties account for over 80% by property count, while urban properties in Tokyo’s 23 wards, Osaka City and Kyoto City hold 57.6% of the rooms.
— 15.5 rooms: The median total room count of the top 30 (vs. 39 rooms for the overall population). Their median guest review score is 4.73, above the population median of 4.06.
— Two seasonal patterns: All nine urban properties peak in March–May. Among resorts, 11 peak in summer, and only one — Zaborin in Kutchan — peaks in winter.
Japan’s Most Expensive Hotel Is Aman Tokyo — Top 30 by Median Listed Price
Our population consists of 12,673 properties across seven hotel and ryokan property types nationwide that had at least six months of listing observations between September 2025 and August 2026. For the 589 properties whose monthly average listed price was ¥80,000 or more, we aggregated every one-night, two-guest plan, and ranked the 588 properties that had at least 30 listings and at least 20 days of observed sales. Plans that require multi-night stays, and rooms for seven or more guests (private buildings and large villas), were excluded (see “Methodology and Sources” at the end).
No. 1 Aman Tokyo is an urban hotel with 84 rooms on floors 33–38 of Otemachi Tower. According to its official website, every room is suite-grade and even the smallest measures 71㎡. Over 12 months, its core listed range was ¥333,000–¥663,500, and even the median of its daily lowest plan reached ¥400,200. In other words, “even the cheapest room on the cheapest day costs around ¥400,000” — its entry price alone exceeds the median of other properties, which is what secured first place.
No. 2 THE SHIGIRA (Miyakojima, Okinawa) is a small resort with 10 rooms in our property database, with a median of ¥420,900. Its price swing is wide, topping out at ¥1,305,400, and its highest monthly median (about ¥509,000) came in August. No. 3 Asaba (Izu, Shizuoka) is a 17-room ryokan whose prices peak in May. The lower bound of the core range exceeds ¥200,000 at all three top properties, placing their price bands a full tier above the rest.
From No. 4 onward come urban luxury hotels: The Peninsula Tokyo, Four Seasons Hotel Kyoto, Park Hyatt Tokyo and The Ritz-Carlton, Kyoto. Park Hyatt Tokyo (opened July 1994, 171 rooms) reopened after renovation on December 9, 2025, and posted a median of ¥283,400 over nine months of observation since reopening. The seven urban hotels in the top 30 other than Aman Tokyo have 120–320 rooms and a deep range of plans. At six of the seven, the highest suite price exceeds ¥1,000,000, while the median daily lowest price stays within ¥100,000–¥180,000. They rank high because of the sheer breadth of their price bands.
Source: Compiled by HotelBank Editorial Team from MetroEngines Research data (listed price per room per night for two guests, September 2025–August 2026, top 20 properties. Bars = core range P10–P90, ◆ = median)
| Rank | Property | Location | Type | Rooms | Median listed price | Median daily lowest price | Core range (P10–P90) | Lowest–highest | Est. settled ADR | Months observed |
|---|---|---|---|---|---|---|---|---|---|---|
| 1 | Aman Tokyo (アマン東京) | Chiyoda, Tokyo | Deluxe | 84 | ¥423,000 | ¥400,200 | ¥333k–¥664k | ¥281k–¥919k | — | 11 mo |
| 2 | THE SHIGIRA | Miyakojima, Okinawa | Resort | 10 | ¥420,900 | ¥285,600 | ¥249k–¥629k | ¥203k–¥1,305k | ¥191,200 | 12 mo |
| 3 | Asaba (あさば ASABA) | Izu, Shizuoka | Ryokan | 17 | ¥379,800 | ¥297,800 | ¥218k–¥664k | ¥190k–¥1,189k | — | 11 mo |
| 4 | The Peninsula Tokyo (ザ・ペニンシュラ東京) | Chiyoda, Tokyo | Deluxe | 314 | ¥297,300 | ¥126,000 | ¥162k–¥624k | ¥80k–¥1,012k | — | 12 mo |
| 5 | Four Seasons Hotel Kyoto (フォーシーズンズホテル京都) | Higashiyama, Kyoto City | Deluxe | 123 | ¥296,000 | ¥177,300 | ¥156k–¥498k | ¥82k–¥2,409k | — | 12 mo |
| 6 | Park Hyatt Tokyo (パークハイアット 東京) | Shinjuku, Tokyo | Deluxe | 171 | ¥283,400 | ¥173,600 | ¥169k–¥616k | ¥114k–¥4,807k | — | 9 mo |
| 7 | Sanso Takefue (山荘 竹ふえ) | Minamioguni, Kumamoto | Ryokan | 12 | ¥272,000 | ¥253,000 | ¥234k–¥437k | ¥185k–¥981k | ¥156,100 | 11 mo |
| 8 | The Ritz-Carlton, Kyoto (ザ・リッツ・カールトン京都) | Nakagyo, Kyoto City | Deluxe | 134 | ¥265,600 | ¥173,800 | ¥176k–¥404k | ¥105k–¥794k | — | 12 mo |
| 9 | Oku-Yugawara Yui (奥湯河原 結唯) | Yugawara, Kanagawa | Ryokan | 7 | ¥261,500 | ¥186,200 | ¥178k–¥311k | ¥113k–¥470k | ¥112,800 | 12 mo |
| 10 | Asadaya (浅田屋) | Kanazawa, Ishikawa | Ryokan | 5 | ¥247,100 | ¥204,900 | ¥188k–¥371k | ¥133k–¥504k | ¥114,700 | 11 mo |
| 11 | The Ritz-Carlton, Tokyo (ザ・リッツ・カールトン東京) | Minato, Tokyo | Deluxe | 247 | ¥243,000 | ¥121,200 | ¥140k–¥488k | ¥90k–¥1,161k | — | 12 mo |
| 12 | Ochiairo (おちあいろう) | Izu, Shizuoka | Ryokan | 14 | ¥234,000 | ¥155,100 | ¥180k–¥302k | ¥118k–¥1,016k | ¥103,400 | 12 mo |
| 13 | Mandarin Oriental, Tokyo (マンダリンオリエンタル東京) | Chuo, Tokyo | Deluxe | 179 | ¥227,700 | ¥120,000 | ¥138k–¥548k | ¥87k–¥1,367k | — | 12 mo |
| 14 | Palace Hotel Tokyo (パレスホテル東京) | Chiyoda, Tokyo | Deluxe | 290 | ¥222,000 | ¥102,600 | ¥146k–¥573k | ¥76k–¥1,398k | — | 12 mo |
| 15 | The Uza Terrace Beach Club Villas (ジ・ウザテラス ビーチクラブヴィラズ) | Yomitan, Okinawa | Deluxe | 48 | ¥220,800 | ¥138,100 | ¥138k–¥328k | ¥113k–¥521k | — | 12 mo |
| 16 | Arima Sanso Goshobessho (有馬山叢 御所別墅) | Kita-ku, Kobe, Hyogo | Ryokan | 10 | ¥220,000 | ¥105,400 | ¥101k–¥350k | ¥58k–¥588k | ¥79,000 | 12 mo |
| 17 | THE HIRAMATSU HOTELS & RESORTS Kashikojima (THE HIRAMATSU HOTELS&RESORTS賢島) | Shima, Mie | Resort | 8 | ¥217,800 | ¥160,900 | ¥165k–¥340k | ¥97k–¥571k | ¥107,800 | 12 mo |
| 18 | ABBA RESORTS IZU – Zagyoso (ABBA RESORTS IZU-坐漁荘) | Ito, Shizuoka | Resort | 35 | ¥217,800 | ¥134,800 | ¥121k–¥379k | ¥106k–¥544k | ¥141,800 | 12 mo |
| 19 | Jinya Ryokan (陣屋旅館) | Hadano, Kanagawa | Ryokan | 38 | ¥217,400 | ¥116,200 | ¥152k–¥337k | ¥88k–¥931k | ¥82,900 | 12 mo |
| 20 | Zaborin (坐忘林) | Kutchan, Hokkaido | Ryokan | 15 | ¥216,000 | ¥182,100 | ¥172k–¥358k | ¥128k–¥488k | ¥134,700 | 12 mo |
| 21 | Ryotei Hansuiryo (旅亭 半水盧) | Unzen, Nagasaki | Ryokan | 14 | ¥215,700 | ¥174,200 | ¥165k–¥405k | ¥86k–¥1,314k | ¥105,900 | 12 mo |
| 22 | Kurokawa Onsen Gosho Gekkoju (黒川温泉御処 月洸樹) | Minamioguni, Kumamoto | Ryokan | 8 | ¥211,000 | ¥172,300 | ¥166k–¥349k | ¥127k–¥631k | — | 11 mo |
| 23 | Momoyama Onsen Tsukimikan (桃山温泉 月見館) | Fushimi, Kyoto City | Ryokan | 10 | ¥201,200 | ¥153,500 | ¥130k–¥413k | ¥81k–¥539k | — | 11 mo |
| 24 | THE HIRAMATSU HOTELS & RESORTS Atami (THE HIRAMATSU HOTELS&RESORTS 熱海) | Atami, Shizuoka | Deluxe | 13 | ¥196,800 | ¥135,400 | ¥140k–¥310k | ¥74k–¥528k | — | 12 mo |
| 25 | Oriental Hills Okinawa (オリエンタルヒルズ沖縄) | Onna, Okinawa | Deluxe | 14 | ¥195,500 | ¥134,400 | ¥134k–¥269k | ¥39k–¥386k | — | 12 mo |
| 26 | sankara hotel & spa Yakushima (sankara hotel & spa 屋久島) | Yakushima, Kagoshima | Resort | 29 | ¥191,100 | ¥88,500 | ¥109k–¥414k | ¥52k–¥1,212k | ¥89,400 | 12 mo |
| 27 | Shiki no Irodori Hatago (四季の彩旅篭) | Kita-ku, Kobe, Hyogo | Ryokan | 8 | ¥190,000 | ¥110,000 | ¥106k–¥270k | ¥82k–¥420k | ¥103,800 | 12 mo |
| 28 | Izu Retreat Atagawa Suiko by Onko Chishin (伊豆リトリート 熱川粋光 by 温故知新) | Higashiizu, Shizuoka | Ryokan | 16 | ¥189,000 | ¥96,600 | ¥118k–¥271k | ¥83k–¥512k | ¥77,500 | 10 mo |
| 29 | Gora Kadan (強羅花壇) | Hakone, Kanagawa | Ryokan | 41 | ¥188,200 | ¥149,000 | ¥125k–¥319k | ¥96k–¥860k | — | 11 mo |
| 30 | Kawaguchiko Onsenji Yumedono (河口湖温泉寺 夢殿) | Fujikawaguchiko, Yamanashi | Ryokan | 9 | ¥184,200 | ¥90,200 | ¥96k–¥276k | ¥52k–¥610k | ¥105,700 | 12 mo |
Source: Compiled by HotelBank Editorial Team from MetroEngines Research data (population 12,673 properties; 588 properties ranked). Room counts are as registered in our property database. Estimated settled ADR is the average of months for which it could be calculated; “—” indicates properties outside the estimation scope, such as those classified as deluxe hotels. For Park Hyatt Tokyo, months observed are counted from its reopening in December 2025.
By property type, the top 30 comprise 15 ryokan, 11 deluxe hotels and 4 resort hotels. By prefecture, Tokyo leads with six properties, followed by Shizuoka with five and Kanagawa, Kyoto and Okinawa with three each. Seven properties are clustered in hot-spring areas within easy reach of the Tokyo metropolitan area — Atami, Izu, Hakone and Yugawara — forming a second core of the high-price segment alongside the urban hotels.
Listed Price and Estimated Settled ADR Are Different Numbers — the Higher the Rank, the More Reinterpretation Needed
The median listed price measures “what price band a hotel puts on sale”; it does not equal the per-room rate actually sold. The more high-priced suites and meal-inclusive plans a property lists, the higher its median is pushed. In a separate analysis of a single property, capturing every listing over 36 days produced a range from ¥21,780 to ¥233,530 — a 10.7x spread.
Comparing the 15 top-30 properties (ryokan and resorts) for which estimated settled ADR could be calculated, settled ADR was 0.36–0.65x the median listed price, with a median of 0.47x. Re-ranked by estimated settled ADR, No. 1 is THE SHIGIRA (¥191,200), No. 2 Sanso Takefue (山荘 竹ふえ; Minamioguni, Kumamoto; ¥156,100), No. 3 ABBA RESORTS IZU – Zagyoso (Ito, Shizuoka; ¥141,800) and No. 4 Zaborin (坐忘林; Kutchan, Hokkaido; ¥134,700). Zaborin, 20th by listed price, moves into the top tier when measured by the level at which rooms actually sell. The reading is that properties which keep their entry price high and rarely discount from it see settled ADR converge toward listed prices. At the prefecture level, our separate analysis puts the ratio of listed price to settled rate at 1.7–2.9x across Japan’s 47 prefectures.
The same reinterpretation is needed at the area level. In Rusutsu Village, Hokkaido (a ski resort), the listed price (area median of the all-plan average) was ¥154,300 in January 2026 (a finalized month), while estimated settled ADR was ¥68,000. Looking ahead, January 2027 shows a listed price of ¥246,200 and estimated settled ADR of ¥108,300 — well above a year earlier as of the survey date. However, the January 2027 settled ADR estimate is based on only two properties, and the listed price is an interim reading from 13 listing properties. Note that in the winter peak, listed prices rise sharply, yet in many months settled rates remain at less than half of listed levels.
Source: Compiled by HotelBank Editorial Team from MetroEngines Research data (Rusutsu Village, Hokkaido. Listed price = area median of the all-plan average, tax included; estimated settled ADR = tax-excluded equivalent. 5–22 listing properties; 2–3 properties for estimated settled ADR. From September 2026 onward, estimates are based on listing levels at the survey date.)
Where Are the ¥100,000+ Properties? — Regions Lead in Count, Cities in Rooms
Properties with a median listed price of ¥100,000 or more numbered 242 across 39 prefectures, with 12,433 rooms in total. The count narrows to 23 at ¥200,000 or more and to just 3 at ¥300,000 or more. Splitting them into “urban” properties in the wards of Tokyo (23 wards), Osaka City and Kyoto City and “regional/resort” properties everywhere else reveals a clear two-way divide.
Urban properties number 39 with 7,160 rooms (57.6%), and a median of 164 rooms per property. Regional/resort properties dominate by count at 203 (83.9%), but hold only 5,273 rooms, with a median of just 15 rooms. Tokyo alone has 24 properties and 5,755 rooms — 46.3% of all ¥100,000+ rooms. By municipality, the most properties are in Hakone (17), Atami and Chiyoda (10 each), Kita-ku, Kobe (Arima Onsen, 8) and Ito (8). Japan’s high-price segment is shaped by two streams: large luxury hotels in cities and small luxury ryokan and resorts in the regions.
Source: Compiled by HotelBank Editorial Team from MetroEngines Research data (242 properties with a median listed price of ¥100,000 or more. Circle size = room count; dark blue = urban, light blue = regional/resort)
Source: Compiled by HotelBank Editorial Team from MetroEngines Research data (total rooms at properties with a median listed price of ¥100,000 or more, top 10 prefectures)
Viewed instead at the level of an area’s “typical property,” the line-up of high-rate areas changes. The top municipalities by estimated settled ADR (12-month average, 10+ target properties) are hot-spring and resort destinations — Echizen (¥31,500), Minamioguni (¥29,600), Kyotango (¥27,700), Kutchan (¥27,500) and Hakone (¥26,400) — with Shibuya (¥25,300) and Higashiyama, Kyoto (¥23,600) the urban entries.
Seasonal shapes split into two. Kutchan (Niseko) peaked at ¥63,500 in February against a low month of ¥13,100 — 4.9x; Echizen peaked in December at 4.2x, and Kyotango in January at 2.8x. These are “winter-peak” areas where rates jump in winter. By contrast, Hakone and Minamioguni have a peak-to-trough ratio of 1.3x and Minamiaso 1.2x, closer to a “year-round” pattern. Urban Shibuya and Higashiyama peak in April, with the high point arriving in the spring sightseeing season.
| Municipality | Est. settled ADR (12-mo avg) | Peak month | Low month | Peak ÷ low | Listed price (all-plan avg) | Properties in settled estimate | Pattern |
|---|---|---|---|---|---|---|---|
| Echizen, Fukui | ¥31,500 | ¥61,800 (Dec 2025) | ¥14,600 | 4.2x | ¥57,700 | N=17–21 | Onsen/resort |
| Minamioguni, Kumamoto | ¥29,600 | ¥32,200 (Mar 2026) | ¥25,100 | 1.3x | ¥55,100 | N=42–47 | Onsen/resort |
| Kyotango, Kyoto | ¥27,700 | ¥43,600 (Jan 2026) | ¥15,600 | 2.8x | ¥48,600 | N=74–82 | Onsen/resort |
| Kutchan, Hokkaido | ¥27,500 | ¥63,500 (Feb 2026) | ¥13,100 | 4.9x | ¥62,100 | N=20–24 | Onsen/resort |
| Hakone, Kanagawa | ¥26,400 | ¥28,900 (Nov 2025) | ¥22,700 | 1.3x | ¥51,800 | N=170–187 | Onsen/resort |
| Minamiaso, Kumamoto | ¥25,600 | ¥27,900 (Jan 2026) | ¥22,500 | 1.2x | ¥28,400 | N=14–18 | Onsen/resort |
| Shibuya, Tokyo | ¥25,300 | ¥30,400 (Apr 2026) | ¥20,600 | 1.5x | ¥44,600 | N=29–34 | Urban |
| Hatsukaichi, Hiroshima | ¥24,800 | ¥28,400 (Nov 2025) | ¥20,200 | 1.4x | ¥42,900 | N=34–35 | Onsen/resort |
| Atami, Shizuoka | ¥24,600 | ¥30,200 (Dec 2025) | ¥19,400 | 1.6x | ¥50,700 | N=99–108 | Onsen/resort |
| Urayasu, Chiba | ¥23,900 | ¥30,900 (Nov 2025) | ¥18,200 | 1.7x | ¥38,700 | N=29–30 | Theme park |
| Yufu, Oita | ¥23,700 | ¥27,100 (Dec 2025) | ¥19,200 | 1.4x | ¥45,500 | N=131–142 | Onsen/resort |
| Higashiyama, Kyoto City | ¥23,600 | ¥31,900 (Apr 2026) | ¥17,500 | 1.8x | ¥44,000 | N=43–51 | Urban |
Source: Compiled by HotelBank Editorial Team from MetroEngines Research data (finalized months, September 2025–August 2026. Limited to municipalities with 10+ properties in the settled estimate in every month, and with every month at 60% or more of the series median.)
Why These Prices Hold — Four Axes: Room Count, Room Size, Reviews and Seasonality
We organized what the top 30 have in common along four axes. The first is room count. The median total room count of the top 30 is 15.5 — less than half the population median (39). Seventeen properties have 20 rooms or fewer. By concentrating experiences such as cuisine, baths and views in a small number of rooms, they raise the value of each room. Plotting the 242 ¥100,000+ properties by room count and median listed price shows two separate clusters: 26 of the 39 urban properties have 120 rooms or more, while 165 of the 203 regional/resort properties have 30 rooms or fewer.
Source: Compiled by HotelBank Editorial Team from MetroEngines Research data (242 properties with a median listed price of ¥100,000 or more. Horizontal axis on a logarithmic scale)
The second is room size. Among the nine top-30 properties whose room names state a floor area, the median area was 73㎡. No. 1 Aman Tokyo also states that every room is 71㎡ or larger; spacious rooms underpin the high price band. The third is reviews: the overall guest review score compiled by the HotelBank Editorial Team (out of 5, cumulative) has a top-30 median of 4.73, above the median of 4.06 across 12,389 properties in the population. Twenty-one of the 30 score 4.5 or higher. On the other hand, the median review count is 1,197 — lower than the population’s 1,405 — suggesting that with so few rooms, reviews accumulate slowly.
The fourth is seasonality. Calculating each property’s ratio of highest to lowest monthly median listed price, the top-30 median is 1.67x. All nine urban properties reach their peak month in March–May, likely because domestic and international demand overlaps during the cherry-blossom and fresh-greenery season. Among the 21 regional/resort properties, 11 peak in summer (centered on August), 5 in autumn (September–November) and 4 in spring; only Zaborin in Kutchan peaked in winter (January, peak-to-trough 2.13x). Even in Niseko, a winter-peak area overall, the top ryokan sustain high price levels year-round.
Source: Compiled by HotelBank Editorial Team from MetroEngines Research data (monthly median listed price per room per night for two guests. Months with fewer than 10 observations are not shown)
| Axis | Top 30 by listed price | Benchmark | How to read it |
|---|---|---|---|
| Total rooms (median) | 15.5 rooms | 39 rooms (population: 12,673 properties) | 17 of 30 have 20 rooms or fewer — designed to concentrate the experience per room |
| Room area (median of 9 properties stating floor area in room names) | 73㎡ | — | Every room at Aman Tokyo is 71㎡ or larger (official). Space underpins the price |
| Guest review score (out of 5, median) | 4.73 | 4.06 (N=12,389 properties) | 21 of 30 score 4.5 or higher |
| Review count (cumulative, median) | 1,197 | 1,405 (same population) | Counts are modest — with few rooms, reviews accumulate slowly |
| Seasonal swing (peak ÷ low monthly median, median) | 1.67x | — | All 9 urban properties peak in Mar–May; 11 of 21 resort properties peak in summer |
Source: Compiled by HotelBank Editorial Team from MetroEngines Research data. Review scores and counts compiled by HotelBank Editorial Team (cumulative). Room area aggregated from floor areas stated in room names.
The gap between top properties and the “typical property” in the same town is also large. Zaborin’s estimated settled ADR (¥134,700) is 4.9x the Kutchan area level (¥27,500), and Sanso Takefue’s (¥156,100) is 5.3x that of Minamioguni (¥29,600). Drawing on the same hot-spring destination and the same seasonal demand, they generate rates roughly five times higher through the design of room count, room size and experience.
Knowing Your Property’s “Ceiling” — Using This Data to Explore Price Bands
This article’s purpose is to answer directly “which properties are the most expensive,” but for hotel operators it also offers clues to the “ceiling” above their own price band. There are three ways to use it.
First, treat the lower bound (P10) of the core range of top properties in the same municipality as the “entrance to the ceiling.” For example, against Hakone’s area level (estimated settled ADR ¥26,400), Gora Kadan (強羅花壇) in the same town has a core-range lower bound of ¥125,400. Looking at how wide the gap is between your price band and that entrance, and which properties sit in between, gives a benchmark for room renovations and plan design to move closer to the upper tier.
Second, check the seasonal shape. In winter-peak areas, peak-season rates widen to 4–5x the lowest month, while in year-round areas the ratio stays at 1.2–1.3x. Which type your area belongs to determines whether the greater room for growth lies in raising prices in specific months or in building up rates throughout the year.
Third, look for white space in the combination of room count and price band. ¥100,000+ properties are polarized into “large urban” and “small regional” types; properties with 30–100 rooms are relatively few, at 36 of 242. This mid-sized tier is a less contested zone within the high-price segment. How high-priced inventory fills up is covered in Do ¥100k+ Rooms Sell Last? Index 53 on Normal Saturdays, 24 at Obon. Read together with this article, it shifts the perspective from “where prices are high” to “where there is room to grow.”
Frequently Asked Questions
Q. What is the most expensive hotel in Japan?
Within the coverage of MetroEngines Research, it is Aman Tokyo (Chiyoda, Tokyo). Its median listed price per room per night for two guests from September 2025 to August 2026 was ¥423,000, and its lowest price over the 12 months was ¥280,700. No. 2 is THE SHIGIRA (Miyakojima, Okinawa; ¥420,900) and No. 3 is Asaba (Izu, Shizuoka; ¥379,800).
Q. What is the tallest hotel in Japan by building height?
By building height, it is the Osaka Marriott Miyako Hotel, located in Abeno Harukas (300m tall). Its guest rooms are on floors 38–55.
Q. Is the listed price the same as the average room rate?
No. Listed prices include high-priced suites and meal-inclusive plans, so among the top-15 properties for which estimated settled ADR could be calculated, settled ADR was 0.36–0.65x the median listed price (median 0.47x).
Q. How many hotels and ryokan cost more than ¥100,000 per night?
There are 242 properties (12,433 rooms in total) across 39 prefectures with a median listed price of ¥100,000 or more. Regional/resort properties account for 83.9% by count, while urban properties in Tokyo’s 23 wards, Osaka City and Kyoto City hold 57.6% of the rooms.
Summary
Japan’s most expensive hotel is Aman Tokyo, with a median listed price of ¥423,000. Yet its lead over No. 2 THE SHIGIRA is only 0.5%, and when re-ranked by estimated settled ADR, small regional properties such as THE SHIGIRA, Sanso Takefue and Zaborin move to the front. Among ¥100,000+ properties, large urban hotels centered on Tokyo lead in room count, while small inns in hot-spring towns, on remote islands and in highland areas lead in property count. What sustains these prices is the density of experience achieved by limiting room counts, spacious rooms, high guest ratings and the ability to capture seasonal peaks. Knowing the ceiling of the price band above your own property is a starting point for deciding your next move.
Methodology and Sources
Period: Stay dates September 1, 2025 – August 31, 2026 (12 finalized months). Aggregated on September 26, 2026.
Population: Of the approximately 27,000 operating properties tracked by MetroEngines Research, 12,673 properties in seven property types — ryokan, resort hotel, business hotel, city hotel, deluxe hotel, adults-only and auberge — with three or more rooms and at least six months of listing observations during the period. Simple-lodging categories including guesthouses, minshuku, pensions, machiya, vacation rentals and cottages (including whole-building rentals) were excluded as unsuitable for a per-room, two-guest rate comparison.
Ranking procedure: For the 589 properties in the population whose monthly average listed price was ¥80,000 or more, we aggregated every one-night, two-guest listed plan (approximately 29.33 million records in total). We excluded about 657,000 plans requiring multi-night stays and about 547,000 records for rooms accommodating seven or more guests (private buildings, large villas, etc.). We then ranked the 588 properties with at least 30 listings and at least 20 days of observed sales in descending order of median listed price.
Definition of urban: Properties located in the wards of Tokyo (23 wards), Osaka City and Kyoto City. All others are classified as regional/resort.
Estimated settled ADR: For individual properties, the average of months for which it could be calculated; for areas, the median of target properties in the municipality, averaged over 12 months. ADR figures in this article are estimates (median error about 7% when cross-checked against REIT-disclosed results).
Sources: Listed prices and estimated settled ADR = MetroEngines Research / Review scores and counts = compiled by HotelBank Editorial Team / Opening years and room counts of Hyatt properties = Hyatt Japan, “Press Materials, April 2026” / Room counts of Hilton properties = Hilton, “Company Overview” (updated August 25, 2026).
⚠ Note on ADR for future dates: Values for Rusutsu Village from September 2026 onward are estimates based on selling prices published on OTAs and similar channels at the survey date and will change as check-in dates approach. Please note that prices currently set high may fall with last-minute discounting.
Related Articles
- Do ¥100k+ Rooms Sell Last? Index 53 on Normal Saturdays, 24 at Obon
- Niseko’s Top Tier: Just 2 Hotels, 75 Rooms — Where Fairmont’s 165 Fit
References and Sources
■ Data sources
Publicly listed selling prices on OTAs and similar channels collected by MetroEngines Research (per room per night for two guests, tax included, stay dates September 1, 2025 – August 31, 2026), and estimated settled ADR (tax-excluded equivalent) calculated from the same data. Review scores and counts compiled by HotelBank Editorial Team (cumulative); room counts as registered in our property database; room areas from floor areas stated in room names.
■ Calculation assumptions
Rankings are based on each property’s median listed price (counted per stay date × room × plan), covering 588 properties with at least 30 listings and at least 20 days of observed sales. Plans with multi-night conditions and rooms for seven or more guests were excluded. Estimated settled ADR is an estimate obtained by multiplying the lowest-plan level by a property-type-specific adjustment factor; the median error when cross-checked against property-level results disclosed by REITs is about 7%. Area levels are the median of target properties in each municipality, averaged over 12 months.
■ Limitations and caveats
Listed prices are prices on sale and do not represent actual settled rates or occupancy. Properties classified as deluxe hotels are outside the scope of the settled ADR estimate and are shown with listed prices only. Rooms and plans sold exclusively through direct channels and not listed on OTAs are not included. Dates from September 2026 onward are estimates based on listing levels at the survey date and may change.
- MetroEngines Research — Listed prices per room per night for two guests (September 2025–August 2026; population 12,673 properties, 588 ranked) and estimated settled ADR by municipality
- HotelBank Editorial Team research — Overall guest review scores and review counts (cumulative)
- Aman Tokyo, “Rooms & Suites” (official website)
- Chiyoda City Tourism Association, “Aman Tokyo” (Visit Chiyoda)
- Park Hyatt Tokyo, “Reopening on Tuesday, December 9, 2025” (PR TIMES)
- Hyatt Japan, “Press Materials, April 2026”
- Hilton, “Company Overview” (updated August 25, 2026)
- Japan Tourism Agency, “Overnight Travel Statistics Survey”
- Japan National Tourism Organization (JNTO), “Visitor Arrivals Statistics”
Source: Hyatt Japan, “Press Materials, April 2026”
Source: Hilton, “Company Overview” (updated August 25, 2026)