

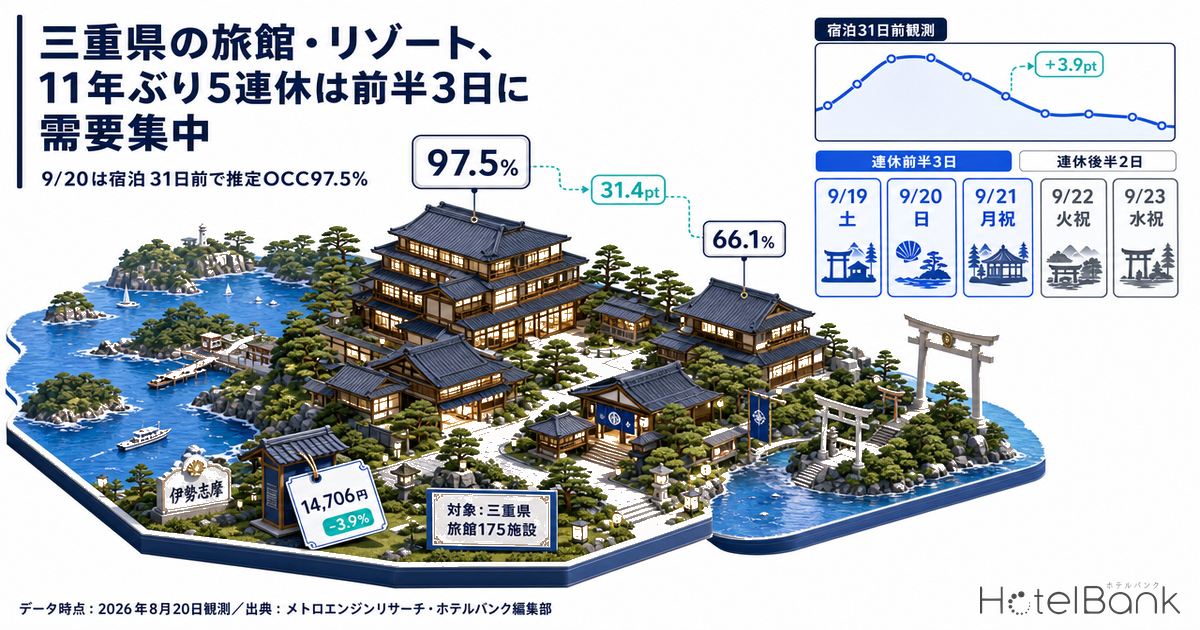
The stretch from Saturday 19 September to Wednesday 23 September 2026 forms Japan’s first five-day holiday in eleven years, created because 22 September (Tue) — sandwiched between Respect for the Aged Day and the Autumnal Equinox — becomes a “Citizens’ Holiday.” Tracking booking progress for ryokan and resort hotels in Mie Prefecture (including Ise, Toba and Shima) from 45 days before stay through the most recent observation, demand is clearly concentrated in the first three days (19–21 Sep). As of the 20 August 2026 observation, ryokan estimated OCC (OTA-listed inventory basis) reaches 97.5% for 20 September — the middle day of the holiday, 31 days before stay — across 175 observed properties, while 23 September (Wed, Autumnal Equinox, 34 days before stay) sits at just 66.1% across 175 observed properties. That is a 31.4pt spread inside a single holiday block.
Scope: ryokan and resort hotels in Mie Prefecture. N = 175–183 ryokan / 21–34 resort hotels (varies by observation date). Price figures in this article are estimated settled ADR (the transaction price level inferred from OTA and other sales data, tax-excluded equivalent); occupancy is an estimate on an OTA-listed inventory basis. Both definitions appear at the end of this article. Data as of 21 August 2026 (observations through 20 August 2026).
- — Ryokan estimated OCC for 20 September (the middle day) is 97.5% at 31 days before stay (175 observed properties), while 23 September (Wed, Autumnal Equinox) is 66.1% at 34 days before stay (175 observed properties). A 31.4pt gap sits inside the same five-day holiday.
- — Demand is concentrated in the first three days (19–21 Sep). Ryokan run 89.2–97.5% there, whereas the back two days (22 and 23 Sep) sit at 66.1–77.2% — barely different from an ordinary Saturday such as 12 September at 75.8%.
- — 20 September had already reached 93.6% at 45 days before stay (182 observed properties), with only +3.9pt added since. The decisive pricing window for that date sits earlier than T-45.
- — By contrast, 19 September added +5.9pt and 21 September +5.6pt after T-45 — a pattern that builds late. Even within one holiday, the timing of the lever differs by date.
- — Monthly estimated settled ADR for Mie ryokan was ¥15,365 in July 2026 (N=207 properties, settled), down 3.9% year on year. Inside September — a trough month on a monthly basis — sit three days matching the Obon peak (96.6% on 11 August 2026).
The first five-day holiday in 11 years — demand clusters in the front three days
Silver Week in September 2026 runs from Saturday 19 September to Wednesday 23 September, because 22 September (Tue) — falling between Respect for the Aged Day (21 Sep, Mon) and the Autumnal Equinox (23 Sep, Wed) — becomes a “Citizens’ Holiday” under Japan’s holiday law. It is the first five-day run since 2015, eleven years ago.
In the Mie ryokan market, however, those five days are not a single monolithic block of demand. Lining up the 20 August 2026 observation cross-section (30–34 days before stay) by property type, the front three days and the back two days look like entirely different products.
| Stay date | Observation point | Ryokan est. OCC | Observed properties | Resort est. OCC | Observed properties | All types est. OCC |
|---|---|---|---|---|---|---|
| Sep 19 (Sat) | T-30 | 89.2% | 176 | 83.5% | 32 | 85.9% |
| Sep 20 (Sun) | T-31 | 97.5% | 175 | 96.5% | 32 | 94.8% |
| Sep 21 (Mon, Respect for the Aged Day) | T-32 | 95.7% | 175 | 94.9% | 32 | 91.7% |
| Sep 22 (Tue, Citizens’ Holiday) | T-33 | 77.2% | 175 | 78.8% | 32 | 75.2% |
| Sep 23 (Wed, Autumnal Equinox) | T-34 | 66.1% | 175 | 71.6% | 32 | 65.1% |
| Sep 12 (Sat, ordinary) reference | T-23 | 75.8% | 181 | 79.2% | 33 | — |
| Sep 5 (Sat, ordinary) reference | T-16 | 73.1% | 180 | 82.4% | 33 | — |
Source: compiled by the HotelBank Editorial Team from MetroEngines Research (observed 20 August 2026)
On 20 September, the middle day of the holiday, both ryokan and resort hotels are already in the high 90s a month out from the stay date. For reference, the same Mie ryokan set recorded an actual estimated OCC of 96.6% for 11 August 2026 (Tue, during Obon) across 190 observed properties. 20 September is still only a mid-progress reading at 31 days before stay, yet it already exceeds that level. For how August peaked across property types in Mie, see Mie August Booking Curves: Business Hotels Swing 25.5pt, Ryokan 9.7pt.
By contrast, 22 and 23 September stay at — or below — the level of ordinary Saturdays such as 12 September (75.8%, 181 observed properties) and 5 September (73.1%, 180 observed properties). The shape of the calendar and the shape of what is actually selling do not match. The back half of the holiday lagging the front half is visible nationally as well: Silver Week 2026 Back Half at T-47: Sep 23 Matches a Normal Wednesday shows 23 September progressing at the pace of an ordinary Wednesday.
Source: compiled by the HotelBank Editorial Team from MetroEngines Research
Laying the latest cross-section side by side across stay dates, the holiday “peak” clearly fits inside a three-day window topped by 20 September, then drops sharply from 22 September onward. The estimated sold-out property rate — the share of properties with no listed inventory identifiable — traces the same shape. A peak on the middle day is not unique to Mie: Hokkaido Silver Week: Sep 20 Peaks, Ryokan 96.4%, Only Business Dips observes the same ordering.
Source: compiled by the HotelBank Editorial Team from MetroEngines Research (ryokan, observed 20 August 2026 / 175–177 observed properties)
How much was added between T-45 and now — and when each date filled up
Beyond the level itself, looking at which interval the bookings accumulated in sharpens the difference in character between dates. The table below sets the T-45 reading against the latest observation (20 August 2026) for each stay date, and shows the gain in between. Observed property counts are given at every data point.
| Stay date | Type | Est. OCC at T-45 (observed properties) |
Latest est. OCC (observed properties / days out) |
Gain |
|---|---|---|---|---|
| Sep 19 (Sat) | Ryokan | 83.3% (181) | 89.2% (176 / T-30) | +5.9pt |
| Resort | 76.3% (33) | 83.5% (32 / T-30) | +7.2pt | |
| Sep 20 (Sun) | Ryokan | 93.6% (182) | 97.5% (175 / T-31) | +3.9pt |
| Resort | 90.0% (33) | 96.5% (32 / T-31) | +6.5pt | |
| Sep 21 (Mon, Respect for the Aged Day) | Ryokan | 90.1% (181) | 95.7% (175 / T-32) | +5.6pt |
| Resort | 88.0% (33) | 94.9% (32 / T-32) | +6.9pt | |
| Sep 22 (Tue, Citizens’ Holiday) | Ryokan | 72.4% (182) | 77.2% (175 / T-33) | +4.8pt |
| Resort | 72.4% (33) | 78.8% (32 / T-33) | +6.4pt | |
| Sep 23 (Wed, Autumnal Equinox) | Ryokan | 63.7% (182) | 66.1% (175 / T-34) | +2.4pt |
| Resort | 68.5% (33) | 71.6% (32 / T-34) | +3.1pt | |
| Sep 12 (Sat, ordinary) | Ryokan | 70.2% (188) | 75.8% (181 / T-23) | +5.6pt |
| Resort | 75.1% (34) | 79.2% (33 / T-23) | +4.1pt | |
| Sep 5 (Sat, ordinary) | Ryokan | 68.7% (150) | 73.1% (180 / T-16) | +4.4pt |
| Resort | 75.6% (31) | 82.4% (33 / T-16) | +6.8pt |
Source: compiled by the HotelBank Editorial Team from MetroEngines Research
Mie ryokan on 20 September had already reached 93.6% (182 observed properties) at T-45, and only +3.9pt has been added since. In other words, most of that date’s demand landed before the 45-day mark. Conversely, 19 September (+5.9pt) and 21 September (+5.6pt) built comparatively heavily over the past month and a half. 23 September moved least at +2.4pt, drifting sideways in the mid-60s from T-45 through the low 30s.
A note on the sample. The estimated OCC used here is an aggregate over observable properties only. The booking-curve universe for Mie is 464 properties and 20,635 rooms across all types; of those, ryokan observations run 175–188 properties and resort hotels 21–34, and the observed count shifts day to day. For 20 September ryokan, for example, the observed count at 34 days before stay (observed 17 August 2026) fell to 78 properties, and estimated OCC reads 96.6% — a slight dip between the neighbouring points (96.7% at T-35 with 183 observed properties; 97.0% at T-33 with 131 observed properties). That is not a pullback in demand but variation in the observed sample: a classic case of a thin cross-section manufacturing a false trough or peak. Always read the shape of a curve together with the observed property count.
On monthly estimated settled ADR, September is one of the weaker months of the year
The price side deserves a check too. For Mie ryokan (category: ryokan), estimated settled ADR in July 2026 — the most recent settled month — was ¥15,365 (N=207 properties, settled). Against the same month a year earlier (July 2025) at ¥15,985 (N=211 properties, settled), that is -3.9%. Resort hotels came in at ¥19,275 in July 2026 (N=39 properties, settled) versus ¥22,551 in July 2025 (N=35 properties, settled), or -14.5%.
| Month | Basis | Ryokan est. settled ADR (N) | Resort est. settled ADR (N) |
|---|---|---|---|
| July 2025 | Settled | ¥15,985 (211) | ¥22,551 (35) |
| July 2026 | Settled | ¥15,365 (207) | ¥19,275 (39) |
| Year on year | Settled vs settled | -3.9% | -14.5% |
| September 2025 | Settled | ¥15,576 (202) | ¥19,816 (35) |
| September 2026 | Current estimate | ¥14,706 (203) | ¥20,091 (38) |
Source: compiled by the HotelBank Editorial Team from MetroEngines Research
For September 2026, ¥14,706 for ryokan (N=203 properties) and ¥20,091 for resort hotels (N=38 properties) are estimates based on current sales conditions. These are not settled figures and will move as selling continues. A straight comparison against the prior-year settled figure should wait for the month to close.
Overlaying settled series year on year to read the seasonal shape, September stands out as one of the weaker months of the year for Mie ryokan. In the 2025 settled series, the annual peak is December at ¥19,586 (N=200 properties), followed by August at ¥19,218 (N=205 properties), while September sits at ¥15,576 (N=202 properties) — second-lowest after June at ¥15,310 (N=216 properties).
Source: compiled by the HotelBank Editorial Team from MetroEngines Research
The structure is visible here. On a monthly view September is an annual trough — yet buried inside that September are three days showing inventory absorption on par with the Obon peak. Treat September as a “weak month” on the strength of average ADR alone, and pricing for those three days gets dragged down toward the monthly mean. Take the opposite tack and set the whole month aggressively on the strength of the three holiday days, and inventory stalls on 22 and 23 September and on the ordinary weekdays outside the holiday.
For revenue managers running ryokan and resort hotels in Mie — implications and an action plan
1. Do not treat the five-day holiday as one demand block. The market data shows 19–21 September and 22–23 September tracing entirely different demand curves. Ryokan carry 97.5% (Sep 20, T-31, 175 observed properties) and 66.1% (Sep 23, T-34, 175 observed properties) inside the same holiday. When reviewing your own remaining inventory, look at it day by day rather than as a single holiday-wide count.
2. The “Sep 20 type” (already high at T-45) and the “Sep 19 / Sep 21 type” (building over the last month and a half) call for different timing. Mie ryokan on 20 September stood at 93.6% at T-45 (182 observed properties), with only +3.9pt added since. For dates shaped like that, the decisive pricing window sits earlier than T-45. By contrast, 19 September (+5.9pt) and 21 September (+5.6pt) built heavily after T-45, leaving comparatively more room for judgement in the near-term window. Check day by day which shape your own curve resembles.
3. Do not measure monthly ADR and holiday-day rates with the same yardstick. Estimated settled ADR for Mie ryokan was ¥15,365 in July 2026 (N=207 properties, settled) and ¥14,706 for September 2026 (N=203 properties, current estimate) — low by monthly standards. That monthly figure covers holidays and weekdays alike, and is not the kind of number to adopt as-is as a target for the three days where demand concentrates.
4. The back two days (Sep 22 and 23) are a separate selling target, not holiday leftovers. Ryokan sit at 77.2% on 22 September and 66.1% on 23 September (both 175 observed properties) — at or below the ordinary Saturday of 12 September (75.8%, 181 observed properties). There is room to build these as ordinary days rather than as an extension of holiday demand, including capturing them through multi-night stays. The design should differ from the front half.
Translated onto a timeline, it looks like this. The observation point in this article (20 August 2026) is 31 days before stay for 20 September and 34 days before stay for 23 September. Work backwards to decide what to close and what to open at each of T-30 and T-14.
| Horizon | Action | Decision trigger | Objective |
|---|---|---|---|
| Today–this week (around T-30 for Sep 20) | Take stock of remaining allotment for 19–21 September date by date, and decide to hold or raise rates for each day individually | Whether your own absorption for 20 September is clearly lagging the market’s 97.5% ryokan / 96.5% resort (T-31, 175 / 32 observed properties) | Avoid being the only property left cheap on a date where the market is heading toward sold out |
| Today–this week | Open up exposure for 22 and 23 September (return inventory release and plan presentation to an ordinary-day design) | Whether your own 22 and 23 September sit below the market’s ryokan 77.2% / 66.1% (175 observed properties) | Pick up the gap in the back half of the holiday this week, while momentum from the front half remains |
| Within two weeks (around Sep 5 / T-14 for Sep 20) | If minimum-length-of-stay or similar restrictions are in place for the front three days, re-examine whether they are still needed | Whether absorption on your restricted dates has built to the market’s level for 19 September (ryokan 89.2%, 176 observed properties) | Prevent reaching the stay date with remaining allotment still blocked by restrictions |
| Within two weeks | Prepare multi-night offers covering 22 and 23 September, creating a path to extend from the front three days | Whether the 18.5pt drop between 21 September (ryokan 95.7%) and 22 September (77.2%) opens up to a similar degree at your property | Carry front-half demand into the back half and even out absorption across the whole holiday |
| Looking to next month | Rebuild the September rate-revision calendar around the day-level demand shape rather than the monthly level | Whether your September settings use the market’s estimated settled ADR (ryokan ¥14,706, N=203 properties, current estimate) as a uniform benchmark for every day of the month | Stop pricing for the three peak days being dragged down by the trough month’s average |
| Looking to next month | Identify from your own history the dates that reach high levels by T-45, and start preparation earlier for the next long holiday | Whether your property has dates shaped like 20 September, where the market is already at 93.6% at T-45 (182 observed properties) | Avoid missing dates whose decisive window sits before T-45 by reacting only at the last minute |
Source: compiled by the HotelBank Editorial Team from MetroEngines Research
Summary — three yardsticks for reading Silver Week 2026 in Mie
Yardstick 1: read a holiday by its day-level shape. Even for the first five-day run in eleven years, Mie ryokan hold 97.5% on 20 September alongside 66.1% on 23 September (both 175 observed properties, T-31 / T-34). Length of calendar does not imply uniformity of demand.
Yardstick 2: set your preparation timing by the gain, not the level. 20 September was already at 93.6% at T-45, adding only +3.9pt since. 19 September added +5.9pt, 21 September +5.6pt, 23 September +2.4pt. Even within one holiday, the interval where pricing decisions bite differs by date.
Yardstick 3: monthly ADR is a monthly average, not a target for peak days. Estimated settled ADR for Mie ryokan was ¥15,365 in July 2026 (N=207 properties, settled), down 3.9% year on year, with September 2026 at ¥14,706 (N=203 properties, current estimate). Buried inside a September that reads as a monthly trough are three days matching the Obon peak of 96.6% actual estimated OCC (stay date 11 August 2026, 190 observed properties). Whether these two layers can be managed separately is what will separate outcomes over this holiday.
About the data
Definition of estimated OCC: OTA-listed inventory-basis occupancy = 100 − 100 × rooms still listed on OTAs ÷ total rooms. It is an estimate based on the absorption of inventory sold on OTAs, and is defined differently from actual room occupancy (it reads higher). This article labels it “estimated OCC (OTA-listed inventory basis).” Months covered are August 2026 (actual) and September 2026 (in progress).
Booking curve: based on observations from 45 days before stay through the most recent reading. Fixed points are T-45, T-30 and the latest observation (20 August 2026).
Definition of estimated settled ADR: the transaction price level (tax-excluded equivalent) inferred from OTA and other sales data (cheapest-plan level × property-type coefficient, ensembled across multiple channels). Past months are settled figures; current and future months are estimates based on current sales conditions. Median error against published operating results is 6.6%. Year-on-year comparisons are calculated only between settled months.
Breakdown of N: the booking-curve universe for Mie is 464 properties and 20,635 rooms across all types. Observed property counts for estimated OCC run 150–189 for ryokan and 21–34 for resort hotels, varying by stay date and observation date (noted at every data point in the text and tables). Estimated settled ADR covers 199–227 ryokan and 35–39 resort hotels. The sold-out property rate refers to the estimated share of properties for which no listed inventory can be identified on OTAs and similar channels.
Data as of: 21 August 2026 (observations through 20 August 2026). Because sales conditions and inventory move daily, the figures in this article are a snapshot at the time of retrieval.
References and sources
• Cabinet Office of Japan, “About National Holidays” https://www8.cao.go.jp/chosei/shukujitsu/gaiyou.html
• Shukujitsu.jp, “When is Silver Week 2026? [Five days, Sep 19–23]” https://shukujitsu.jp/silver-week/2026/
• Impress Watch, “Silver Week ends — September 2026 brings the first long holiday in 11 years” https://www.watch.impress.co.jp/docs/topic/2048266.html
■ Data sources
Daily observation of OTA-listed inventory and listed prices across Mie Prefecture (compiled by MetroEngines Research). The booking-curve universe is 464 properties and 20,635 rooms across all types; this article tracks ryokan (150–189 observed properties) and resort hotels (21–34 observed properties) from 45 days before stay through the latest observation (20 August 2026). Monthly estimated settled ADR covers 199–227 ryokan and 35–39 resort hotels. Holiday classifications follow the Cabinet Office’s “About National Holidays.” Data as of 21 August 2026.
■ Calculation assumptions
Estimated OCC = 100 − 100 × rooms still listed on OTAs ÷ total rooms. Comparisons between stay dates are aligned on identical lead-time cross-sections (T-45, T-30, latest observation), matching different stay dates at the same number of days out. The gain is the difference (in pt) between the T-45 cross-section and the latest observation. The sold-out property rate is the estimated share of properties for which no listed inventory can be identified on OTAs and similar channels. Estimated settled ADR is monthly at base; past months are settled figures while current and future months are estimates based on current sales conditions, and year-on-year figures are calculated only between settled months.
■ Limitations and caveats
Estimated OCC is an estimate based on the absorption of inventory sold on OTAs; it is defined differently from actual room occupancy and reads higher. Observed property counts vary by stay date and observation date, so N is expressed as a range — because a thin cross-section manufactures false troughs and peaks (the observed count for 20 September at T-34 fell to 78 properties), the shape of a curve must always be read together with the observed property count. Mid-progress cross-sections and completed-month actuals cannot be compared directly on level; what is comparable is the ordering of dates and the size of the gaps between them. Estimated settled ADR for September 2026 is inferred from inventory still on sale, and a straight comparison against settled figures should wait for the month to close (median error against published operating results is 6.6%). Because sales conditions and inventory move daily, the figures in this article are a snapshot at the time of retrieval.
Related reading
- Mie August Booking Curves: Business Hotels Swing 25.5pt, Ryokan 9.7pt
- Hokkaido Silver Week: Sep 20 Peaks, Ryokan 96.4%, Only Business Dips
- Silver Week 2026 Back Half at T-47: Sep 23 Matches a Normal Wednesday
- Osaka Sep 2026 Holiday: Demand Peaks First 2 Nights, Sep 23 at 58.0%
- Nagano September: Wed 58.7% vs Holiday Sat 93.0%, 34pt Gap Holds
- Ibaraki Sep Booking Curves: Peak Sep 19-21 at 74.9%, Sep 23 55.7%
- Silver Week 2026: First in 11 Years — ADR & Booking Curve Analysis
- Aso & Kurokawa Onsen Are Open: Autumn ADR Flat, Sept Holiday 1.5% Left