

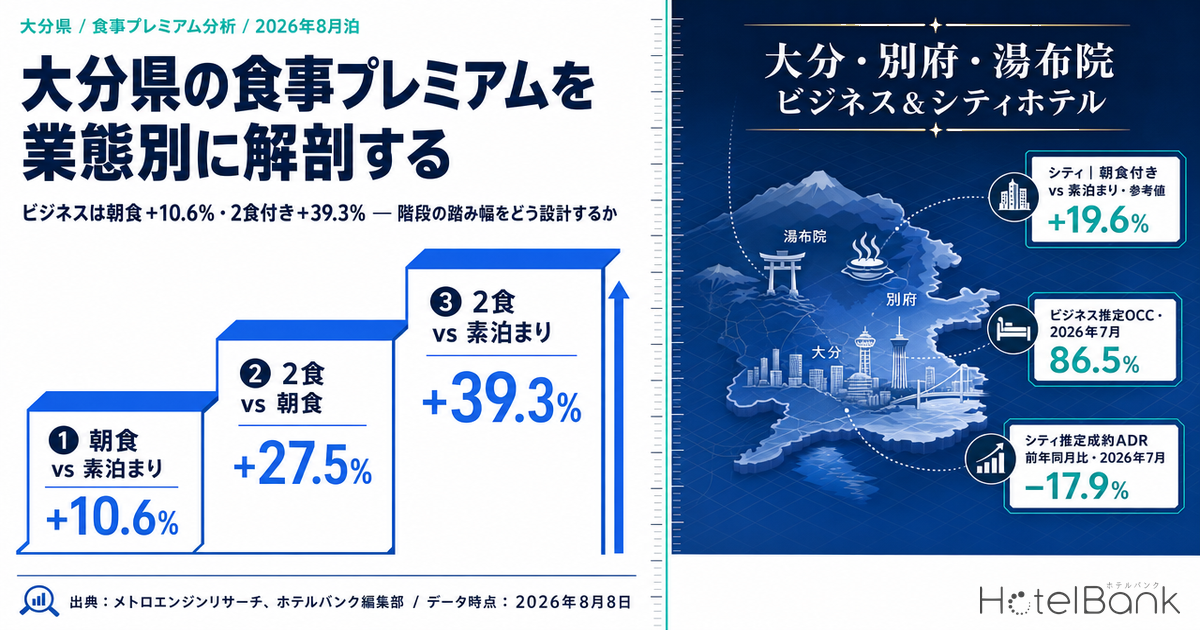
When hotels in Oita are matched against themselves — pairing sales conditions within the same property that differ only in the meal plan — the meal premium for August 2026 stays takes a completely different shape depending on the segment. At business hotels, breakfast-included stays command only +10.6% over room-only (37 paired properties), while half-board (breakfast plus dinner) runs +27.5% above breakfast-included (20 paired properties) and +39.3% above room-only (15 paired properties). It is a back-loaded staircase: a shallow first step, a deep second one. City hotels take almost twice the business-hotel step size right at the first tread, at +19.6% (9 paired properties, reference value). Within a single prefecture, the pricing structure for the same commodity — food — splits this sharply by segment. This article examines how to design those step sizes, laying the question over actual estimated settled ADR and estimated occupancy data.
Scope: business hotels and city hotels in Oita. Meal premiums are same-property paired comparisons for August 2026 stays (business hotels N=37/20/15 properties; city hotels N=9/5 properties); estimated settled ADR covers N=91 business hotels and N=15 city hotels (July 2026, finalized); estimated occupancy for July 2026 covers 78–83 business hotels and 14–15 city hotels. Price figures in this article are estimated settled ADR (the settled price level inferred from OTA and other sales data, pre-tax equivalent); occupancy is an estimate based on OTA-listed inventory. Full definitions appear at the end of the article. Data as of August 8, 2026.
- — The business-hotel staircase is back-loaded — the uplift from room-only to breakfast-included stops at +10.6% (37 paired properties), but breakfast-included to half-board opens up to +27.5% (20 paired properties).
- — The first step barely moves; only the second one does — across the four months from May 2026 to August 2026 stays, the first step swung just 1.5pt (+10.0% to +11.5%) against 16.9pt for the second (+27.5% to +44.4%). The design headroom sits in the second step.
- — Across Kyushu’s seven prefectures, Oita’s first step ranks second from the bottom — +10.6%, just above the thinnest, Fukuoka at +8.7%. The other five prefectures all sit at +12.1% or higher.
- — Combine the two steps and Oita ranks 6th of 7 — multiplying the first and second steps gives Oita a combined uplift of +41.0%, below Fukuoka’s +41.4% even though Fukuoka has the thinnest first step. Oita is not recovering its thin first step through the second.
- — The base moves in opposite directions by segment — for the finalized month of July 2026, estimated settled ADR was +1.1% YoY at business hotels (N=91 properties) and −17.9% at city hotels (N=15 properties). The same percentage uplift produces a different absolute figure.
The staircase has a different shape by segment — business is back-loaded, city is front-loaded
A meal premium is derived by matching sales conditions within the same property that differ only in the meal plan, and expressing the gap as a ratio. Because location and rooms differ from property to property, subtracting cross-property averages cannot isolate the value of the meal. It is precisely by comparing within the same building that you can read how many percentage points adding breakfast actually earns. The figures below aggregate Oita for August 2026 stays.
Source: Compiled by MetroEngines Research and the HotelBank Editorial Team
The business-hotel staircase has a shallow first step and a deep second one. The uplift from room-only to breakfast-included is +10.6% (37 paired properties), which is quite restrained as a market rate. Move on from breakfast-included to half-board, however, and the step widens sharply to +27.5% (20 paired properties), reaching +39.3% when measured from room-only (15 paired properties). In other words, business hotels in Oita are designed to treat breakfast as a thin uplift for filling rooms, and to go after rate in earnest with a two-meal package that includes dinner.
City hotels, by contrast, place a first step of +19.6% (9 paired properties) — nearly double the business-hotel tread — right at the outset. The second step from breakfast-included to half-board is larger still at +40.0%, reaching +76.9% from room-only (both 5 paired properties), but with only 5 paired properties these need to be treated as reference values. Nothing can be asserted with confidence, yet the picture that emerges is one of creating a clear price gap at the breakfast stage and, once dinner is included, positioning the stay as a separate product from room-only altogether.
One caution is warranted here about the “all-segment” figure that mixes the two. Aggregated across all of Oita, the breakfast-included premium over room-only comes to just +2.8% (59 paired properties) — smaller than either business hotels alone at +10.6% or city hotels alone at +19.6%. Because price bands and the role of food differ by segment, a blended average is not usable as an input for your own property’s decisions. If you are going to use a prefectural average as a benchmark, you need a series matched to your segment.
| Segment / combination | May 2026 stays | June | July | August | Paired properties (Aug) |
|---|---|---|---|---|---|
| Business | breakfast-included vs room-only | +10.0% | +11.5% | +11.2% | +10.6% | 37 |
| Business | half-board vs breakfast-included | +40.9% | +44.4% | +28.3% | +27.5% | 20 |
| Business | half-board vs room-only | +55.4% | +61.8% | +40.2% | +39.3% | 15 |
| City | breakfast-included vs room-only (reference value) | +13.4% | +21.1% | +19.8% | +19.6% | 9 |
| City | half-board vs breakfast-included (reference value) | +50.6% | +55.0% | +51.3% | +40.0% | 5 |
| All segments (blended) | breakfast-included vs room-only | +1.4% | +8.4% | +6.3% | +2.8% | 59 |
Source: Compiled by MetroEngines Research and the HotelBank Editorial Team
Tracked month by month, the business-hotel breakfast premium stays inside a narrow 10–11% band: +10.0% for May 2026 stays, +11.5% for June, +11.2% for July and +10.6% for August. A step size that barely moves over four months means this first tread behaves less like a response to demand strength and more like a market-fixed differential. Half-board versus breakfast-included, by contrast, has changed shape — from +40.9% in May and +44.4% in June to +28.3% in July and +27.5% in August — with the second step narrowing into the summer. The second step has the wider range of motion.
Note that this aggregation excludes ryokan. Oita is home to Beppu and Yufuin, and ryokan carry considerable weight in its accommodation market, but one night with two meals is the standard configuration at a ryokan, which makes the very idea of reconfiguring the product around the presence or absence of meals hard to apply. What is in view here is strictly the staircase design of hotel segments that hold room-only as their base product. How the ryokan and resort side of the same prefecture is selling is tracked from the inventory-pickup angle in Oita Ryokan vs Resorts: 61.6% and 78.5% OCC 45 Days Out for Sep 12.
Lined up across Kyushu’s seven prefectures — Oita’s breakfast premium is second from the bottom
Looking only within the prefecture, there is no way to judge whether the +10.6% breakfast premium at Oita’s business hotels is high or low. The table below lines up all seven Kyushu prefectures for the same August 2026 stays and the same segment.
| Prefecture | Breakfast-included vs room-only | Paired properties | Half-board vs breakfast-included | Paired properties |
|---|---|---|---|---|
| Fukuoka | +8.7% | 146 | +30.1% | 51 |
| Oita | +10.6% | 37 | +27.5% | 20 |
| Kumamoto | +12.1% | 45 | +31.9% | 17 |
| Kagoshima | +12.9% | 57 | +27.0% | 23 |
| Saga | +12.9% | 18 | +29.3% | 6 |
| Miyazaki | +13.0% | 34 | +24.4% | 19 |
| Nagasaki | +13.7% | 53 | +26.8% | 16 |
Source: Compiled by MetroEngines Research and the HotelBank Editorial Team (August 2026 stays, business hotels, same-property paired comparison)
The thinnest breakfast premium belongs to Fukuoka at +8.7% (146 paired properties), with Oita’s +10.6% the next lowest. Nagasaki at +13.7%, Miyazaki at +13.0%, Kagoshima at +12.9%, Saga at +12.9% and Kumamoto at +12.1% put the other five prefectures at 12% or above. Within Kyushu, Oita falls on the side that is not taking a thick first tread on breakfast.
Look at the second step — half-board versus breakfast-included — however, and the order reshuffles. Fukuoka at +30.1% and Kumamoto at +31.9% lead, while Oita’s +27.5% sits mid-pack. That Fukuoka, with the thinnest first step, ranks near the top on the second is telling: the structure of “breakfast thin and broad, rate captured at dinner” is not unique to Oita but a shape that tends to recur in areas with deep urban accommodation demand. Oita resembles the Fukuoka pattern in the thinness of its first step, yet does not take the Fukuoka-sized second step. That is the slack in its staircase design. Extending the same yardstick nationwide to see which prefectures earn most from food is a separate exercise; within Kyushu, the reading is that Oita carries a Fukuoka-like thin first step without a Fukuoka-like second step to make up for it.
Where does the room-only base sit — estimated settled ADR and occupancy today
A meal premium is a rate, and without seeing how the room-only price level that the rate is applied to is moving, the staircase cannot be designed. Tracking Oita’s estimated settled ADR as YoY comparisons between finalized months produces completely different pictures by segment.
Source: Compiled by MetroEngines Research and the HotelBank Editorial Team
Business hotels opened 2026 with January stays in the ¥7,400s, up +25.6% YoY (N=92 properties), after which the growth rate has narrowed month by month. April 2026 stays came in at +3.3%, May at +3.6% and June at +2.9% — around 3% — and the most recent finalized month, July 2026, slowed to the ¥6,100s and +1.1% YoY (N=91 properties). What the finalized figures show is a plateau after the climb.
City hotels are harsher still. January 2026 stays were +16.8% YoY (N=14 properties), but every month from February onward has run below the prior year, and July 2026 sinks to the ¥8,400s and −17.9% YoY (N=15 properties). The structure is one where a comparatively thick first step of +19.6% on breakfast (9 paired properties, reference value) is being placed on top of a room-only base that has itself fallen from last year. Earning the rate is not enough: if the base the rate is applied to thins out, the absolute total will not accumulate.
What about occupancy? For the most recent finalized month, July 2026, Oita’s estimated occupancy (based on OTA-listed inventory) averaged 86.5% for business hotels (78–83 properties) and 80.3% for city hotels (14–15 properties). Weighted by room count and broken out by day of week, business hotels peak on Saturday at 91.1% and bottom out on Monday at 82.7%. City hotels run 88.5% on Saturday against 72.4% on Monday — a wider day-of-week swing than business hotels.
| Segment (July 2026, Oita) | Mon | Tue | Wed | Thu | Fri | Sat | Sun |
|---|---|---|---|---|---|---|---|
| Business hotels, estimated OCC | 82.7% | 86.6% | 87.9% | 87.9% | 85.2% | 91.1% | 83.7% |
| City hotels, estimated OCC | 72.4% | 79.7% | 81.4% | 81.5% | 81.1% | 88.5% | 76.7% |
Source: Compiled by MetroEngines Research and the HotelBank Editorial Team (day-of-week figures weight daily observations within the month by room count)
On business-hotel weekdays, Tuesday through Thursday run high in the 86–88% range, with only Monday and Sunday dropping into the low 80s. Most weekdays being filled at high occupancy indicates a structure with little room to grow guest counts by discounting room-only rates — rate has to be built on the meal staircase instead. Conversely, city hotels’ Monday at 72.4% is a clear trough, and that is a day where demand generation is the question before any product-mix uplift.
How have August Saturdays filled — the late-stage pickup is small
For the three Saturdays in August 2026, the month covered by the meal-premium analysis, the booking curves for Oita’s business hotels (estimated occupancy from 45 days before the stay date through the most recent observation) are laid side by side.
Source: Compiled by MetroEngines Research and the HotelBank Editorial Team
At 45 days out, estimated occupancy stood at 74.2% for Saturday August 15, 76.4% for Saturday August 22 and 78.7% for Saturday August 29. At 30 days out the figures were 74.4%, 79.2% and 80.9% respectively, making the 15-day pickup from 45 to 30 days out +0.2pt for August 15, +2.8pt for August 22 and +2.2pt for August 29. In the most recent observations, August 15 stood at 78.9% at 8 days out, August 22 at 81.2% at 15 days out, and August 29 at 82.7% at 22 days out.
What this reads as is a shape where 74–79% has already accumulated by 45 days out, and the remaining window moves the number only a few points. A flat curve means the design is not one where late-stage inventory adjustments can move occupancy much. Turned around, it also means product mix and price can be settled before the 45-day mark. How to arrange meal-inclusive configurations belongs squarely to decisions in that “settled early” window. A procedure for operationalizing inventory pickup using only the three fixed checkpoints of 45 days out, 30 days out and the final stretch is also worth consulting in Okayama Booking Curves: 3 Checkpoints, Aug 8 Late-Surges +11.8pt.
For revenue managers running business and city hotels in Oita — implications and an action plan
(1) The first step size is fixed by the market. If you are going to move something, start with the second.
The business-hotel breakfast premium barely moves across four months: +10.0% for May 2026 stays, +11.5% for June, +11.2% for July, +10.6% for August. Opening that differential wider than the rest of the market at your property alone raises the risk of guests defaulting to room-only during comparison shopping. Half-board versus breakfast-included, meanwhile, has moved more than 13pt over the same four months, from +40.9% down to +27.5%, which reads as an area where design freedom remains within the market. Starting a step-size redesign with the second step is the natural move.
(2) First determine whether your staircase is the “Fukuoka type” or the “Nagasaki type.”
Lining up the seven Kyushu prefectures, Fukuoka’s thin +8.7% breakfast premium pairs with a thick +30.1% on half-board versus breakfast-included, while Nagasaki’s thick +13.7% breakfast pairs with a somewhat thin +26.8% second step. Oita sits at +10.6% on the first and +27.5% on the second — Fukuoka-like on the first step but without the Fukuoka-sized second. Plot your own current staircase on the same two axes and check whether it is stranded in a middling position that resembles neither type.
(3) Reflect in the pricing calendar that the base is moving in opposite directions by segment.
In finalized months of estimated settled ADR, business hotels are close to stalling at +1.1% YoY for July 2026 stays (N=91 properties), while city hotels fall well below the prior year at −17.9% for the same month (N=15 properties). Business hotels are in a phase of “room-only rate has topped out, so capture it through the uplift,” and city hotels in one of “base recovery comes first; uplift rates alone will not restore the total” — the priority order of the levers is reversed.
(4) The higher a property’s room-only mix, the more breakfast capture should be considered day by day.
July 2026 estimated occupancy runs high at 86–88% Tuesday through Thursday and 91.1% on Saturday for business hotels, leaving little room to grow guest counts by discounting room-only. On days already filled, steering guests toward breakfast-included is not a customer-acquisition measure but a way to raise rate at the same guest count. Conversely, in troughs such as city hotels’ Monday at 72.4%, building breakfast-included as an entry product to win guest count first is the realistic design. The same breakfast premium serves a different objective depending on the day of week.
| Time horizon | Action | Decision trigger | Objective |
|---|---|---|---|
| Today to this week | Line up your current room-only, breakfast-included and half-board settings for the same room type and calculate the uplift rates | If the first step in the business segment falls well below +10.6%, or the city segment departs from +19.6% (reference value) | Make visible where your staircase sits among the market’s types |
| Today to this week | Produce a room-only mix by day of week and separate out the high-occupancy Tuesday–Thursday and Saturday bands | If the room-only mix remains high on days where your occupancy is close to the July 2026 market level (business: 86–88% Tue–Thu, 91.1% Sat) | Identify the days where rate can be raised without resorting to discounting |
| Within two weeks | Revisit the second step (breakfast-included to half-board) and rework how dinner-inclusive configurations are presented | If your second step falls below Oita’s +27.5% and the gap to Fukuoka’s +30.1% and Kumamoto’s +31.9% is widening | Secure uplift in the area where design freedom remains |
| Within two weeks | Prepare stay propositions built from breakfast-included for trough days | If your Monday and Sunday occupancy dips in the same shape as the market troughs (city Monday 72.4%, business Monday 82.7%) | Build trough days up from the guest-count side |
| Looking to next month | Move the point at which product mix is finalized earlier than 45 days out | If pickup from 45 to 30 days out for the target date stays at market levels (+0.2 to +2.8pt across the three August Saturdays) and the late-stage gain is small | Shift decisions into the window where they actually bite |
| Looking to next month | Read the base separately by segment and put room-only rate recovery first for the city segment | If your settings for the month in question remain detached from the market’s estimated settled ADR (finalized July 2026: business in the ¥6,100s, city in the ¥8,400s) | Separate whether to work on the rate or on the base |
Source: Compiled by MetroEngines Research and the HotelBank Editorial Team
Combining the steps — which one moves the total?
The first step (breakfast-included versus room-only) and the second step (half-board versus breakfast-included) seen so far, multiplied together, give the total uplift from room-only to half-board. Total uplift = (1 + first step) × (1 + second step) − 1 is an identity by definition, so it can be calculated from the measured values already in this article without introducing any new observation. Applied to Oita’s business hotels for August 2026 stays, combining +10.6% and +27.5% yields +41.0%. That is 1.7pt above the directly measured +39.3% for half-board versus room-only, because the three series have different paired-property counts — 37, 20 and 15 — and therefore do not share a population. The combined figure is “the theoretical value if the same property took both steps”; the directly measured figure is “the observed value at the 15 properties that actually carry both products.” They are different in kind.
| Scenario | First step | Second step | Total uplift (combined) |
|---|---|---|---|
| Minimum configuration | +10.0% (May 2026 stays) | +27.5% (August 2026 stays) | +40.3% |
| Most recent (August 2026 stays) | +10.6% | +27.5% | +41.0% |
| Maximum configuration | +11.5% (June 2026 stays) | +44.4% (June 2026 stays) | +61.0% |
Source: Compiled by MetroEngines Research and the HotelBank Editorial Team
Taking both ends of the four-month measured range, the total uplift spans 20.7pt, from +40.3% to +61.0%. Separating out which step that spread comes from makes the picture clear. Hold the second step at +27.5% and move only the first across the full measured range (+10.0% to +11.5%), and the total uplift moves from +40.3% to +42.2% — just 1.9pt. Hold the first at +10.6% and move only the second from +27.5% to +44.4%, and the total moves from +41.0% to +59.7% — 18.7pt. The difference is roughly tenfold.
Judged purely on effect per point, the first step is actually the stronger of the two. The coefficient on the first step in the total uplift is (1 + second step) = 1.275, against (1 + first step) = 1.106 for the second step, so a single point applied to the first step does more for the total. The second step nonetheless drives the outcome because the first step’s measured range of motion over four months is a mere 1.5pt, while the second step moved 16.9pt. It is the width available to move, not the strength of the effect, that determines the conclusion. The judgment that a step-size redesign should begin with the second step follows from that asymmetry.
| First step \ second step | +24.4% (Miyazaki) | +26.8% (Nagasaki) | +27.5% (Oita) | +30.1% (Fukuoka) | +31.9% (Kumamoto) |
|---|---|---|---|---|---|
| +8.7%(Fukuoka) | +35.2% | +37.8% | +38.6% | +41.4% | +43.4% |
| +10.6%(Oita) | +37.6% | +40.2% | +41.0% | +43.9% | +45.9% |
| +12.1%(Kumamoto) | +39.5% | +42.1% | +42.9% | +45.8% | +47.9% |
| +12.9%(Kagoshima, Saga) | +40.4% | +43.2% | +43.9% | +46.9% | +48.9% |
| +13.7%(Nagasaki) | +41.4% | +44.2% | +45.0% | +47.9% | +50.0% |
Source: Compiled by MetroEngines Research and the HotelBank Editorial Team (both axes use only levels measured across the seven Kyushu prefectures; no extrapolation)
Computing the total uplift from the first-and-second-step combination each prefecture actually holds gives the order Kumamoto +47.9%, Saga +46.0%, Nagasaki +44.2%, Kagoshima +43.4%, Fukuoka +41.4%, Oita +41.0% and Miyazaki +40.6%. Oita ranks 6th of 7. This is the important part: on the first step alone Oita was merely second-thinnest, but combine the two steps and it is overtaken even by Fukuoka (+8.7%), which has the thinnest first step of the seven. Fukuoka recovers its thin first step through a +30.1% second step, whereas Oita sits mid-pack or below on both.
Reading the grid from Oita’s current position (+10.6% × +27.5% = +41.0%, the outlined cell), raising only the second step to Kumamoto’s +31.9% gives +45.9% (+4.9pt), while raising only the first step to Nagasaki’s +13.7% gives +45.0% (+4.0pt). Both destinations sit inside prefectural market levels, but the first step is a market-fixed differential that has barely moved in four months, which makes it hard to assume a single property can move it alone. As a practical option, the second step is the more realistic one.
Summary — three yardsticks for measuring the staircase
Breaking Oita’s meal premiums down by segment brings three points into focus.
First, the first step does not move; the second does. The business-hotel breakfast premium has been pinned inside a narrow +10.0% to +11.5% band from May 2026 stays through August, while half-board versus breakfast-included moved from +44.4% to +27.5%. It stands to reason that a step-size redesign should be considered starting from the second step, which has the wider range of motion.
Second, look at segments, not the prefectural average. The breakfast premium for Oita as a whole is +2.8% (59 paired properties), but business hotels alone show +10.6% and city hotels alone +19.6% (reference value). Using a blended figure as your property’s benchmark will lead the judgment astray.
Third, manage the rate and the base separately. In finalized months of estimated settled ADR, business hotels are at +1.1% YoY (July 2026 stays, N=91 properties) and city hotels at −17.9% (same month, N=15 properties) — the base points in opposite directions by segment. Even with the same uplift rate, a moving base changes the absolute total. Premium-rate management and room-only rate management need to run in parallel as separate metrics.
And the August Saturday curves — estimated occupancy accumulating to 74–79% by 45 days out, with only a few points added thereafter — demand that this decision be finished early. Staircase design sits in territory that late-stage inventory adjustments cannot recover.
About the data
| Item | Detail |
|---|---|
| Definition of estimated occupancy | Occupancy based on OTA-listed inventory = 100 − 100 × OTA-listed remaining rooms ÷ total rooms. It is an estimate based on how listed inventory is being absorbed on OTAs, and is defined differently from actual room occupancy (it runs higher). This article labels it “estimated OCC (based on OTA-listed inventory).” |
| Booking curve | Based on observations from 45 days before the stay date through the most recent reading. Coverage is Oita business hotels for August 15, 22 and 29, 2026 (all Saturdays), with 73–83 properties observed. |
| Definition of estimated settled ADR | A settled price level (pre-tax equivalent) inferred from OTA and other sales data (lowest-plan level × segment-specific coefficients, ensembled across multiple channels). Past months are finalized values; the current and future months are estimates based on sales conditions at the time. Median error against published operating results is 6.6%. This article uses only finalized months (January 2025 through July 2026), and every YoY comparison is between finalized values. |
| Definition of meal premium | A value calculated as the ratio between sales conditions within the same property that differ only in the meal plan (monthly aggregation standardized to 2 guests per room). It is not a difference of cross-property averages. This article treats rates only and does not address absolute price levels. Ryokan are excluded from this aggregation. |
| Breakdown of N | Meal premiums (August 2026 stays, Oita): business hotels — breakfast-included vs room-only 37 properties, half-board vs breakfast-included 20 properties, half-board vs room-only 15 properties; city hotels — breakfast-included vs room-only 9 properties, half-board-related 5 properties; all segments 59 properties. Paired-property counts for the Kyushu seven-prefecture comparison appear in the table in the body. Estimated settled ADR: 91 business hotels and 15 city hotels (both for the finalized month of July 2026). Estimated OCC (July 2026): 78–83 business hotels and 14–15 city hotels. |
| Treatment of reference values | Series with fewer than 10 paired properties (city hotels’ breakfast-included vs room-only at 9 properties, half-board-related at 5 properties, and Saga’s half-board vs breakfast-included at 6 properties) are presented as reference values and are not used as the basis for definitive conclusions. |
| Data as of | Data as of August 8, 2026. Sales conditions and inventory change daily, so the figures in this article are a snapshot at the time of retrieval. |
Source: Compiled by MetroEngines Research and the HotelBank Editorial Team
References and sources
■ Data sources
Publicly listed sales information from accommodation booking sites, collected and aggregated by MetroEngines Research & Consulting. Meal premiums are same-property paired comparisons for Oita and the six other Kyushu prefectures (2 guests per room, May–August 2026 stays, by segment); estimated settled ADR is the monthly series for business and city hotels in Oita (finalized months from January 2025 through July 2026); estimated occupancy covers daily observations for July 2026 and lead-time observations for August 15, 22 and 29, 2026. Data as of August 8, 2026.
■ Calculation assumptions
“Total uplift” is calculated using the identity Total uplift = (1 + first step) × (1 + second step) − 1, with no inputs beyond the measured premium rates presented in the body. The five row levels and five column levels of the sensitivity grid are all values measured across the seven Kyushu prefectures for August 2026 stays; no extrapolation or interpolation was performed. Day-of-week estimated occupancy weights daily observations within the month by room count (100 − 100 × Σ remaining rooms ÷ Σ total rooms). All YoY comparisons are between finalized months.
■ Limitations and caveats
The three meal-premium series have different paired-property counts (first step 37 properties, second step 20 properties, room-only vs half-board 15 properties), so the combined total uplift of +41.0% and the directly measured +39.3% do not share a population, producing a 1.7pt gap. The combined figure is theoretical, not measured. Series with fewer than 10 paired properties (city hotels’ breakfast-included vs room-only at 9 properties and half-board-related at 5 properties, and Saga’s second step at 6 properties) are reference values and are not used as the basis for assertions. The sensitivity grid is a recombination of each prefecture’s measured levels and does not indicate that any particular step size is achievable. Ryokan are excluded from this aggregation. Occupancy is an estimate based on OTA-listed inventory and runs higher than actual room occupancy. The number of properties observed varies with daily listing conditions.
Related reading
- Oita Ryokan vs Resorts: 61.6% and 78.5% OCC 45 Days Out for Sep 12
- Obon T-7: Kyushu’s 31.7pt Gap — Fukuoka 73.0%, Kagoshima 41.3%
- Fukuoka Settled ADR +10.9% in H1 2026 While Osaka Falls 32.8% in June
- Aichi Settled ADR 18 Months: City Swings 25.0pt, Business 14.0pt
- Kyoto Hotel ADR Falls YoY in June 2026: City -14.6%, Business -9.8%
- Okayama Booking Curves: 3 Checkpoints, Aug 8 Late-Surges +11.8pt
- Hokkaido City Hotels: Only Aug 15 Trails at 78.7% OCC, 45 Days Out