

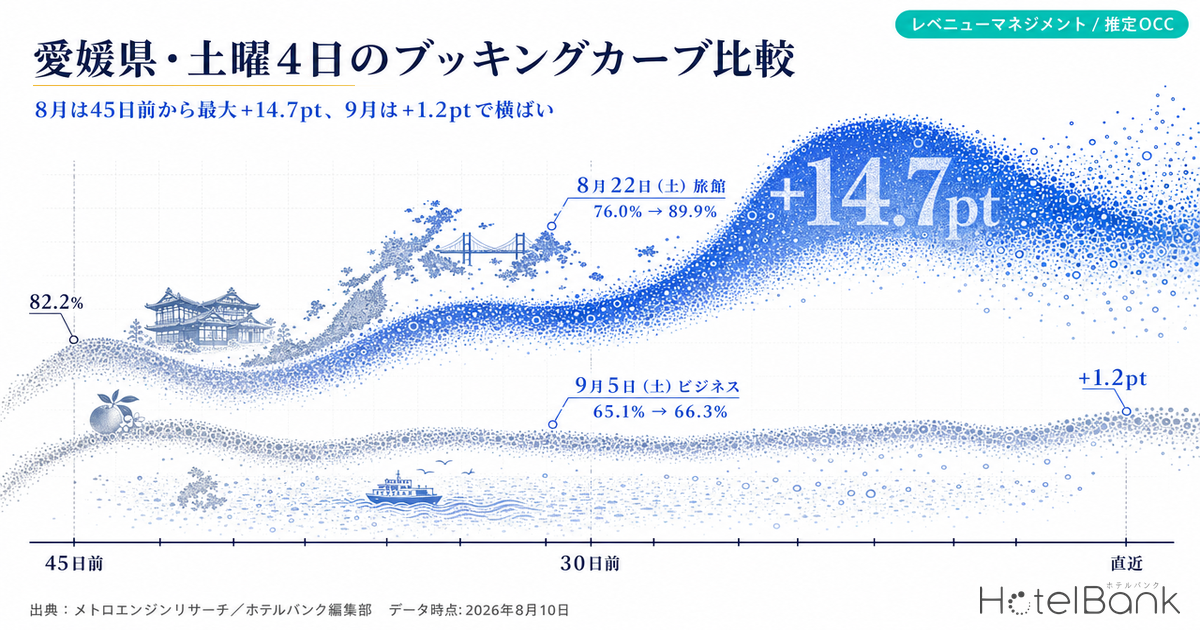
Lining up four Saturdays in Ehime Prefecture from 45 days before the stay date through the latest observation, the shape of the curve splits clearly between August and September. For Saturday, August 22, ryokan moved from an estimated OCC of 76.0% at 45 days out (observed as of July 8, 2026, OTA-listed inventory basis) to 89.9% at the latest observation (13 days out), a gain of +13.9pt; ryokan for Saturday, August 15 went from 69.6% to 84.3%, +14.7pt. Both accumulated a wide band after the 45-day mark. By contrast, business hotels for Saturday, September 5 stood at 65.1% at 45 days out against 66.3% at the latest observation (27 days out), only +1.2pt, and ryokan managed just 70.9% to 72.4%, +1.5pt. Even within the same “Saturday,” days on which the 45-day-out cross-section has essentially carried through unchanged sit side by side with days that filled up rapidly from that point onward.
Scope: Ehime Prefecture (business hotels N=91 properties / 8,660 rooms; city hotels N=22 properties / 3,373 rooms; ryokan N=67 properties / 2,028 rooms; resort hotels N=7 properties / 134 rooms). This article does not use price metrics; occupancy is expressed solely as an estimate based on OTA-listed inventory (estimated OCC). Definitions appear at the end of the article. Data as of August 10, 2026.
- — Even among Saturdays, the pickup after 45 days out ranges from +1.2pt to +14.7pt — a spread of more than tenfold. Ryokan on August 15 went 69.6% to 84.3% (+14.7pt); business hotels on September 5 went 65.1% to 66.3% (+1.2pt).
- — The starting point at 45 days out spans roughly 17pt, from 65.1% to 82.2%. The highest is city hotels on August 22 at 82.2%; the lowest is business hotels on September 5 at 65.1% (both measured cross-sections in 2026).
- — The center of gravity of the curve differs by property type. On the August 22 cross-section, city hotels are already high at 82.2% at 45 days out and add +7.3pt thereafter, while ryokan build +13.9pt from 76.0%, loading the back half.
- — Sellout rates differ by an order of magnitude between August and September. On the August 22 cross-section the latest values are ryokan 32.8% and business hotels 25.3%; on the September 5 cross-section, business hotels 5.5% and ryokan 9.0%.
- — In July 2026 actuals, Saturday was the strongest day for all three property types (business 88.1%, city 92.5%, ryokan 93.8%). The widest day-of-week range was business hotels at 11.9pt.
August 22 (Sat) — Around 80% at 45 Days Out, Then All Three Types Add More
Start with the Saturday after Obon, the cross-section for August 22, 2026. Estimated OCC at 45 days out (observed as of July 8, 2026) was 76.8% for business hotels (85 properties observed), 82.2% for city hotels (21 observed), and 76.0% for ryokan (61 observed). At 30 days out, business hotels were at 80.8% (86 observed), city hotels 86.3% (21 observed), and ryokan 83.4% (61 observed). And at the latest observation, 13 days out (August 9, 2026), business hotels reached 86.5% (91 observed), city hotels 89.5% (22 observed), and ryokan 89.9% (67 observed).
Pickup from 45 days out to the latest observation was +9.7pt for business hotels, +7.3pt for city hotels, and +13.9pt for ryokan. Ryokan grew the most, and the composition of that growth was evenly split between halves: +7.4pt from 45 days out to 30 days out, and +6.5pt from 30 days out to the latest observation. City hotels, by contrast, added +4.1pt from 45 to 30 days out and +3.2pt from 30 days out to the latest, and their level at 45 days out (82.2%) was already the highest of the three types to begin with. Ehime’s city hotels can be read as the “on a high level early, small last-minute pickup” shape, and ryokan as the “roughly level with business hotels at 45 days out, but continuing to accumulate right to the end” shape.
The share of properties for which no listed inventory can be confirmed (sellout rate, estimated) backs up the same gap. On the August 22 cross-section, the latest values are ryokan 32.8%, business hotels 25.3%, and city hotels 18.2%. Among ryokan, roughly one third of the 67 properties observed show no confirmable listed inventory as of the latest observation. The corresponding figures at 45 days out were ryokan 19.4%, business hotels 18.7%, and city hotels 27.3%, so ryokan and business hotels accumulated properties moving to the sold-out side after the 45-day mark, while city hotels moved in the opposite direction, declining toward the latest observation. A structure in which sellout rates diverge this far between property types is not unique to Ehime: our Hyogo booking curve analysis observed the same pattern, with ryokan ranking last on occupancy while reaching a sellout rate of 28.4%.
Source: Compiled by MetroEngines Research and the HotelBank Editorial Team.
September 5 (Sat) — The Level at 45 Days Out Has Barely Moved
For the same day of the week, the picture on September 5 is entirely different. Estimated OCC at 45 days out (observed as of July 22, 2026) was 65.1% for business hotels (90 properties observed), 73.5% for city hotels (21 observed), and 70.9% for ryokan (57 observed). At 30 days out, business hotels were at 66.3% (91 observed), city hotels 79.5% (22 observed), and ryokan 73.8% (64 observed). At the latest observation, 27 days out (August 9, 2026), business hotels stood at 66.3% (91 observed), city hotels 80.6% (22 observed), and ryokan 72.4% (67 observed).
Pickup from 45 days out to the latest observation was +1.2pt for business hotels, +1.5pt for ryokan, and +7.1pt for city hotels. For business hotels the 30-day-out and latest readings are identical (66.3%), meaning that over roughly one month the drawdown of listed inventory has hardly moved at all. Ryokan likewise went from 73.8% at 30 days out to 72.4% at the latest observation — flat to slightly lower — which reads as a state in which additions to listed inventory and its drawdown are offsetting each other. City hotels alone moved, gaining +6.0pt from 45 to 30 days out, then flattening out at +1.1pt after that.
Sellout rates are an order of magnitude apart from August as well. On the September 5 cross-section, the latest values are business hotels 5.5%, ryokan 9.0%, and city hotels 18.2%. Compared with the August 22 cross-section (business hotels 25.3%, ryokan 32.8%), September 5 is a cross-section on which an overwhelmingly larger number of properties still have confirmable listed inventory. We limit ourselves to describing the current state at 27 days before the stay date, but at minimum, the observation that “the market as a whole has barely moved from how it looked at 45 days out” is shared by two of the three property types.
Source: Compiled by MetroEngines Research and the HotelBank Editorial Team.
Four Saturdays x Three Property Types at Fixed Checkpoints — 45 Days Out / 30 Days Out / Latest
All four comparison days are Saturdays (August 15, August 22, September 5, and September 12, 2026). Holding the day of the week constant and cutting the data at three fixed checkpoints — 45 days out, 30 days out, and the latest observation — produces the table below. The number of properties observed is shown alongside each checkpoint as a measured value. Note that for the September 12 cross-section the latest observation is 34 days out (August 9, 2026), and the 30-day-out cross-section has not yet been observed, so those cells are left blank.
| Stay date (Sat) | Property type | 45 days out Est. OCC (observed) |
30 days out Est. OCC (observed) |
Latest Est. OCC (observed) |
45 days out to latest | Latest sellout rate |
|---|---|---|---|---|---|---|
| Aug 15 latest obs. 6 days out | Business | 69.4% (86) | 74.5% (86) | 82.9% (91) | +13.5pt | 19.8% |
| City | 79.4% (19) | 83.1% (19) | 90.2% (22) | +10.8pt | 22.7% | |
| Ryokan | 69.6% (54) | 75.8% (61) | 84.3% (67) | +14.7pt | 34.3% | |
| Aug 22 latest obs. 13 days out | Business | 76.8% (85) | 80.8% (86) | 86.5% (91) | +9.7pt | 25.3% |
| City | 82.2% (21) | 86.3% (21) | 89.5% (22) | +7.3pt | 18.2% | |
| Ryokan | 76.0% (61) | 83.4% (61) | 89.9% (67) | +13.9pt | 32.8% | |
| Sep 5 latest obs. 27 days out | Business | 65.1% (90) | 66.3% (91) | 66.3% (91) | +1.2pt | 5.5% |
| City | 73.5% (21) | 79.5% (22) | 80.6% (22) | +7.1pt | 18.2% | |
| Ryokan | 70.9% (57) | 73.8% (64) | 72.4% (67) | +1.5pt | 9.0% | |
| Sep 12 latest obs. 34 days out | Business | 67.5% (90) | — | 70.0% (91) | +2.5pt | 9.9% |
| City | 79.2% (21) | — | 83.2% (22) | +4.0pt | 22.7% | |
| Ryokan | 80.1% (66) | — | 81.4% (65) | +1.3pt | 19.4% |
Source: Compiled by MetroEngines Research and the HotelBank Editorial Team.
The number of properties observed varies by stay date and by days remaining. Across the three checkpoints in the table above, business hotels fall in a range of 85 to 91 properties, city hotels 19 to 22, and ryokan 54 to 67. Across the full observation window including points outside the fixed checkpoints (from 45 days before the stay date to the latest observation), the ranges are 15 to 91 properties for business hotels, 8 to 22 for city hotels, and 2 to 67 for ryokan; in every case the minimum comes from the 44-days-out cross-section of the August 15 stay date (July 2, 2026). All other cross-sections run at 82 to 91 properties for business hotels, 19 to 22 for city hotels, and 53 to 67 for ryokan.
Three points can be drawn from this table. First, the 45-days-out cross-section itself differs greatly from day to day. Of the 12 cross-sections across three property types, the highest reading at 45 days out is city hotels on August 22 at 82.2%, followed by ryokan on September 12 at 80.1%, and the lowest is business hotels on September 5 at 65.1%. That is a spread of roughly 17pt. Second, the pickup band also differs by more than tenfold from day to day. The maximum is ryokan on August 15 at +14.7pt, the minimum business hotels on September 5 at +1.2pt. Third, ryokan for September 12 were already at 80.1% at the 45-day mark — 9.2pt above the 70.9% of ryokan for September 5, another Saturday in the same month. September Saturdays are not uniformly quiet. The idea of turning booking pace into an operating framework using just these three checkpoints — 45 days out, 30 days out, and last minute — is also tested in our measured Okayama framework for 45 days out, 30 days out, and last minute.
Note that resort hotels in Ehime Prefecture number N=7 properties and 134 rooms (5 to 7 properties observed), a small base, so they are not treated as a main subject in this article. For reference: on the August 22 cross-section, 19.4% at 45 days out (5 observed), 46.3% at 30 days out (5 observed), and 67.2% at the latest observation (7 observed); on the September 5 cross-section, 11.9% at 45 days out (5 observed), 23.1% at 30 days out (7 observed), and 24.6% at the latest observation (7 observed). Because the weight of each individual property is large, these are not treated as an area-level trend.
Day-of-Week Patterns in the Most Recent Completed Month — Estimated OCC for July 2026
To check just how strong a day Saturday is, we averaged the daily actual estimated OCC for July 2026 (31 days), the most recent completed month, by day of the week. Ehime Prefecture’s July averages are 82.5% for business hotels (89 to 91 properties observed), 88.9% for city hotels (21 to 22 observed), and 88.5% for ryokan (52 to 66 observed).
Source: Compiled by MetroEngines Research and the HotelBank Editorial Team.
Saturday is the highest day for all three property types: business hotels 88.1%, city hotels 92.5%, ryokan 93.8%. The lowest day within the month is Sunday for business hotels at 76.2%, Sunday for city hotels at 85.6%, and Wednesday for ryokan at 85.3%. The day-of-week range (highest minus lowest) is 11.9pt for business hotels, 6.9pt for city hotels, and 8.5pt for ryokan, making business hotels the most volatile across days of the week. Business hotels run high on the midweek days (Tuesday 85.1%, Wednesday 85.3%, Thursday 84.5%) and drop on Friday at 79.5% and Sunday at 76.2% — a shape that clearly retains the signature of business-travel demand. Ryokan show the reverse, with Friday 90.0%, Saturday 93.8%, and Sunday 90.0% forming a high weekend trio and the weekdays forming the trough. That Ehime’s business hotels and city hotels have Saturday as their strongest day as of July, and yet the 45-days-out cross-section for those Saturdays falls to 65.1% to 73.5% once September arrives, is the starting point of this article.
For Revenue Managers Running Business Hotels, City Hotels, and Ryokan in Ehime — Implications and an Action Plan
(1) “The level at 45 days out” and “the pickup after 45 days out” are worth holding as separate metrics. Across the 12 cross-sections here, the highest reading at 45 days out — city hotels on August 22 at 82.2% — and the lowest — business hotels on September 5 at 65.1% — are roughly 17pt apart. Meanwhile the pickup from 45 days out to the latest observation ranges from +1.2pt to +14.7pt, a spread of more than tenfold. When benchmarking your own booking pace against the market, looking only at “where we sit at 45 days out” risks confusing days that build in the back half with days that do not. There is room to manage both side by side.
(2) The meaning of the last-minute phase changes between the August 22 pattern and the September 5 pattern. On August 22 all three property types built +7.3 to +13.9pt from 45 days out to the latest observation, reaching 86.5% to 89.9% at the latest reading. On September 5, by contrast, business hotels were identical at 66.3% at 30 days out and 66.3% at the latest, and ryokan were flat to slightly down from 73.8% to 72.4%. The former reads as a phase in which the whole market is being lifted; the latter as a phase in which the market does not move while only the days remaining tick down. If your own property’s equivalent date is taking the latter shape, it is worth considering a plan that does not assume a tailwind from the market.
(3) The center of gravity of the curve differs by property type. Ehime’s city hotels are high from an early stage on the August 22 cross-section at 82.2% at 45 days out, and their subsequent pickup stops at +7.3pt. Ryokan start at 76.0% at 45 days out, essentially level with business hotels (76.8%), yet build +13.9pt to reach 89.9% at the latest observation. The ryokan center of gravity sits in the back half. Even within the same area, there is value in viewing the competitive set separately by property type.
(4) The gap in sellout rates can serve as a yardstick for how tight the remaining inventory is. On the August 22 cross-section, ryokan at 32.8% and business hotels at 25.3% show no confirmable listed inventory at the latest observation, whereas on the September 5 cross-section that figure stops at 5.5% for business hotels and 9.0% for ryokan. Even for the same Saturday, the volume of inventory left in the market is completely different. Before judging your own remaining rooms as “many” or “few,” one workable practice is to place the market-side sellout rate for that date alongside them.
The following are action ideas by time horizon, anchored to this article’s data date (August 10, 2026). They do not guarantee results, and each is offered only as an entry point for consideration.
| Time horizon | Action | Decision trigger (figures from this article) | Objective |
|---|---|---|---|
| Today to this week | Check your own remaining rooms for August 15 and August 22 (both Saturdays) alongside the market’s latest level | The market’s latest estimated OCC is 82.9% / 86.5% for business hotels, 90.2% / 89.5% for city hotels, and 84.3% / 89.9% for ryokan. If your property is running well below these with rooms left | Decide whether last-minute clearing of remaining inventory is needed, factoring in how tight the market is |
| Review your own pace for September 5 (Sat) on the assumption that it is not moving | The market’s business hotels are identical at 66.3% at 30 days out and 66.3% at the latest observation 27 days out, and ryokan went 73.8% to 72.4%. If your property has stalled in the same way | Switch to a premise of moving the number through your own actions rather than counting on a natural lift from the market | |
| Within two weeks | Plan September 12 (Sat) separately from September 5 | At 45 days out, ryokan are at 80.1% for September 12 versus 70.9% for September 5, and city hotels 79.2% versus 73.5% — gaps of 9.2pt and 5.7pt between Saturdays in the same month | Stop treating “September Saturdays” as a single bucket and reflect the different starting points date by date |
| Revisit day-of-week inventory allocation using July’s actual day-of-week pattern | July’s day-of-week range is 11.9pt for business hotels (Sat 88.1% to Sun 76.2%), 6.9pt for city hotels, and 8.5pt for ryokan. If your own day-of-week swing is more extreme than this | Bring how you fill trough days and hold back peak days closer to a swing appropriate for your property type | |
| Toward next month | Redefine your own “45-days-out checkpoint” by property type | Pickup from 45 days out to the latest observation is +7.3pt for city hotels (August 22) against +13.9pt for ryokan. The center of gravity of the curve differs by property type | Reset the 45-days-out target to a level commensurate with how much your property type adds in the back half |
| Create a weekly slot for monitoring sellout rates | The latest readings are ryokan 32.8% and business hotels 25.3% on the August 22 cross-section, versus business hotels 5.5% and ryokan 9.0% on the September 5 cross-section. Once that gap starts to close | Add the timing at which market-side remaining inventory starts to shrink to your own decision inputs |
Source: Compiled by MetroEngines Research and the HotelBank Editorial Team.
Reading the Landing Range from the 45-Days-Out Level x the Pickup Band — Applying the Measured Ranges
So far we have obtained two measured ranges: the starting point at 45 days out (65.1% to 82.2%) and the pickup band after 45 days out (+1.2pt to +14.7pt). Combining the two lets us mechanically lay out, for a cross-section such as Saturday, September 12 where the latest observation has only reached 34 days out, “which level would be reached if each of the pickup bands actually observed in this article were to occur.” All of the following is not a forecast, but simple addition between measured values from this article; no new estimation model is used.
| Pickup band applied | Where that band comes from (measured in this article) | Business 45 days out 67.5% |
City 45 days out 79.2% |
Ryokan 45 days out 80.1% |
|---|---|---|---|---|
| Pessimistic: +1.2pt | Sep 5 business hotels, 45 days out to latest (the minimum in this article) | 68.7% | 80.4% | 81.3% |
| Median: +7.3pt | Aug 22 city hotels, 45 days out to latest | 74.8% | 86.5% | 87.4% |
| Optimistic: +14.7pt | Aug 15 ryokan, 45 days out to latest (the maximum in this article) | 82.2% | 93.9% | 94.8% |
Business hotels span 68.7% pessimistic to 82.2% optimistic, a width of 13.5pt; city hotels 80.4% to 93.9%; ryokan 81.3% to 94.8%. Which band actually occurs moves the landing point by 13.5pt, so an operating practice that decides “enough / not enough” from the 45-days-out level alone carries an error of that width.
More generally, laying out every combination of the 45-days-out level and the pickup band gives the following. Rows are the five 45-days-out levels observed in this article, columns the five pickup bands observed in this article, and each cell is the simple sum of the two.
| Est. OCC at 45 days out / pickup band | +1.2pt Sep 5 business | +2.5pt Sep 12 business | +7.3pt Aug 22 city | +10.8pt Aug 15 city | +14.7pt Aug 15 ryokan |
|---|---|---|---|---|---|
| 65.1% Sep 5 business | 66.3% | 67.6% | 72.4% | 75.9% | 79.8% |
| 69.6% Aug 15 ryokan | 70.8% | 72.1% | 76.9% | 80.4% | 84.3% |
| 73.5% Sep 5 city | 74.7% | 76.0% | 80.8% | 84.3% | 88.2% |
| 79.2% Sep 12 city | 80.4% | 81.7% | 86.5% | 90.0% | 93.9% |
| 82.2% Aug 22 city | 83.4% | 84.7% | 89.5% | 93.0% | 96.9% |
The bottom right (high at 45 days out and a large pickup as well) reaches 96.9%, while the top left (low at 45 days out with a small pickup) stops at 66.3%. Even under the same condition of a Saturday in Ehime Prefecture, the top left and bottom right of this table are more than 30pt apart. Deciding first which row your own 45-days-out actuals sit in, then overlaying which column your own historical pickup band most resembles, reveals the width of landing points you should be prepared for on that date.
Summary — Three Yardsticks for Reading Ehime’s Saturdays
Yardstick 1: The starting point at 45 days out. Across the 12 cross-sections here, the spread ran roughly 17pt, from 65.1% (September 5 business hotels) to 82.2% (August 22 city hotels). Even for the same day of the week, the same area, and the same property type, the level at 45 days out is a different animal from date to date. Simply matching your own 45-days-out actuals against the market’s cross-section for that same date is enough to locate where that date stands.
Yardstick 2: The pickup band after 45 days out. The spread ran more than tenfold, from +1.2pt (September 5 business hotels) to +14.7pt (August 15 ryokan). On days when pickup occurs, the value of remaining inventory shifts to the back half; on days when it does not, the judgment made at 45 days out tends to become the result as-is. Distinguishing which shape you are dealing with is what separates one last-minute plan from another.
Yardstick 3: The volume of remaining inventory seen through the sellout rate. On the August 22 cross-section the latest readings are ryokan 32.8%, business hotels 25.3%, and city hotels 18.2%; on the September 5 cross-section, business hotels 5.5%, ryokan 9.0%, and city hotels 18.2%. Placing “how much inventory is left in the market” alongside the occupancy level, rather than the level alone, lets you put your own remaining rooms in relative terms. Simply looking at these three in the same format every week should change how you approach Saturdays from September onward.
About the Data
| Item | Detail |
|---|---|
| Definition of estimated OCC | Occupancy on an OTA-listed inventory basis = 100 − 100 × rooms remaining listed on OTAs ÷ total rooms. It is an estimate based on the drawdown of inventory sold on OTAs, and is defined differently from actual room occupancy (it reads higher). This article denotes it as “estimated OCC (OTA-listed inventory basis).” |
| Booking curve | Based on observations from 45 days before the stay date through the latest observation. The scope is four stay dates: August 15, August 22, September 5, and September 12, 2026 (all Saturdays). |
| Sellout rate | The estimated share of properties for which no listed inventory can be confirmed on OTAs and similar channels for the stay date in question. The denominator is the number of properties observed. |
| Estimated OCC by day of week | Daily actuals for July 2026 (a completed month, 31 days) averaged by day of the week. Mon 4 days, Tue 4, Wed 5, Thu 5, Fri 5, Sat 4, Sun 4. |
| Definition of estimated settled ADR | This article does not use price metrics, but the definition of estimated settled ADR as used across our publications is as follows. A settled price level (tax-exclusive equivalent) estimated from OTA and similar sales data (lowest-plan levels x property-type coefficients, ensembled across multiple channels). Past months are confirmed values; the current and future months are estimates based on current sales conditions. Median error versus published operating results is 6.6%. |
| Breakdown of the N= scope | Ehime Prefecture (internal area classification) — business hotels N=91 properties / 8,660 rooms; city hotels N=22 properties / 3,373 rooms; ryokan N=67 properties / 2,028 rooms; resort hotels N=7 properties / 134 rooms. The number of properties actually observed varies by cross-section: across the three checkpoints, business 85 to 91, city 19 to 22, ryokan 54 to 67; across the full observation window, business 15 to 91, city 8 to 22, ryokan 2 to 67, resort 5 to 7. |
| Data date | Data as of August 10, 2026 (latest observation August 9, 2026). Sales conditions and inventory change daily, so the figures in this article are a snapshot as of the time of retrieval. |
Source: Compiled by MetroEngines Research and the HotelBank Editorial Team.
■ Data source
Daily observation data on lodging inventory collected and aggregated by MetroEngines Research & Consulting, with a population of 281 properties and 14,999 rooms in Ehime Prefecture. This article covers 91 business hotels / 8,660 rooms, 22 city hotels / 3,373 rooms, and 67 ryokan / 2,028 rooms within that population, and uses observations from 45 days out onward for the stay dates August 15, August 22, September 5, and September 12, 2026 (all Saturdays), together with daily actuals for July 2026 (31 days). Data as of August 10, 2026; latest observation August 9, 2026.
■ Calculation assumptions
Estimated OCC is calculated as “100 − 100 × rooms remaining listed on OTAs ÷ total rooms,” with the denominator being total rooms for each property type and the numerator the rooms remaining listed at each observation point. The sellout rate uses the number of properties observed at each checkpoint as its denominator. Day-of-week values are a simple average of daily actuals for July 2026 (Mon 4 days, Tue 4, Wed 5, Thu 5, Fri 5, Sat 4, Sun 4). The landing-range table and the sensitivity table are built solely from simple addition of the 45-days-out levels and pickup bands measured in this article; no forecasting model and no elasticity assumptions are applied.
■ Limitations and caveats
(1) Estimated OCC is an estimate based on the drawdown of inventory listed on OTAs and similar channels, and reads higher than actual room occupancy. Read it as a relative comparison between figures on the same definition, not as an absolute level. (2) The number of properties observed varies by checkpoint, ranging across the three checkpoints from 85 to 91 for business hotels, 19 to 22 for city hotels, and 54 to 67 for ryokan. In intervals where the number of observed properties rose or fell, the level may be moved by variation on the denominator side rather than by a change in demand. (3) Resort hotels are thin at 4 to 7 properties observed, and because the weight of each individual property is large they are not treated as an area-level trend. (4) For the September 12 cross-section the latest observation is 34 days out, and the 30-days-out cross-section has not yet been observed. (5) This article does not use price metrics.
Related Reading
- Okayama Booking Curves: 3 Checkpoints, Aug 8 Late-Surges +11.8pt
- Tochigi Booking Curves by Type: Resort 81.1% at T-45, Only +2.6pt Left
- Hyogo Booking Curves: 3.6x Pickup Gap, Ryokan Sellout Rate 28.4%
- Hokkaido City Hotels: Only Aug 15 Trails at 78.7% OCC, 45 Days Out
- Saitama Business Hotels: Sat 77.2% vs Sun 70.1%, Gap Widens to 11pt
- Oita Ryokan vs Resorts: 61.6% and 78.5% OCC 45 Days Out for Sep 12