

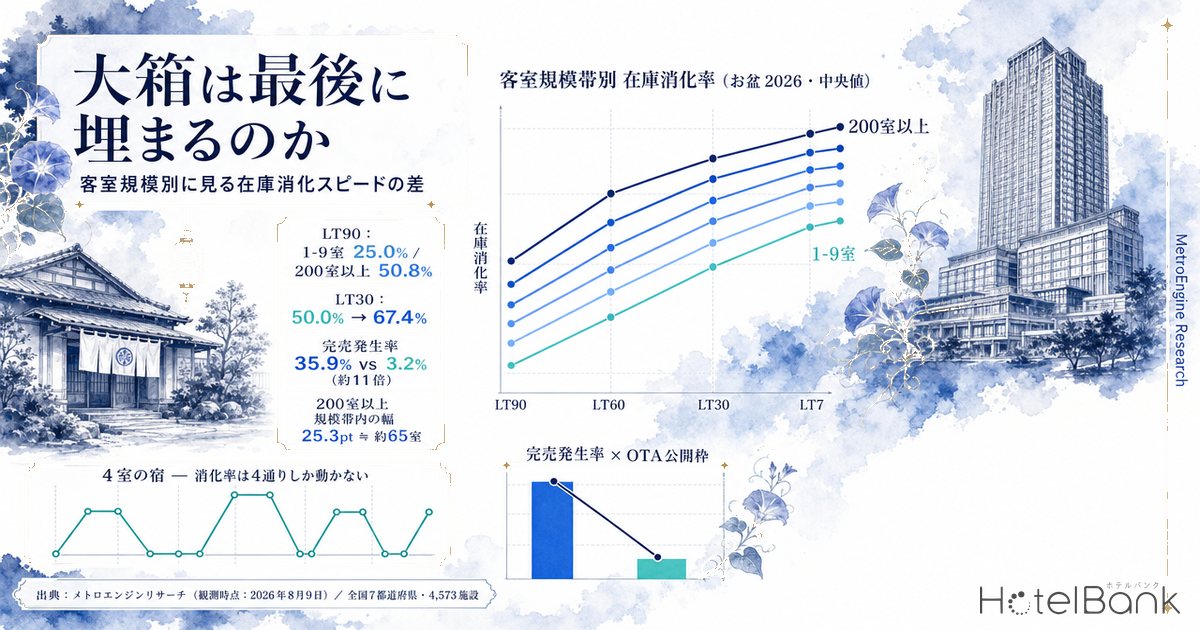
Large hotels with more than 200 rooms are slow to fill up — this is a rule of thumb long repeated in the industry. A small property sells a handful of rooms and it is full; a big box carries inventory right to the end. It sounds intuitively correct. Yet when you measure it on the same check-in date at the same lead-time cut, the conclusion reverses.
This article takes Obon 2026 (August 13-16) as its primary subject and aggregates the movement of room inventory at 4,573 properties across seven prefectures, split into six tiers by room count. It then places the July weekends and Golden Week alongside as control periods, to test whether the relationship between size and inventory absorption reproduces across seasons. To state the conclusion first: the inventory absorption rate rises monotonically with room count. The reason it nonetheless looks as though “small properties fill first” is something else entirely.
Metric Definitions Used in This Article
- LT (lead time): the number of days until the check-in date. LT90 means 90 days out, LT0 means the day itself. This article uses only observations within LT90.
- Inventory absorption rate: the share of a property’s total room count that has been absorbed out of the inventory offered on OTAs and similar channels. An estimate calculated as (total rooms − remaining rooms) ÷ total rooms. Values for individual properties are not disclosed; only the median for each size tier is used. This is an estimate based on how inventory listed on OTAs and similar channels is absorbed, and differs from a property’s actual overall occupancy rate.
- Early sellout LT: the lead time at which remaining rooms first reached zero after inventory had been opened for sale. A larger value means the property sold out at an earlier point.
- OTA-listed allocation: the maximum inventory observable on OTAs and similar channels during the observation period, as a share of total rooms. This article aggregates only properties whose listed allocation is at least 30% of total rooms.
- Data source: MetroEngines Research (observed as of August 9, 2026)
- — A 25.8-point gap at LT90 (roughly three months out) — the median inventory absorption rate is 25.0% for 1-9 rooms and 50.8% for 200 rooms and above. “Big boxes fill last” is not supported at the level of the median.
- — The incidence of zero remaining rooms differs by about 11x — the share of properties that recorded zero remaining rooms during the four days of Obon is 35.9% for 1-9 rooms against 3.2% for 200 rooms and above. The same data yields a picture that looks exactly opposite to the absorption rate.
- — A substantial part of “selling out” is an artifact of inventory granularity — for 1-9 rooms, the median OTA-listed allocation is 3 rooms and the latest remaining count is 1 room. Properties of 200 rooms and above list a median of 148 rooms and still have 57 remaining at the latest cut. A small denominator makes a sellout probabilistically easy to trigger.
- — The spread within a size tier is the larger one — the maximum difference between size-tier medians at LT30 is 17.4 points. Within the 200-rooms-and-above tier, however, the gap between the top 25% and the bottom 25% is worth about 65 rooms of absorption, and about 37 rooms even in the 100-199 tier.
- — The same direction in all seven prefectures — 200 rooms and above exceeds 1-9 rooms everywhere. Levels are high in Hokkaido at 74.4% and Okinawa at 73.6%, and relatively low in Osaka at 61.1% and Kanagawa at 64.1% (LT30, median).
The larger the property, the further absorption has progressed at every lead-time cut
Start with the overall picture. Covering the four days of Obon (August 13-16), accommodation properties in seven prefectures were divided into six tiers by room count, and the median inventory absorption rate was calculated at each of the LT90, LT60, LT30, LT14, LT7 and latest cuts. The aggregation covers 14,537 property-days and 4,573 distinct properties.
The result was unambiguous. At LT90 (mid-May), the median absorption rate for small properties of 1-9 rooms is 25.0%, against 50.8% for large properties of 200 rooms and above — a gap of 25.8 points. At LT30 it is 50.0% against 67.4%, and at the latest observation 66.7% against 79.7%. The relationship in which the absorption rate rises with size holds at every cut. (There are cuts where 60-99 rooms sits marginally below 30-59 rooms, but the ordering between the smallest and the largest tier never reverses at any cut.)
Source: MetroEngines Research; compiled by the HotelBank Editorial Team
The rule of thumb that big boxes fill last is not supported, at least at the level of the median. If anything, by 90 days out properties of 200 rooms and above have already absorbed roughly twice the inventory that small properties have. That gap narrows somewhat as the lead time shortens, but it never inverts.
| Size tier | Properties | Property-days | Median rooms | OTA-listed allocation | LT90 | LT60 | LT30 | LT14 | Latest | Latest remaining |
|---|---|---|---|---|---|---|---|---|---|---|
| 1-9 rooms | 1,179 | 3,559 | 4 | 80.0%(3 rooms) | 25.0% | 37.5% | 50.0% | 60.0% | 66.7% | 1 room |
| 10-29 rooms | 1,014 | 3,258 | 18 | 62.5%(11 rooms) | 40.0% | 50.0% | 60.0% | 68.8% | 75.0% | 4 rooms |
| 30-59 rooms | 642 | 2,054 | 42 | 61.2%(26 rooms) | 41.4% | 50.0% | 61.3% | 69.5% | 75.0% | 10 rooms |
| 60-99 rooms | 476 | 1,540 | 79 | 59.0%(45 rooms) | 46.3% | 51.5% | 62.8% | 69.7% | 74.7% | 20 rooms |
| 100-199 rooms | 808 | 2,694 | 140 | 57.5%(79 rooms) | 47.2% | 53.8% | 64.7% | 72.8% | 77.9% | 30 rooms |
| 200 rooms and above | 454 | 1,432 | 257 | 53.8%(148 rooms) | 50.8% | 56.6% | 67.4% | 74.8% | 79.7% | 57 rooms |
Note: Observations from the period before inventory was opened for sale (prior to listing) are excluded from each cut. All medians are medians of property-level values within the size tier.
Source: MetroEngines Research; compiled by the HotelBank Editorial Team
And yet small properties do “sell out early” — an 11x gap in sellout incidence
So why does the experience on the ground point the other way? The answer lies not in the absorption rate but in a different metric: whether zero remaining rooms was ever observed.
Across the four days of Obon, the share of properties that recorded zero remaining rooms at least once after inventory had been opened for sale is 35.9% for 1-9 rooms and 20.2% for 10-29 rooms. It falls to 9.5% for 30-59 rooms, 4.0% for 100-199 rooms and 3.2% for 200 rooms and above — roughly an 11x gap between the smallest and the largest. Big boxes lead on the median absorption rate, yet small properties dominate on sellout incidence. Two facts that look diametrically opposed emerge from the same data.
Source: MetroEngines Research; compiled by the HotelBank Editorial Team
The key to resolving the contradiction is the absolute size of the OTA-listed allocation plotted on the right axis. Properties of 1-9 rooms put a median of just 3 rooms out on OTAs and similar channels, and the median remaining count at the latest cut is a single room. Sell one more room and remaining inventory is zero. Properties of 200 rooms and above, by contrast, list a median of 148 rooms and still have 57 left at the latest cut. Reaching zero from there means selling every remaining room.
In other words, a “sellout” is made probabilistically easy to trigger not only by strength of demand but by the smallness of the denominator. A substantial part of the high sellout rate among small properties is best understood as an artifact of inventory granularity rather than as demand arriving earlier.
A four-room property’s absorption rate can only take four values
The effect of inventory granularity can be confirmed visually by placing the trajectories of individual properties side by side. The chart below overlays, for the same check-in date (August 13), the remaining-room trajectory of a 2,384-room large hotel in Tokyo against those of a four-room and a five-room property in the same city (names withheld; only size is shown).
Source: MetroEngines Research; compiled by the HotelBank Editorial Team
The 2,384-room hotel recorded 75 distinct absorption-rate values across 83 observations. Remaining rooms fall gradually from 1,391, around LT44 roughly 150 rooms are added back, and absorption then resumes. Both the strength of demand and the injection of additional inventory can be read as continuous quantities.
The four-room property, by contrast, takes just four distinct absorption values across 83 observations, and the five-room property only two across 84. Remaining rooms at the four-room property start at 3, hit 0 at LT65, return to 1 at LT61, drop to 0 again at LT56 — oscillating between 0 and 2. That zero is simultaneously a “sellout” and “a state that a single cancellation would undo.” The inventory signal from a small property is inherently discrete, moving between 100% and 75% on a single booking or cancellation. Reading that oscillation as the strength of demand invites misjudgement.
Turned around, the inventory trajectory of a big box carries an order of magnitude more information. The room to read the slope of demand from the daily absorption pace and feed it into pricing is wider the larger the property. The work of translating that continuous inventory trajectory into property-level patterns is set out in Tokyo Aug 14: 434 Hotels, Front-Loaded 10.8% vs Late-Surge 9.4%, which organises it as a way of telling front-loaded properties from late-surge ones.
The ordering reproduces when the season changes
To check whether this relationship is specific to Obon, two July 2026 weekend dates (July 18 and 25) and two Golden Week dates (May 2 and 3) were aggregated by the same procedure as control periods. All are settled dates whose check-in has already passed.
Lining up the medians at the LT30 cut: the July weekends run from 66.7% for 1-9 rooms up to 76.1% for 200 rooms and above, and Golden Week from 66.7% (10-29 rooms) up to 70.1% — in both cases rising from the smallest tier to the largest (Golden Week eases back into the 65% range at 30-99 rooms). It is the same shape as Obon.
Source: MetroEngines Research; compiled by the HotelBank Editorial Team
For Golden Week, no LT90 cut exists because inventory observation began on March 10, 2026; the display is limited to LT60 onward. Even so, the relationship between size and absorption points the same way across all three periods, which suggests it is not a coincidence of one particular season.
In all seven prefectures, big boxes outpace small properties
Regional variation is worth confirming too. Table 2 breaks the LT30 inventory absorption rate down by prefecture and size tier.
| Prefecture | 1-9 rooms | 10-29 rooms | 30-59 rooms | 60-99 rooms | 100-199 rooms | 200 rooms and above | Properties |
|---|---|---|---|---|---|---|---|
| Tokyo | 50.0% N=240 | 55.6% N=362 | 56.0% N=447 | 60.5% N=406 | 62.5% N=923 | 67.7% N=411 | 885 |
| Kanagawa | 50.0% N=362 | 58.3% N=460 | 58.5% N=170 | 56.0% N=162 | 61.0% N=259 | 64.1% N=151 | 522 |
| Osaka | 50.0% N=142 | 57.1% N=167 | 58.9% N=248 | 61.9% N=196 | 62.5% N=452 | 61.1% N=299 | 477 |
| Kyoto | 57.1% N=448 | 61.5% N=606 | 62.8% N=249 | 61.9% N=126 | 66.0% N=255 | 68.8% N=112 | 648 |
| Hokkaido | 50.0% N=532 | 66.7% N=564 | 69.8% N=399 | 66.5% N=280 | 70.9% N=367 | 74.4% N=202 | 890 |
| Okinawa | 62.5% N=645 | 54.5% N=654 | 61.9% N=281 | 71.0% N=167 | 72.7% N=181 | 73.6% N=99 | 715 |
| Fukuoka | 55.6% N=312 | 58.5% N=298 | 56.2% N=178 | 63.7% N=168 | 65.7% N=234 | 67.7% N=157 | 436 |
Note: N is the number of property-day observations. Cells with fewer than 15 observations are not shown.
Source: MetroEngines Research; compiled by the HotelBank Editorial Team
In every one of the seven prefectures, the absorption rate for 200 rooms and above exceeds that for 1-9 rooms. The levels themselves vary by region: Hokkaido (74.4% for 200 rooms and above) and Okinawa (73.6%) are high, while Kanagawa (64.1%) and Osaka (61.1%) are relatively low. The Obon booking figures released by the airlines also show high reservation rates for Okinawa and Hokkaido routes, broadly consistent with accommodation inventory absorption. How far absorption levels can diverge at the prefecture level is broken down in detail for the same Obon cut in Obon T-7: Kyushu’s 31.7pt Gap — Fukuoka 73.0%, Kagoshima 41.3%.
Some regions, however, do not line up monotonically by tier. In Okinawa, 1-9 rooms at 62.5% exceeds 10-29 rooms (54.5%), hinting at behaviour specific to small properties in remote-island and resort areas. In Osaka, 200 rooms and above (61.1%) sits slightly below 100-199 rooms (62.5%). At the regional level, in other words, there is room for factors other than size to affect the ordering.
The real issue is not the gap between size tiers but the gap inside them
So far the comparison has been between size-tier medians. For management decisions, however, what matters more is how wide the spread between properties is inside the same size tier. Taking the first quartile (the level of the bottom 25%) and the third quartile (the level of the top 25%) for each tier at the LT30 cut gives the following.
Source: MetroEngines Research; compiled by the HotelBank Editorial Team
| Size tier | Bottom 25% | Median | Top 25% | Spread | Median rooms | Converted to rooms |
|---|---|---|---|---|---|---|
| 1-9 rooms | 25.0% | 50.0% | 77.8% | 52.8pt | 4 rooms | approx. 2 rooms |
| 10-29 rooms | 40.0% | 60.0% | 75.9% | 35.9pt | 18 rooms | approx. 6 rooms |
| 30-59 rooms | 44.4% | 61.3% | 74.4% | 30.0pt | 42 rooms | approx. 13 rooms |
| 60-99 rooms | 48.1% | 62.8% | 75.0% | 26.9pt | 79 rooms | approx. 21 rooms |
| 100-199 rooms | 50.0% | 64.7% | 76.7% | 26.7pt | 140 rooms | approx. 37 rooms |
| 200 rooms and above | 53.2% | 67.4% | 78.5% | 25.3pt | 257 rooms | approx. 65 rooms |
Source: MetroEngines Research; compiled by the HotelBank Editorial Team
The spread in percentage terms is itself narrower the larger the property (52.8 points for 1-9 rooms against 25.3 points for 200 rooms and above). Convert it into rooms, though, and the impression reverses. In the 200-rooms-and-above tier, at the same size and on the same date, the gap between the top 25% and the bottom 25% is worth about 65 rooms of absorption. It is about 37 rooms for 100-199 rooms and about 21 rooms for 60-99 rooms. For 1-9 rooms it comes to about 2.
Put differently, the gap inside a single size tier is far larger than the gap between the size-tier medians (a maximum of 17.4 points at LT30). The debate about big boxes being slow and small properties fast in fact explains little. If a property is running dozens of rooms apart from the one next door at the same box size, that is precisely where the design headroom for pricing and inventory allocation sits.
At the same absorption rate, the number of rooms in play changes by an order of magnitude
The figures so far are restated below as attainment levels by size tier. The table is not a forecast: it converts the measured quartiles from Table 3 (LT30, Obon 2026) into room counts using the median room count. The pessimistic case corresponds to the bottom 25% within the same size tier, the middle case to the median, and the optimistic case to the top 25%.
| Size tier | Median rooms | Pessimistic (bottom 25%) | Middle (median) | Optimistic (top 25%) | Optimistic − pessimistic |
|---|---|---|---|---|---|
| 1-9 rooms | 4 rooms | 25.0% 1 room | 50.0% 2 rooms | 77.8% 3 rooms | approx. 2 rooms |
| 10-29 rooms | 18 rooms | 40.0% 7 rooms | 60.0% 11 rooms | 75.9% 14 rooms | approx. 7 rooms |
| 30-59 rooms | 42 rooms | 44.4% 19 rooms | 61.3% 26 rooms | 74.4% 31 rooms | approx. 12 rooms |
| 60-99 rooms | 79 rooms | 48.1% 38 rooms | 62.8% 50 rooms | 75.0% 59 rooms | approx. 21 rooms |
| 100-199 rooms | 140 rooms | 50.0% 70 rooms | 64.7% 91 rooms | 76.7% 107 rooms | approx. 37 rooms |
| 200 rooms and above | 257 rooms | 53.2% 137 rooms | 67.4% 173 rooms | 78.5% 202 rooms | approx. 65 rooms |
Note: The lower figure in each cell is the number of rooms absorbed, calculated as “median rooms × the relevant absorption rate” (rounded). All absorption rates are the measured values given in Table 3; no new estimation has been performed.
Source: MetroEngines Research; compiled by the HotelBank Editorial Team
Table 6 extends the same conversion across two axes, size and absorption rate. The absorption rates placed in the columns are kept within the range running from the minimum of the measured bottom quartile (25.0%) to the maximum of the measured top quartile (78.5%) in Table 3. At the same absorption rate, the number of rooms in play changes by an order of magnitude with size — one point of difference is only 0.04 rooms at 1-9 rooms, but 2.6 rooms at 200 rooms and above. This is why the interquartile spread within a size tier should be read in rooms.
| Size tier (median rooms) | 25.0% | 40.0% | 55.0% | 65.0% | 78.0% |
|---|---|---|---|---|---|
| 1-9 rooms 4 rooms | 1 room | 2 rooms | 2 rooms | 3 rooms | 3 rooms |
| 10-29 rooms 18 rooms | 4 rooms | 7 rooms | 10 rooms | 12 rooms | 14 rooms |
| 30-59 rooms 42 rooms | 10 rooms | 17 rooms | 23 rooms | 27 rooms | 33 rooms |
| 60-99 rooms 79 rooms | 20 rooms | 32 rooms | 43 rooms | 51 rooms | 62 rooms |
| 100-199 rooms 140 rooms | 35 rooms | 56 rooms | 77 rooms | 91 rooms | 109 rooms |
| 200 rooms and above 257 rooms | 64 rooms | 103 rooms | 141 rooms | 167 rooms | 200 rooms |
Note: Each cell is a simple conversion of “median rooms × absorption rate” (rounded). Shaded cells fall within the measured interquartile range (bottom 25% to top 25%) for that size tier. These are not estimates of future absorption rates.
Source: MetroEngines Research; compiled by the HotelBank Editorial Team
Properties above 100 rooms that sold out early — big boxes filled by real demand
That big boxes have a low sellout rate means, conversely, that an early sellout at a big box carries heavy meaning. With a large denominator, it cannot be explained away as probabilistic chance.
Table 4 covers the four days of Obon and, restricting to properties with at least 100 total rooms and an OTA-listed allocation of at least 50% of total rooms, ranks them by how early they reached zero remaining rooms after inventory had been opened for sale.
| Location | Property | Total rooms | Date | Early sellout LT | Days observed sold out | Latest remaining |
|---|---|---|---|---|---|---|
| Tokyo | Toyoko Inn Yamanote-Line Otsuka-eki Kitaguchi 2 (東横INN山手線大塚駅北口2) | 139 rooms | 08/16 | LT89 | 78 days | 18 rooms |
| Hokkaido | Dormy Inn PREMIUM Sapporo (ドーミーインPREMIUM札幌) | 168 rooms | 08/13 | LT66 | 45 days | 26 rooms |
| Hokkaido | Dormy Inn Sapporo ANNEX (ドーミーイン札幌ANNEX) | 134 rooms | 08/13 | LT66 | 45 days | 26 rooms |
| Tokyo | Capsule Land Yushima (カプセルランド湯島) | 112 rooms | 08/15 | LT53 | 43 days | 0 rooms |
| Kyoto | Hotel Sunroute Fukuchiyama (ホテルサンルート福知山) | 102 rooms | 08/15 | LT50 | 34 days | 0 rooms |
| Hokkaido | Comfort Hotel Obihiro (コンフォートホテル帯広) | 126 rooms | 08/13 | LT50 | 46 days | 0 rooms |
| Tokyo | Sauna & Capsule Hotel Hokuou (サウナ&カプセルホテル北欧) | 198 rooms | 08/14 | LT44 | 39 days | 0 rooms |
| Kanagawa | Wistarian Life Club Verde no Mori (ウィスタリアンライフクラブ ヴェルデの森) | 100 rooms | 08/13 | LT41 | 31 days | 0 rooms |
| Fukuoka | Hotel LiVEMAX Kokura Ekimae (ホテルリブマックス小倉駅前) | 124 rooms | 08/13 | LT41 | 31 days | 0 rooms |
| Hokkaido | the b sapporo (the b 札幌) | 130 rooms | 08/13 | LT36 | 32 days | 0 rooms |
| Kyoto | Mitsui Garden Hotel Kyoto Station (三井ガーデンホテル京都駅前) | 136 rooms | 08/16 | LT34 | 7 days | 4 rooms |
| Okinawa | The BREAKFAST HOTEL PORTO Ishigakijima (The BREAKFAST HOTEL PORTO石垣島) | 119 rooms | 08/15 | LT33 | 11 days | 1 room |
| Tokyo | Hesperia Inn Nihonbashi Hakozaki (エスペリアイン日本橋箱崎) | 114 rooms | 08/14 | LT33 | 12 days | 9 rooms |
| Hokkaido | Kitayuzawa Mori no Soraniwa (きたゆざわ森のソラニワ) | 197 rooms | 08/16 | LT32 | 20 days | 0 rooms |
Note: For each property, the date on which it sold out earliest among the four days of Obon is shown as the representative value. “Days observed sold out” is the number of observations recording zero remaining rooms in that date’s inventory trajectory.
Source: MetroEngines Research; compiled by the HotelBank Editorial Team
The earliest is a 139-room property at LT89 — roughly three months out. It is followed by properties of 168 and 134 rooms at LT66, and of 112, 102 and 126 rooms at around LT50. All exceed 100 rooms and put more than half of their total rooms out as OTA-listed allocation, yet cleared that allocation without waiting for the final stretch. As the sellout incidence above showed, only around 4.0% of properties in the 100-rooms-and-above tier are observed reaching zero remaining rooms. The names listed here belong to properties where demand outweighed the handicap of size.
An early sellout at a big box also raises the possibility that “the allocation disappeared before pricing caught up with demand.” The larger the denominator, the more rooms accumulate the benefit of any rate increase achieved by pushing the sellout point back even by a day. The roughly 65 rooms of spread seen in Table 3 maps directly onto that range of motion in rate design.
Where the headroom sits differs by size tier
It is worth organising the results so far as opportunities by size tier.
Small properties of 1-29 rooms — sellout incidence is high, but much of it comes from inventory granularity. Rather than reading a state of one remaining room as “nearly sold out,” there is room to revisit the listed allocation itself. A median OTA-listed allocation of 80.0% of total rooms (3 rooms) means, turned around, considerable design freedom over how the remainder is distributed across channels. The earlier bookings come in, the more room there is to set a high value on that one room.
Mid-size properties of 30-99 rooms — median absorption rates are at almost the same level as big boxes (61.3% to 62.8% at LT30), yet the spread within the tier runs 30.0 to 26.9 points, worth 13 to 21 rooms. Properties actually operating at the top-25% level (75.0%) exist, so pace comparison within the same size tier makes for an achievable target.
Large properties of 100 rooms and above — 47.2% to 50.8% is already absorbed by LT90, so demand in fact starts earlier. This is the tier where it works best to exploit the strength of an inventory trajectory readable as a continuous daily series and to raise rates in stages on days where the absorption pace is running at the upper level. A concrete procedure for checking progress at the fixed points of 45 days out, 30 days out and the final stretch is also set out in Osaka Obon 2026 Booking Curve: Aug 14 at 74.9%, Aug 16 Stuck at 64.1%. The roughly 65 rooms of within-tier spread can be read directly as upside potential.
The answer to the question of whether big boxes fill last is no. But the more practical implication lies elsewhere. Size changes how the inventory signal should be read, but it is not what determines the outcome. The gap against the property next door in the same size tier is where the headroom in pricing lies dormant.
How the data was obtained, and the limits of the aggregation
The aggregation procedure and the constraints readers need in order to evaluate the results are disclosed below.
Coverage: seven prefectures — Tokyo, Kanagawa, Osaka, Kyoto, Hokkaido, Okinawa and Fukuoka. Check-in dates cover the four days of Obon (August 13-16) as the primary subject, with July 18 and 25 and May 2 and 3 as controls. Aggregation was split by prefecture × property category × municipality so that no properties were dropped because of the per-query result limit.
A three-stage filter: of the 15,892 property-days for which an inventory trajectory could be obtained across the four days of Obon, records where the room-count master and the inventory observation were inconsistent (observed inventory exceeding total rooms — 1,355 property-days) were excluded, leaving 14,537 property-days and 4,573 distinct properties as the aggregation base. In addition, every aggregation excludes properties whose OTA-listed allocation is below 30% of total rooms. A small listed allocation can arise from channel operations centred on direct booking, from releasing inventory in small increments, or from contracts that set a low allocation to OTAs and similar channels in the first place — so a low remaining-room count does not mean the property as a whole is full. For reference, a prefecture-level query (August 13) against a scan frame of 800 properties returned inventory trajectories for 454 properties in Tokyo, 304 in Osaka, 204 in Kyoto, 445 in Hokkaido, 285 in Okinawa, 401 in Kanagawa and 303 in Fukuoka, of which 230, 144, 109, 171, 153, 239 and 173 respectively met the 30% listed-allocation condition. The split-query approach captures more properties than this.
Excluding pre-listing periods: all 337 property-days observed with zero remaining rooms at LT90 subsequently had inventory appear at shorter lead times. These represent inventory not yet released rather than a sellout, and were excluded from each cut. At LT60, 196 of the 446 property-days with zero remaining rooms were the same case. Without this correction, the LT90 absorption rate comes out overstated by up to 8.3 points depending on the size tier.
Observation point: the inventory state for the four days of Obon is based on observations as of August 9, 2026 (13,551 property-days observed on that date). Because hotels suspend and resume sales, inventory can move even within a day, so remaining rooms may have reappeared after this article was published. The “latest remaining” column in Table 4 is also as of that date.
Other constraints: because collection of inventory data began on March 10, 2026, the LT90 cut for Golden Week cannot be obtained. Room count is the total rooms held in the master and may not match the number of rooms available for sale. All size-tier figures are medians; inventory absorption rates for individual properties are not disclosed.
⚠ On the observation point for inventory data: the inventory state for the Obon period covered here (August 13-16, 2026) is an estimate based on sales inventory confirmed as of August 9, 2026. Because inventory moves even within a day through hotels suspending and resuming sales and through booking cancellations, remaining rooms may have reappeared after publication. All size-tier figures are medians; inventory absorption rates for individual properties are neither calculated nor disclosed.
Further Reading
- Tokyo Aug 14: 434 Hotels, Front-Loaded 10.8% vs Late-Surge 9.4%
- Obon T-7: Kyushu’s 31.7pt Gap — Fukuoka 73.0%, Kagoshima 41.3%
- Okayama Booking Curves: 3 Checkpoints, Aug 8 Late-Surges +11.8pt
- Osaka Obon 2026 Booking Curve: Aug 14 at 74.9%, Aug 16 Stuck at 64.1%
- Kyoto Obon 2026 Booking Curves: Ryokan Add the Most Close In, +11.4pt
- Okinawa Resort Obon 2026 Booking Pace — 67-Room Property Hits LT70 Sellout
References and Sources
■ Data sources
Room inventory trajectories for accommodation properties observed by MetroEngines Research (seven prefectures — Tokyo, Kanagawa, Osaka, Kyoto, Hokkaido, Okinawa and Fukuoka; 4,573 distinct properties and 14,537 property-days; observed as of August 9, 2026). The primary subject is the four days of Obon (August 13-16), with July 18 and 25 and May 2 and 3, 2026 aggregated by the same procedure as control periods. The Japan Tourism Agency’s Accommodation Survey and the Obon booking figures published by the ANA Group and JAL are used as external references on supply and demand.
■ Calculation assumptions
The inventory absorption rate is an estimate calculated as (total rooms − remaining rooms) ÷ total rooms and differs from a property’s actual overall occupancy rate. All size-tier figures are medians of property-level values, and individual property values are not disclosed. Aggregation is limited to properties whose OTA-listed allocation is at least 30% of total rooms, and 1,355 property-days on which observed inventory exceeded total rooms were excluded. The 337 property-days with zero remaining rooms at LT90 that subsequently had inventory appear are excluded from every cut as inventory not yet released. Tables 5 and 6 convert the measured quartiles and median room counts given in Table 3 into room counts; they do not forecast future absorption rates.
■ Limitations and caveats
Because collection of inventory data began on March 10, 2026, the LT90 cut for Golden Week cannot be obtained. Room count is the total rooms held in the master and may not match the number of rooms available for sale. Remaining-room counts move even within a day through hotels suspending and resuming sales and through booking cancellations, so values may shift after publication. Because the number of properties meeting the 30%-listed-allocation condition grows as observations accumulate, aggregating under the same conditions at a later date may yield more properties than reported here. Definitive interpretation is avoided for cells with fewer than 15 observations and for size tiers with fewer than 10 properties.
■ Inventory and price data
- MetroEngines Research — room inventory trajectories for accommodation properties (seven prefectures, 4,573 properties, 14,537 property-days; observed as of August 9, 2026)
■ Government statistics
- Japan Tourism Agency, “Accommodation Survey (April 2026 second preliminary report, May 2026 first preliminary report, and 2025 annual figures (final))” (2025 annual room occupancy rate 61.6%; ryokan 38.2%, resort hotels 56.9%, business hotels 75.3%, city hotels 74.1%, simple lodgings 29.6%. From the January 2026 survey onward, the stratification basis was changed from number of employees to number of rooms.)
- Japan Tourism Agency, “Accommodation Survey”
■ Press releases
- ANA Group, “Booking Status for the Obon Period, Fiscal 2026” (covering August 7-16, 2026; domestic booking rate 83.6%, Okinawa routes 88.7%, Tohoku and Hokuriku routes 86.0%, Chugoku and Shikoku routes 84.9%, Hokkaido routes 84.4%)
- JAL, “Booking Status for the Obon Period, Fiscal 2026”