

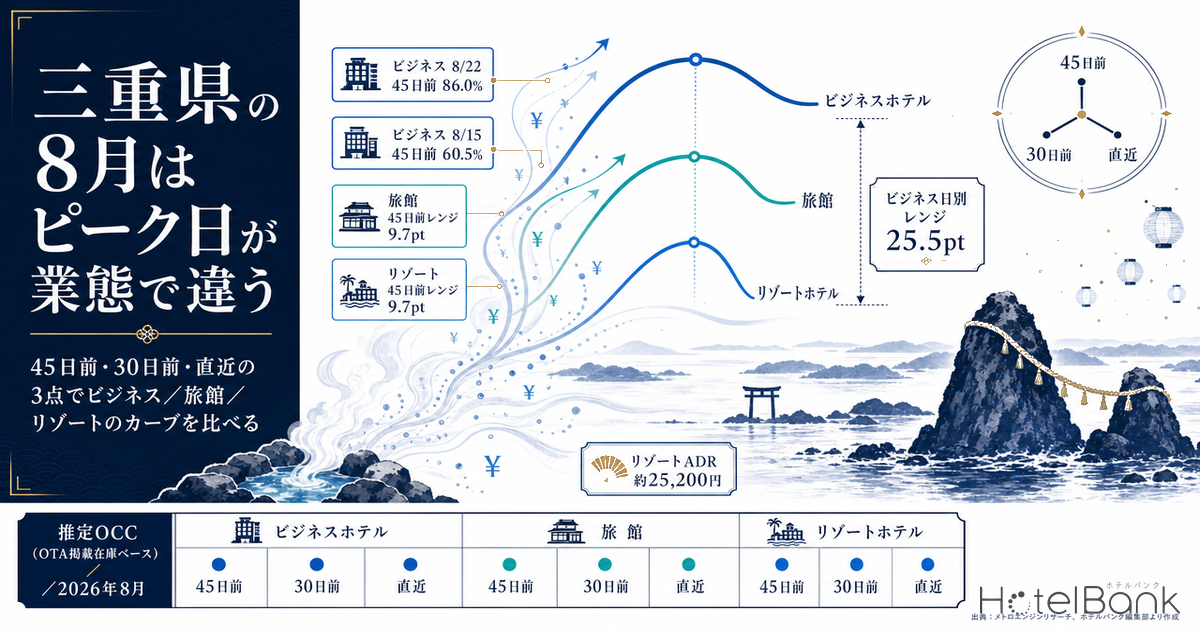
In Mie Prefecture, August 2026 puts the peak on different dates depending on the property type — even within the same prefecture, and even comparing one Saturday with another. At business hotels (N=90 properties), Saturday, August 15, in the middle of Obon, stood at an estimated OCC of 60.5% at 45 days before the stay date, while Saturday, August 22, the first Saturday after Obon, was at 86.0% at the same point. That is a 25.5-point gap in the same cross-section. At ryokan (N=190 properties) and resort hotels (N=33–34 properties), by contrast, the 45-days-out range across seven stay dates came to just 9.7 points in both cases, with Obon and late August lining up at broadly similar levels. Which dates you steer inventory allocation and selling restrictions toward is not decided at the prefecture level but by property type — and this article puts numbers on that difference using three fixed checkpoints: 45 days out, 30 days out, and the latest reading.
Scope: Mie Prefecture business hotels N=90 properties, ryokan N=190 properties, resort hotels N=33–34 properties. Price figures in this article are estimated settled ADR (the transaction price level inferred from OTA and other sales data, on a pre-tax equivalent basis); occupancy is an estimate based on OTA-listed inventory. Both definitions appear at the end of the article. Data as of August 8, 2026.
- — The day-to-day range at 45 days out differs by a factor of 2.6 across property types. Business hotels spread across 25.5 points (60.5%–86.0%), while ryokan and resort hotels both stay within 9.7 points.
- — The curves for August 15 and August 22 never cross. For business hotels, the pickup from 45 to 30 days out is +4.6 and +5.6 points — almost the same. Most of the gap comes from where they started at 45 days out.
- — The last Friday of August is slow across all three property types. Pickup from 45 to 30 days out on August 28 is +3.0 for business hotels, +0.9 for ryokan and +2.0 points for resort hotels — bottom-tier among the seven dates in every case.
- — How many days of the week can absorb demand varies by property type. In final July 2026 figures, Saturday lines up at 92–93% across all three types, while Sunday splits: business hotels 77.9%, ryokan 84.6%, resort hotels 88.2%.
- — The ranking flips between points and yen. Applying August 2026 estimated settled ADR to the latest cross-section, the peak-to-trough spread is ¥2,922 for ryokan, ¥2,872 for resort hotels and ¥2,400 for business hotels.
Two Saturdays That Never Cross — The Booking Curves for August 15 and August 22
Start by overlaying the two Saturdays in August. August 15 sits in the middle of Obon; August 22 is the first Saturday after it. At Mie’s business hotels, these two curves never cross once, from 45 days out through the latest reading. August 22 had already reached an estimated OCC of 86.0% at 45 days out, 91.6% at 30 days out, and 93.9% at the latest observation (collected August 7, 2026 — 15 days before the stay date). August 15, by contrast, sits at 60.5% at 45 days out, 65.1% at 30 days out, and just 73.3% at the latest observation (also collected August 7 — 8 days before the stay date). The amount added over the 15 days from 45 days out to 30 days out is +5.6 points for August 22 and +4.6 points for August 15 — not very different. In other words, the weakness of August 15 stems less from “there is still room to fill with bookings to come” than from the starting point at 45 days out being low in the first place.
Look at the same two dates for ryokan and the picture is quite different. August 22 runs 76.0% at 45 days out → 81.3% at 30 days out → 84.3% most recently; August 15 runs 71.4% → 72.5% → 77.3%. The gap between the two lines is 4.6 points at 45 days out and still only 7.0 points at the latest reading — nothing like the fault line seen at business hotels. If anything, the distinctive feature at ryokan is that Thursday, August 13, in the first half of Obon, is the strongest date at 78.1% at 45 days out → 82.1% at 30 days out → 89.6% most recently, putting the peak on a weekday rather than a Saturday. Obon peaks shifting off Saturday and onto weekdays is not unique to Mie: it has also been observed in Wakayama Obon 2026: Aug 13 Peaks 94.9%, Aug 15 Ryokan Stuck at 73.2%, where ryokan and resort hotels diverged in how their inventory progressed.
Source: MetroEngines Research; compiled by the HotelBank Editorial Team
For business hotels on August 22, the share of properties with no listed inventory remaining (estimated) had already reached 41.1% at 45 days out and had risen to 54.4% by 30 days out. The same measure for August 15 was 7.8% both at 45 days out and at the latest reading, meaning inventory conditions had already polarized by the 45-days-out mark. At ryokan, August 22 was 32.6% at 45 days out and 33.2% most recently, and August 15 was 35.4% and 27.5% — a much smaller difference between dates than at business hotels.
45 Days Out, 30 Days Out, Latest — Seven Stay Dates at Three Fixed Checkpoints
Two dates alone could be coincidence. So we lined up seven stay dates — the Obon dates of Thursday, August 13, Friday, August 14 and Saturday, August 15; the post-Obon dates of Friday, August 21 and Saturday, August 22; and the end-of-August dates of Friday, August 28 and Saturday, August 29 — at the same three checkpoints for all three property types. The latest observation comes from a single snapshot collected on August 7, 2026, so the number of days remaining until the stay date varies by date, from 6 to 22 days out.
| Stay date | Days out at latest reading |
Business hotels N=90 | Ryokan N=190 | Resort hotels N=33–34 | ||||||
|---|---|---|---|---|---|---|---|---|---|---|
| T-45 | T-30 | Latest | T-45 | T-30 | Latest | T-45 | T-30 | Latest | ||
| August 13 (Thu) | 6 days | 66.9 | 74.0 | 89.2 | 78.1 | 82.1 | 89.6 | 75.3 | 80.1 | 91.5 |
| August 14 (Fri) | 7 days | 65.1 | 71.4 | 83.9 | 76.3 | 78.9 | 85.0 | 73.6 | 77.7 | 84.2 |
| August 15 (Sat) | 8 days | 60.5 | 65.1 | 73.3 | 71.4 | 72.5 | 77.3 | 68.4 | 72.8 | 80.1 |
| August 21 (Fri) | 14 days | 72.6 | 76.2 | 79.5 | 69.5 | 73.9 | 75.7 | 76.8 | 81.6 | 84.8 |
| August 22 (Sat) | 15 days | 86.0 | 91.6 | 93.9 | 76.0 | 81.3 | 84.3 | 75.1 | 81.8 | 84.6 |
| August 28 (Fri) | 21 days | 64.5 | 67.5 | 69.7 | 68.4 | 69.3 | 71.8 | 75.5 | 77.5 | 80.4 |
| August 29 (Sat) | 22 days | 71.5 | 76.2 | 77.1 | 71.0 | 73.8 | 75.7 | 78.1 | 79.9 | 83.4 |
Units: estimated OCC (%) / Source: MetroEngines Research; compiled by the HotelBank Editorial Team
Isolating the common 45-days-out cross-section makes the difference between property types even clearer. The seven dates at business hotels scatter across 25.5 points, from a low of 60.5% (August 15) to a high of 86.0% (August 22), whereas ryokan stay within 9.7 points (68.4% on August 28 to 78.1% on August 13) and resort hotels also within 9.7 points (68.4% on August 15 to 78.1% on August 29). The two leisure types finish August at broadly similar levels whatever the date; only business hotels are picking their dates.
Source: MetroEngines Research; compiled by the HotelBank Editorial Team
Looking at how much was added over the 15 days from 45 days out to 30 days out, business hotels gained most on August 13 (+7.1 points), August 14 (+6.3 points) and August 22 (+5.6 points), while August 28 was the smallest at +3.0 points. For ryokan, August 22 (+5.3 points) and August 21 (+4.4 points) top the list, while August 28 managed just +0.9 points and August 15 only +1.1 points. At resort hotels, August 22 was the largest at +6.7 points, with August 29 (+1.8 points) and August 28 (+2.0 points) at the bottom. What all three types share is that the last Friday of August (August 28) moves slowly from 45 to 30 days out, and at the latest observation (21 days before the stay date) it also sits low among the seven dates at 69.7% for business hotels, 71.8% for ryokan and 80.4% for resort hotels. Whether three checkpoints — 45 days out, 30 days out and the latest reading — are enough for day-to-day inventory decisions is examined head-on in Okayama Booking Curves: 3 Checkpoints, Aug 8 Late-Surges +11.8pt.
July’s Final Day-of-Week Pattern, and Price Levels by Property Type
To understand why the August cross-section splits by property type, check the daily actuals for July 2026, the month just completed. Monthly average estimated OCC in Mie was 82.7% for business hotels, 81.2% for ryokan and 84.1% for resort hotels — all three types close together at the monthly level. Split by day of the week, though, differences emerge. Saturday is the strongest day of the week for all three, at 92.1% for business hotels, 93.3% for ryokan and 93.3% for resort hotels; but Sunday splits, with business hotels at 77.9% against 84.6% for ryokan and 88.2% for resort hotels — a gap of 6.7 to 10.3 points. The weakest day of the week for business hotels was Monday at 76.0%, 16.1 points below Saturday; for ryokan it was Tuesday at 77.7%, a 15.6-point gap; and for resort hotels Wednesday at 78.4%, a 14.9-point gap.
Source: MetroEngines Research; compiled by the HotelBank Editorial Team
Where business hotels concentrate demand on a single point in the weekend and fall away quickly on Sunday and into the new week, the two leisure types use three days — Friday, Saturday and Sunday — to absorb demand. That business hotels alone swing widely from date to date in the August cross-section is consistent with this narrower catchment.
Price levels are worth pinning down alongside this. Mie’s estimated settled ADR (monthly, pre-tax equivalent) for July 2026, the most recent finalized month, was roughly ¥7,100 for business hotels, ¥15,400 for ryokan and ¥19,300 for resort hotels. Against the same month a year earlier (July 2025, final), business hotels were essentially flat at +1.2%, ryokan were down 3.9% and resort hotels down 14.5%. For August 2026, the estimates based on current sales conditions come in at roughly ¥9,900 for business hotels, ¥16,400 for ryokan and ¥25,200 for resort hotels — a seasonality that shifts levels substantially from one month to the next. The way these price bands overlap reflects the prefecture’s underlying location structure, which separates into a resort layer, a tourism-gateway layer and a business-corridor layer.
| Property type | July 2025 (final) | July 2026 (final) | YoY | August 2026 (current estimate) |
|---|---|---|---|---|
| Business hotels | ¥6,983 N=96 | ¥7,065 N=94 | +1.2% | ¥9,919 N=91 |
| Ryokan | ¥15,985 N=211 | ¥15,365 N=207 | −3.9% | ¥16,416 N=204 |
| Resort hotels | ¥22,551 N=35 | ¥19,275 N=39 | −14.5% | ¥25,198 N=38 |
Estimated settled ADR (pre-tax equivalent) / Source: MetroEngines Research; compiled by the HotelBank Editorial Team
Note that the August 2026 figures are estimates based on current sales conditions and may move as selling continues. A straight comparison against final figures for August last year is best left until the month closes.
Converting the Three Checkpoints into Yen per Room — A Unit Conversion of Rate and Occupancy
Everything above has been expressed as a ratio. Restating the same numbers as yen per room changes how the property types compare. The only operation used is the unit conversion estimated RevPAR equivalent per room = estimated settled ADR × estimated occupancy, multiplying the August 2026 estimated settled ADR already shown above (¥9,919 for business hotels, ¥16,416 for ryokan, ¥25,198 for resort hotels) by the estimated occupancy at the latest cross-section. Note that this does not forecast future revenue; it simply puts two figures already stated in this article onto the same unit.
| Property type | Estimated settled ADR August 2026 |
Trough (lowest latest reading) | Median (of the seven dates) | Peak (highest latest reading) | Peak-to-trough spread | |||
|---|---|---|---|---|---|---|---|---|
| Level | Converted | Level | Converted | Level | Converted | |||
| Business hotels | ¥9,919 | 69.7% August 28 | ¥6,914 | 79.5% August 21 | ¥7,886 | 93.9% August 22 | ¥9,314 | 24.2pt ¥2,400 |
| Ryokan | ¥16,416 | 71.8% August 28 | ¥11,787 | 77.3% August 15 | ¥12,690 | 89.6% August 13 | ¥14,709 | 17.8pt ¥2,922 |
| Resort hotels | ¥25,198 | 80.1% August 15 | ¥20,184 | 84.2% August 14 | ¥21,217 | 91.5% August 13 | ¥23,056 | 11.4pt ¥2,872 |
Estimated RevPAR equivalent per room (¥) / Source: MetroEngines Research; compiled by the HotelBank Editorial Team
This is where the ranking flips. Measured in points, the peak-to-trough spread is largest at business hotels with 24.2 points, followed by ryokan at 17.8 points and resort hotels at 11.4 points. Converted into yen, however, the order reverses: ryokan ¥2,922 > resort hotels ¥2,872 > business hotels ¥2,400. Because rate level determines the yen difference per room, the type that swings most in percentage terms is not necessarily the one that swings most in money. If you are deciding how much effort to put into managing individual dates, comparing converted amounts rather than point differences is closer to the operational reality.
To go one level finer, here are the combinations of rate level and occupancy level for business hotels. The vertical axis takes five levels inside the range of business-hotel estimated settled ADR that appears in this article (¥6,983 in July 2025 to ¥9,919 in August 2026); the horizontal axis takes five levels of the latest estimated occupancy actually observed across the seven stay dates. Neither axis extends beyond the observed range.
| Estimated settled ADR \ Latest estimated occupancy | 69.7% August 28 | 73.3% August 15 | 79.5% August 21 | 89.2% August 13 | 93.9% August 22 |
|---|---|---|---|---|---|
| ¥7,000 | ¥4,879 | ¥5,131 | ¥5,565 | ¥6,244 | ¥6,573 |
| ¥7,700 | ¥5,367 | ¥5,644 | ¥6,122 | ¥6,868 | ¥7,230 |
| ¥8,400 | ¥5,855 | ¥6,157 | ¥6,678 | ¥7,493 | ¥7,888 |
| ¥9,200 | ¥6,412 | ¥6,744 | ¥7,314 | ¥8,206 | ¥8,639 |
| ¥9,900 | ¥6,900 | ¥7,257 | ¥7,870 | ¥8,831 | ¥9,296 |
Estimated RevPAR equivalent per room (¥) / Source: MetroEngines Research; compiled by the HotelBank Editorial Team
Read the grid across and, holding the rate at ¥8,400, moving occupancy from 69.7% to 93.9% shifts the converted amount per room from ¥5,855 to ¥7,888 — a swing of ¥2,033. Read it down and, fixing occupancy at the median 79.5%, the difference between a ¥7,000 rate and a ¥9,900 rate is ¥2,305. For business hotels in August, date-to-date variation in occupancy and the monthly rate level work at roughly the same order of magnitude, which means judging how August went by looking at only one of the two makes it easy to reach the wrong conclusion.
For Revenue Managers Running Business Hotels, Ryokan and Resorts in Mie — Implications and Action Plan
1. Allocate inventory by “August for your property type,” not “August for the prefecture.” The day-to-day range at 45 days out is 25.5 points for business hotels (60.5%–86.0%) and 9.7 points for both ryokan and resort hotels. If you run a business hotel, treating August as a uniformly high-demand month means troughs such as August 15 (60.5% at 45 days out) never get the attention they need. Conversely, for ryokan and resorts, with less than 10 points separating dates, the market is not making a strong case for concentrating restrictions on specific dates.
2. Read your own curve as two separate things: the starting point at 45 days out, and the pickup from 45 to 30 days out. Business hotels on August 22 went from 86.0% at 45 days out to 91.6% at 30 days out, a pickup of +5.6 points; August 15 went from 60.5% to 65.1%, or +4.6 points. The pickups themselves are close, and the gap comes almost entirely from the starting point. When benchmarking your own booking pace against the market, separating these two makes it easier to tell whether what you are missing is the early build or the last-minute run.
3. The last Friday of August is slow across all three property types. Pickup from 45 to 30 days out on August 28 is +3.0 for business hotels, +0.9 for ryokan and +2.0 points for resort hotels — bottom-tier among the seven dates. At the latest observation (21 days before the stay date) it is also low, at 69.7%, 71.8% and 80.4% respectively. Rather than tightening restrictions here, there is room to think about how to pick up the remaining stay demand.
4. How many days of the week can absorb demand varies by property type. In final July 2026 results, Sunday runs 77.9% at business hotels against 84.6% at ryokan and 88.2% at resort hotels. The weakest day of the week for business hotels is Monday at 76.0%, a full 16.1 points below Saturday’s 92.1%. Assume a demand shape concentrated on a single weekend point, and design weekday and Sunday selling separately.
Below is an action plan with a time horizon attached. Every numerical trigger is a market figure presented in this article; judge it against your own settings and results.
| Time horizon | Move | Decision trigger (figures from this article) | Objective |
|---|---|---|---|
| Today to this week | Check how remaining inventory for Saturday, August 22 is being sold | The business-hotel market is at 93.9% at the latest observation (15 days before the stay date), with 42.2% of properties showing no listed inventory. If your property is not at a similar level, suspect a slow early build | Capture the last of the demand |
| Today to this week | Review whether restrictions on Friday, August 28 can be loosened | At the latest observation, business hotels 69.7%, ryokan 71.8% and resort hotels 80.4% — low among the seven dates — with pickup from 45 to 30 days out of just +3.0/+0.9/+2.0 points | Lose less on trough dates |
| Within two weeks | Redesign Sunday and Monday selling separately | In final July 2026 figures, business hotels run 77.9% on Sunday and 76.0% on Monday against 92.1% on Saturday. Sunday levels differ by type, at 84.6% for ryokan and 88.2% for resort hotels | Fill the mid-week trough |
| Within two weeks | Compare your August pricing against market estimated settled ADR | Current August 2026 estimates are roughly ¥9,900 for business hotels, ¥16,400 for ryokan and ¥25,200 for resort hotels (pre-tax equivalent). If your realized level remains well below this, there is room for review | Check for rate left on the table |
| Looking to next month | Put September and October target dates on a “45-days-out checklist” | In the August 45-days-out cross-section, the day-to-day range is 25.5 points for business hotels against 9.7 points for ryokan and resorts. Set your review frequency according to your own type’s range | Structurally prevent a slow early build |
| Looking to next month | Match the review cadence of your pricing calendar to your property type | Final estimated settled ADR for July 2026 moved in different directions year on year: business hotels +1.2%, ryokan −3.9%, resort hotels −14.5% | Align with type-specific supply and demand |
Source: MetroEngines Research; compiled by the HotelBank Editorial Team
Summary — Three Yardsticks for Measuring August in Mie
These three fixed checkpoints yield three yardsticks that carry over to any property type.
Yardstick 1: the day-to-day range at 45 days out. Line up the main dates of the target month by estimated OCC at 45 days out and measure the gap between highest and lowest. For Mie in August 2026, that was 25.5 points for business hotels and 9.7 points for both ryokan and resort hotels. The wider the range, the more date-level inventory allocation and restriction design pays off.
Yardstick 2: separating the starting point from the pickup. Record the level at 45 days out (the starting point) and the amount added from 45 to 30 days out as two distinct numbers. At Mie’s business hotels, August 15 and August 22 added a similar +4.6 and +5.6 points, and most of the gap sat in the starting point. Two dates can look equally “low” for different reasons — and those reasons call for different moves.
Yardstick 3: how many days of the week absorb demand. Take estimated OCC by day of the week for the most recently completed month and compare the gap between the strongest and weakest days — and the Sunday level — across property types. In Mie in July 2026, Saturday lined up at 92.1% for business hotels, 93.3% for ryokan and 93.3% for resort hotels, while Sunday split at 77.9%, 84.6% and 88.2%. How many days count as “the weekend” differs by property type.
Update these three the same way every month and the vague premise that “August is busy” turns into decision-grade material at the level of individual dates.
About the Data
| Definition of estimated OCC | Occupancy on an OTA-listed-inventory basis = 100 − 100 × rooms still listed on OTAs ÷ total rooms. It is an estimate based on how listed inventory is being taken up on OTAs, and is defined differently from actual room occupancy (it runs higher). This article labels it “estimated OCC (OTA-listed-inventory basis).” |
| Booking curves | Based on observations from 45 days before the stay date through the latest reading. Scope is Mie Prefecture; stay dates are August 13, 14, 15, 21, 22, 28 and 29, 2026. The latest observation comes from a single snapshot collected on August 7, 2026, so days remaining until the stay date vary by date from 6 to 22. Collection days on which fewer than half the population was observed were excluded from the aggregation. |
| Definition of estimated settled ADR | The transaction price level (pre-tax equivalent) inferred from OTA and other sales data (lowest-plan level × property-type coefficient, ensembled across multiple channels). Past months are final; the current and future months are estimates based on current sales conditions. Median error against published operating results is 6.6%. |
| Breakdown of N | Booking curves: business hotels N=90 properties (10,082 rooms), ryokan N=189–191 properties (4,862–4,994 rooms), resort hotels N=33–34 properties (2,677–2,772 rooms). Observed property counts at each cross-section were 54–88 for business hotels, 108–188 for ryokan and 27–34 for resort hotels. For the daily July 2026 results, property counts were 83–90 for business hotels, 147–191 for ryokan and 29–34 for resort hotels. For estimated settled ADR, monthly N= figures are shown within the table. The share of properties with no listed inventory remaining is an estimate. |
| Data date | Data as of August 8, 2026. Sales conditions and inventory change daily, so the figures in this article are a snapshot as of the time of collection. |
References and Sources
■ Data sources
Mie Prefecture booking curves (how listed inventory is taken up by stay date), daily estimated occupancy, and monthly estimated settled ADR, compiled by MetroEngines Research from publicly available OTA information. Scope covers three property types in Mie — business hotels, ryokan and resort hotels — across seven stay dates: August 13, 14, 15, 21, 22, 28 and 29, 2026. Day-of-week results are daily aggregations for July 2026; price levels are monthly estimated settled ADR (July 2025 and July 2026 final; August 2026 estimated from current sales conditions). Data as of August 8, 2026.
■ Calculation assumptions
The “estimated RevPAR equivalent per room” is a unit conversion multiplying the August 2026 estimated settled ADR stated in the text (pre-tax equivalent) by the estimated occupancy at the latest cross-section, also stated in the text; it does not forecast future revenue. The vertical axis of the conversion grid uses only levels within the range of estimated settled ADR appearing in this article, and the horizontal axis only occupancy levels actually observed across the seven stay dates; no extrapolation beyond the observed range is performed. Every cell is calculated with the same formula and rounded to the nearest yen. The “trough, median and peak” of the three checkpoints are the minimum, median and maximum of the latest observations across the seven stay dates, sorted in ascending order.
■ Limitations and caveats
Occupancy is an estimate on an OTA-listed-inventory basis and is defined differently from actual room occupancy (it runs higher). Collection days on which fewer than half the population was observed are excluded from the aggregation, so observed property counts differ between cross-sections. The latest observation comes from a single snapshot collected on August 7, 2026, and days remaining until the stay date vary by date from 6 to 22, so the latest values are not a comparison at a matched number of days out. The August 2026 estimated settled ADR is an estimate based on current sales conditions and may change when the month is finalized. The share of properties with no listed inventory remaining is an estimate and does not mean the property is actually sold out. Inventory and prices change daily, so the figures in this article are a snapshot as of the time of collection.
Related Reading
- Wakayama Obon 2026: Aug 13 Peaks 94.9%, Aug 15 Ryokan Stuck at 73.2%
- Yamanashi Obon: Ryokan Gain Only +1.1pt, Business Hotels +7.9pt
- Tochigi Booking Curves by Type: Resort 81.1% at T-45, Only +2.6pt Left
- Kyoto Obon 2026 Booking Curves: Ryokan Add the Most Close In, +11.4pt
- Okayama Booking Curves: 3 Checkpoints, Aug 8 Late-Surges +11.8pt