

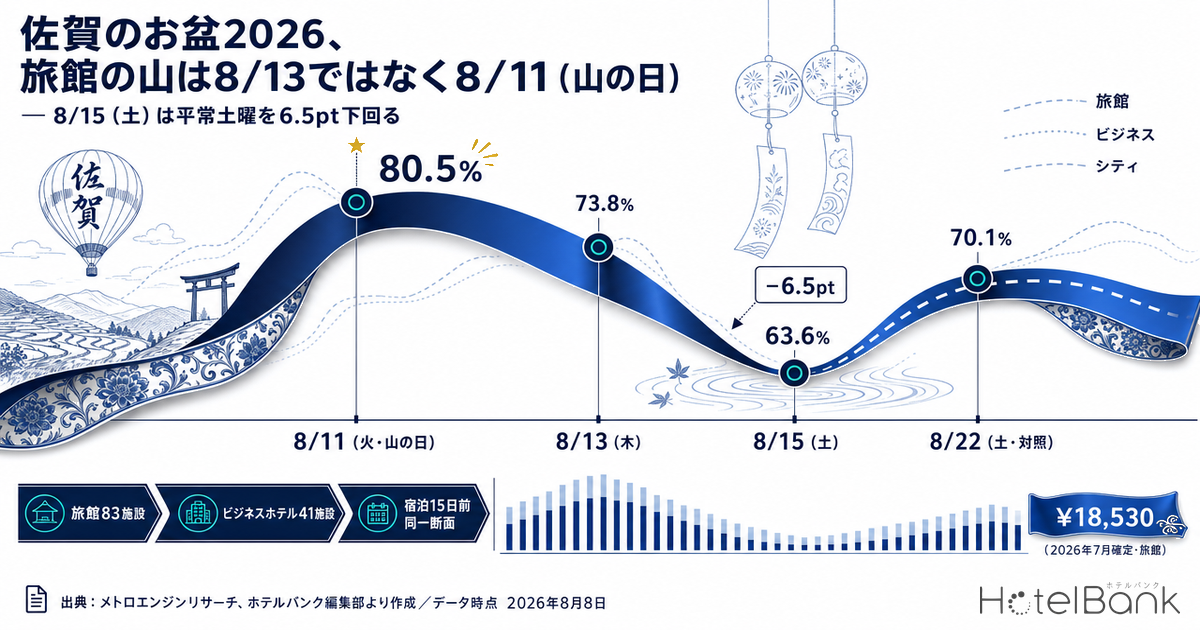
For Obon 2026, the peak of accommodation demand in Saga Prefecture does not fall on August 13 — it falls on Tuesday, August 11 (Mountain Day). Booking curves by stay date across 83 ryokan in the prefecture show that, at the identical 15-days-out cross-section, Aug 11 stands at an estimated OCC of 80.5% (as of August 2026, aggregate of 83 ryokan) versus 73.8% for Aug 13. And the weekend date of Saturday, Aug 15 sits at 63.6% — 6.5 points below Saturday, Aug 22 (70.1% at the same cross-section), an ordinary post-Obon Saturday. The same inversion appears at the 41 business hotels: 77.6% for Aug 15 against 84.1% for Aug 22, again a gap of 6.5 points. During Obon week the usual day-of-week shape — in which Saturday is the strongest day of the week — breaks down, and Saturday drops into the lower half of the week for both ryokan and business hotels. That is the skeleton of Saga’s Obon 2026 selling season. Below we lay out the pace of pickup by stay date and by property category, and what it implies for the final ten days.
Scope: 83 ryokan (1,783 rooms), 41 business hotels (4,042 rooms), and 8 city hotels (406 rooms) in Saga Prefecture. Property counts for estimated settled ADR are N=90 ryokan, N=48 business hotels, and N=8 city hotels (July 2026, finalized month). The price metric in this article is estimated settled ADR (the settled price level estimated from OTA and other sales data, tax-exclusive equivalent); occupancy is an estimate based on OTA-listed inventory. Definitions for both appear at the end of the article. Data as of August 8, 2026.
- — The ryokan peak is August 11 (Mountain Day), at an estimated OCC of 80.5% at the 15-days-out cross-section. August 13 sits at 73.8%, so the lineup is not the familiar “Obon peaks on Aug 13” (as of August 2026).
- — Saturday, August 15 — the final weekend of Obon — is at 63.6%, 6.5 points below the ordinary post-Obon Saturday of August 22 (70.1%). Business hotels show the same 6.5-point gap: 77.6% against 84.1%.
- — The peak shifts by two days depending on category. Business hotels and city hotels both top out on August 13 (84.6% and 95.8% at the 15-days-out cross-section) — a different date from the ryokan peak on August 11.
- — Pickup from 45 days out to the latest observation is +21.7 points for ryokan on Aug 11, +10.1 points for ryokan on Aug 15, and +4.5 points for business hotels on Aug 15. The lower the starting point, the more a category moves close in.
- — In actuals for July 2026, Saturday ranked first within the week for all three categories (ryokan 86.8%, business hotels 94.5%). Only during Obon week does the day-of-week ranking invert.
Saga’s Ryokan Peak Falls on August 11 (Mountain Day)
Start with ryokan. The booking curves below overlay, by stay date, the cumulative path of estimated OCC (based on OTA-listed inventory) for 83 ryokan in Saga Prefecture, from 45 days before the stay date through the latest observation. The horizontal axis is days remaining until the stay date; moving right means moving closer to the stay date.
Source: MetroEngines Research; compiled by the HotelBank Editorial Team
The relative position of the four lines is itself the demand ranking. At 45 days out, Aug 11 (65.3%) and Aug 13 (62.0%) sit almost level, with Aug 22 (58.8%) and Aug 15 (56.8%) below them — a spread of 8.5 points across the four. As the stay dates approach, however, the pace of pickup diverges. Aug 11 added +21.7 points between 45 days out and the latest observation (4 days out) to reach 87.0%, while Aug 15 added only +10.1 points over the same span (to 8 days out), ending at 66.9%. The pickup itself differs by more than a factor of two.
Because Mountain Day falls on Tuesday, August 11 in 2026, the calendar produces a four-day break from Saturday, August 8 through Tuesday, August 11 with only Monday off work, and ryokan demand loaded heavily into that first half. Conversely, Saturday, Aug 15 and Sunday, Aug 16 — the back half of Obon — started low at 45 days out and have also grown slowly close in. That is the defining feature of Saga this year.
The table below cuts ryokan pickup at four checkpoints: 45 days out, 30 days out, 15 days out, and the latest observation. The number of observed properties (obs) varies by cross-section, so it is shown in each cell. At 45 and 30 days out in particular, some cross-sections capture only 65 to 76 of the 83 properties; from 15 days out onward all 83 are present. The varying thickness of each cross-section should be kept in mind when reading the table.
| Stay date | 45 days out | 30 days out | 15 days out | Latest obs. | 45 days out → latest |
|---|---|---|---|---|---|
| Aug 11 (Tue, Mountain Day) | 65.3% obs 67 | 73.1% obs 70 | 80.5% obs 77 | 87.0% 4 days out, obs 83 | +21.7pt |
| Aug 12 (Wed) | 64.8% obs 65 | 69.6% obs 69 | 74.3% obs 83 | 80.9% 5 days out, obs 83 | +16.1pt |
| Aug 13 (Thu) | 62.0% obs 72 | 67.0% obs 76 | 73.8% obs 83 | 80.1% 6 days out, obs 83 | +18.1pt |
| Aug 14 (Fri) | 62.6% obs 70 | 63.9% obs 76 | 70.8% obs 83 | 77.0% 7 days out, obs 83 | +14.4pt |
| Aug 15 (Sat) | 56.8% obs 66 | 57.4% obs 76 | 63.6% obs 83 | 66.9% 8 days out, obs 83 | +10.1pt |
| Aug 16 (Sun) | — | 58.1% obs 74 | 63.7% obs 83 | 68.4% 9 days out, obs 83 | — |
| Aug 22 (Sat, control) | 58.8% obs 75 | 64.4% obs 75 | 70.1% obs 83 | 70.1% 15 days out, obs 83 | +11.3pt |
Saga Prefecture — 83 ryokan (1,783 rooms) / estimated OCC (based on OTA-listed inventory) / Source: MetroEngines Research; compiled by the HotelBank Editorial Team
Read the table vertically and the ranking at the identical 15-days-out cross-section is unmistakable. Aug 11 (80.5%) stands out, followed by Aug 12 and Aug 13 (74.3% and 73.8%), then Aug 14 (70.8%) and Aug 22 (70.1%), and finally Aug 15 (63.6%) and Aug 16 (63.7%) together at the bottom. The fact that Aug 15 and Aug 16 — the Obon weekend — sit below Aug 22, an ordinary post-Obon weekend is a signal that pricing and inventory decisions built on the assumption that “Obon is strong” need revisiting. The gap between Aug 15 and Aug 22 is −2.0 points at 45 days out, −7.0 points at 30 days out, and −6.5 points at 15 days out: it has not narrowed across the period. This shape — the back half of Obon falling away while the post-Obon Saturday recovers — is not unique to Saga; the same ordering was confirmed in Shimane Obon 2026: Only Aug 15-16 Dip; Aug 22 Business Hotels 90.9%.
The Peak Shifts by Category — Business and City Hotels Top Out on Aug 13
The next chart places the same seven stay dates side by side across three categories: ryokan, business hotels, and city hotels. For a fair comparison, all figures are estimated OCC at the identical 15-days-out cross-section.
Source: MetroEngines Research; compiled by the HotelBank Editorial Team
The location of the peak differs by category. Ryokan top out on Aug 11 (80.5%), while business hotels peak on Aug 13 (84.6%) and city hotels also on Aug 13 (95.8%). Ryokan draw families and groups into the first half of the long weekend, whereas business and city hotels thicken around Aug 13, the peak of the homecoming travel period. That said, city hotels comprise only 8 properties and 406 rooms in the prefecture (7 properties observed at the 15-days-out cross-section) — a base thin enough that inventory actions at a single property can move the whole figure by several points.
| Stay date | Business 45 days out | Business 15 days out | Business latest obs. | City 15 days out | City latest obs. |
|---|---|---|---|---|---|
| Aug 11 (Tue, Mountain Day) | 76.4% obs 36 | 83.1% obs 37 | 88.5% 4 days out, obs 41 | 91.9% obs 7 | 92.4% 4 days out, obs 8 |
| Aug 12 (Wed) | 78.6% obs 36 | 84.3% obs 41 | 87.4% 5 days out, obs 41 | 92.4% obs 7 | 89.2% 5 days out, obs 8 |
| Aug 13 (Thu) | 76.3% obs 38 | 84.6% obs 41 | 87.2% 6 days out, obs 41 | 95.8% obs 7 | 92.4% 6 days out, obs 8 |
| Aug 14 (Fri) | 78.9% obs 38 | 82.7% obs 41 | 85.0% 7 days out, obs 41 | 92.4% obs 7 | 90.1% 7 days out, obs 8 |
| Aug 15 (Sat) | 75.2% obs 38 | 77.6% obs 41 | 79.7% 8 days out, obs 41 | 88.9% obs 7 | 87.9% 8 days out, obs 8 |
| Aug 16 (Sun) | — | 73.5% obs 41 | 74.9% 9 days out, obs 41 | 82.5% obs 7 | 79.6% 9 days out, obs 8 |
| Aug 22 (Sat, control) | 78.0% obs 38 | 84.1% obs 41 | 84.1% 15 days out, obs 41 | 89.5% obs 7 | 89.5% 15 days out, obs 7 |
Saga Prefecture — 41 business hotels (4,042 rooms) / 8 city hotels (406 rooms; 7 properties and 372 rooms for Aug 22) / estimated OCC (based on OTA-listed inventory) / Source: MetroEngines Research; compiled by the HotelBank Editorial Team
What stands out in the business hotel figures is the 6.5-point gap between Aug 15 (77.6% at 15 days out) and Aug 22 (84.1%). That is almost exactly the gap observed at ryokan (63.6% against 70.1%, 6.5 points) — the shift runs in the same direction across categories. Sunday, Aug 16 sits at 73.5% at 15 days out, widening the gap with Aug 22 to 10.6 points. It is natural to read the back half of Obon as a period when accommodation demand across the prefecture thins out regardless of category. For where Saga sits relative to the other prefectures of Kyushu, Obon T-7: Kyushu’s 31.7pt Gap — Fukuoka 73.0%, Kagoshima 41.3% works through the same question from unsold rooms on a room basis.
There is one more category difference, in headroom for pickup. Between 45 days out and the latest observation, ryokan added +21.7 points on Aug 11, while business hotels added +12.1 points on Aug 11 and only +4.5 points on Aug 15. Business hotels already stood at 75–79% at 45 days out, so their structural room for close-in pickup is small. Ryokan started at 57–65% at 45 days out and move substantially close in. So even where both show “−6.5 points at 15 days out,” ryokan still have room for the curve to steepen, whereas business hotels should be planned on the assumption that only 4 to 5 points will move in the remaining eight days. This relationship — the lower the starting point, the larger the close-in pickup — is also examined by category in Kyoto Obon 2026 Booking Curves: Ryokan Add the Most Close In, +11.4pt.
Day-of-Week Shape and Price Levels — The Week When “Saturday Is Strongest” Breaks Down
To confirm how unusual Obon week is, we aggregated estimated OCC by day of the week from daily actuals for July 2026 (observations taken immediately before each stay date), the most recent completed month.
| Day | Ryokan | Business hotels | City hotels | Days |
|---|---|---|---|---|
| Mon | 72.8% | 85.3% | 86.8% | 4 |
| Tue | 72.5% | 92.0% | 87.5% | 4 |
| Wed | 72.0% | 91.7% | 87.2% | 5 |
| Thu | 71.1% | 92.4% | 90.2% | 5 |
| Fri | 74.8% | 92.5% | 91.7% | 5 |
| Sat | 86.8% | 94.5% | 94.6% | 4 |
| Sun | 80.4% | 83.7% | 86.9% | 4 |
July 2026, Saga Prefecture / day-of-week averages of estimated OCC (based on OTA-listed inventory) / observed properties: 63–84 ryokan, 40–41 business hotels, 8 city hotels / Source: MetroEngines Research; compiled by the HotelBank Editorial Team
In July actuals, Saturday is the highest day of the week for all three categories. Ryokan ran 86.8% on Saturday against 71.1% on Thursday, a 15.7-point spread; business hotels led the week at 94.5% on Saturday; and city hotels likewise led at 94.6%. In other words, in a normal month Saga’s day-of-week shape follows the textbook pattern: Saturday high, weekdays low.
During Obon week, that shape inverts. Ranked at the 15-days-out cross-section, ryokan on Saturday, Aug 15 fall into the bottom group of the seven stay dates, and business hotels on Aug 15 rank fifth of six. The day that should be strongest in the week moves to the weak side for that week alone — that is the reality of the back half of Obon. Demand is consumed early in the first half, which contains the holiday, and from Aug 15 onward homecoming travel turns into the return leg, so accommodation demand drops out.
Next, a price yardstick. The chart below shows the monthly path of estimated settled ADR (tax-exclusive equivalent) for ryokan in Saga Prefecture, with years overlaid. All 12 months of 2025 are finalized; for 2026, months through July are finalized and August onward are current estimates based on present selling conditions (dotted line).
Source: MetroEngines Research; compiled by the HotelBank Editorial Team
Comparing finalized month against finalized month, the year-over-year direction of Saga’s estimated settled ADR splits by category. Ryokan moved from ¥19,261 in July 2025 (N=85 properties) to ¥18,530 in July 2026 (N=90 properties), −3.8%. Business hotels went from ¥6,290 (N=47 properties) to ¥6,338 (N=48 properties), +0.8%, and city hotels from ¥8,920 (N=8 properties) to ¥9,267 (N=8 properties), +3.9%. Ryokan show the weakest ADR growth — and it is ryokan that carry the occupancy dip in the back half of Obon. That overlap is the structure of Saga this year.
| Category | July 2025 (finalized) | July 2026 (finalized) | YoY | August 2026 (current estimate) |
|---|---|---|---|---|
| Ryokan | ¥19,261 N=85 | ¥18,530 N=90 | −3.8% | ¥18,416 N=91 |
| Business hotels | ¥6,290 N=47 | ¥6,338 N=48 | +0.8% | Awaiting finalization |
| City hotels | ¥8,920 N=8 | ¥9,267 N=8 | +3.9% | Awaiting finalization |
Saga Prefecture — monthly estimated settled ADR (tax-exclusive equivalent) / N = number of properties covered by the estimated settled ADR / August 2026 is a current estimate based on present selling conditions; a direct comparison against finalized values should wait for month-end finalization / Source: MetroEngines Research; compiled by the HotelBank Editorial Team
Note that the August 2026 estimated settled ADR for ryokan is ¥18,400 (N=91 properties), but this is a current estimate based on present selling conditions and may move within the month. A direct comparison against the finalized August 2025 figure (¥21,546, N=86 properties) should wait for month-end finalization. Here it serves only as a yardstick for the general level of the month of August.
For Revenue Managers Running Ryokan and Business Hotels in Saga — Implications and an Action Plan
(1) Break the assumption that “all Obon days are peak days” down date by date. At the market’s 15-days-out cross-section, ryokan run 80.5% on Aug 11 and 63.6% on Aug 15 — a 16.9-point spread. If your own bookings, laid out by date, show Aug 11–13 building in line with the market while only Aug 15 and Aug 16 stay thin, that is likely the shape of the whole market rather than a problem specific to your property. Conversely, if your fill on Aug 11–13 is not keeping up with the market’s pace of pickup, that is where to look at property-specific factors first.
(2) Holding a control date reduces noise in your judgment. At the same 15-days-out cross-section, Saturday, Aug 22 runs 70.1% for ryokan and 84.1% for business hotels, and Aug 15 sits 6.5 points below on both. If you can confirm the same relationship — an Obon Saturday weaker than an ordinary Saturday — at your own property, that gives you grounds not to treat unsold rooms on Aug 15 the way you would an ordinary weekend. The contrast with July actuals, where Saturday led the week (ryokan 86.8%, business hotels 94.5%), can be measured on the same yardstick.
(3) How much you can move depends on the days remaining. Ryokan move substantially close in — +21.7 points on Aug 11 and +10.1 points on Aug 15 from 45 days out to the latest observation — while business hotels on Aug 15 have limited headroom at +4.5 points. It is worth designing the time axis separately: ryokan as a space where close-in measures can be expected to work, business hotels as one where the shape is largely set at an earlier stage.
(4) Discuss the price lever at the monthly level. On a finalized-month basis, Saga’s ryokan are at −3.8% year over year (July 2026), the weakest ADR growth of the three categories. The monthly level for August is currently estimated at ¥18,400 (N=91 properties). Before moving prices sharply on a daily basis to fill the occupancy dip, first establish where your own monthly average rate sits against this market level, and then set priorities against non-price measures.
Below is an action plan with decision triggers tied to the data in this article. It guarantees no outcome; each item is offered as a starting point for consideration.
| Time frame | Measure | Decision trigger (figures from this article) | Aim |
|---|---|---|---|
| Today–Aug 15 (final 10 days) | Revisit consecutive-night restrictions and minimum-stay conditions on Aug 15 and Aug 16 to secure capacity for one-night stays | If your fill on Aug 15 remains below the market’s 15-days-out cross-section (ryokan 63.6% / business hotels 77.6%) | Avoid losing one-night guests once the multi-night demand of the first three days runs out |
| Today–Aug 15 | Rebalance inventory and exposure across sales channels away from an Aug 11–13 emphasis toward Aug 15 and Aug 16 | If the market’s Aug 15-to-Aug 22 gap (6.5 points at 15 days out in both categories) is reproduced at your property | Concentrate exposure on thin-demand dates and increase the chances of reaching guests still deciding |
| Today–Aug 15 | Foreground stay-length value such as late check-out and early check-in, limited to Aug 15 and Aug 16 | Given that business hotels on Aug 15 have added a limited +4.5 points through the latest observation | Add a reason to be chosen without breaking rate |
| Aug 16–Aug 22 (control week) | Record the two-week build for Aug 22 (an ordinary Saturday) daily, alongside the market cross-section | The market’s Aug 22 stands at 70.1% for ryokan and 84.1% for business hotels at 15 days out. Compare pickup from there against your own | Establish a “standard ordinary-weekend curve” as your own benchmark |
| Aug 16–Aug 22 | Re-record daily Obon-week actuals in a form centered on Aug 11 as the peak, and keep it as material for considering next year’s calendar | Starting from the fact that the ryokan peak (Aug 11, 80.5%) and the business/city hotel peak (Aug 13, 84.6% / 95.8%) fell on different dates | Leave behind a format usable in years when the holiday falls on a different weekday |
| Toward September | Compare your own monthly average rate against the monthly level of the market’s estimated settled ADR, and check the room to revise the pricing calendar | Ryokan are at −3.8% year over year on a finalized-month basis (July 2026, N=90 properties). The current estimate for August is ¥18,400 (N=91 properties) | Avoid filling the occupancy dip through rate cuts alone |
Source: MetroEngines Research; compiled by the HotelBank Editorial Team
Restating the Dip in Rooms — How Many Rooms Is 6.5 Points per Night?
Every figure so far has been a ratio. Restating the same numbers in rooms shows how much capacity is left to fill over the final ten days. Rearranging this article’s metric definition — estimated OCC = 100 − 100 × OTA-listed unsold rooms ÷ total rooms — gives estimated rooms sold = total rooms × estimated OCC, with the difference being estimated unsold rooms. The values below are not a demand forecast; they are simply a unit conversion of the room counts and estimated OCC already presented in the text, with no new observations or assumptions added.
| Category (total rooms) | Aug 11 (Tue, Mountain Day) Est. OCC / rooms sold / unsold |
Aug 22 (Sat, post-Obon control) Est. OCC / rooms sold / unsold |
Aug 15 (Sat, back-half dip) Est. OCC / rooms sold / unsold |
|---|---|---|---|
| Ryokan 1,783 rooms |
80.5% 1,435 rooms / 348 unsold |
70.1% 1,250 rooms / 533 unsold |
63.6% 1,134 rooms / 649 unsold |
| Business hotels 4,042 rooms |
83.1% 3,359 rooms / 683 unsold |
84.1% 3,399 rooms / 643 unsold |
77.6% 3,137 rooms / 905 unsold |
| City hotels 406 rooms |
91.9% 373 rooms / 33 unsold |
89.5% 333 rooms / 39 unsold 372 rooms in scope |
88.9% 361 rooms / 45 unsold |
Source: MetroEngines Research; compiled by the HotelBank Editorial Team
Aug 15 in the back half of Obon and Aug 22 after Obon were both 6.5 points apart at the 15-days-out cross-section. Converted into rooms, ryokan unsold inventory rises from 533 to 649 rooms — 116 rooms — and business hotels from 643 to 905 rooms, 262 rooms. Together that is roughly 378 rooms per night left over relative to an ordinary Saturday. For the same 6.5 points, business hotels — with a stock of 4,042 rooms — are 2.3 times larger in room terms. In ratio terms the ryokan dip looks deeper, but the absolute number of rooms to be filled accumulates on the side holding the business-oriented inventory.
| Total rooms | 63.6% Ryokan Aug 15 |
70.1% Ryokan Aug 22 |
77.6% Business Aug 15 |
84.1% Business Aug 22 |
87.0% Ryokan Aug 11, latest |
|---|---|---|---|---|---|
| 372 rooms City hotels, 7 properties |
135 rooms | 111 rooms | 83 rooms | 59 rooms | 48 rooms |
| 406 rooms City hotels, 8 properties |
148 rooms | 121 rooms | 91 rooms | 65 rooms | 53 rooms |
| 1,783 rooms Ryokan, 83 properties |
649 rooms | 533 rooms | 399 rooms | 283 rooms | 232 rooms |
| 4,042 rooms Business hotels, 41 properties |
1,471 rooms | 1,209 rooms | 905 rooms | 643 rooms | 525 rooms |
| 6,231 rooms All three categories |
2,268 rooms | 1,863 rooms | 1,396 rooms | 991 rooms | 810 rooms |
Source: MetroEngines Research; compiled by the HotelBank Editorial Team
Read the grid horizontally: as estimated OCC moves from 63.6% to 87.0% at a fixed room count, unsold rooms fall from 649 to 232 at ryokan scale (1,783 rooms), a change of 417 rooms, and from 1,471 to 525 at business hotel scale (4,042 rooms), a change of 946 rooms. Read it vertically and unsold rooms scale directly with room stock even at identical estimated OCC. Designing close-in measures around “how many rooms to sell, and to whom” rather than “how many points to add” comes closer to an honest estimate of the effort required.
Summary — Three Yardsticks for Measuring Saga’s Obon
First, the location of the peak. In Saga in 2026, ryokan peaked on Aug 11 (Mountain Day, Tuesday) at 80.5% at 15 days out, while business hotels and city hotels peaked on Aug 13 at 84.6% and 95.8% respectively. Rather than “Obon peaks uniformly around Aug 13,” the strongest day differs by two days depending on category. Begin by checking which shape your own category resembles.
Second, the depth of the dip. Saturday, Aug 15 — the final weekend of Obon — came in at 63.6% for ryokan and 77.6% for business hotels (both at the 15-days-out cross-section), 6.5 points below the ordinary post-Obon Saturday of Aug 22 (70.1% and 84.1%) in both cases. Given that Saturday led the week in July actuals (ryokan 86.8%, business hotels 94.5%), the day-of-week ranking is reversed for this week alone.
Third, how much can move. Pickup from 45 days out to the latest observation varied widely by category and by date: +21.7 points for ryokan on Aug 11, +10.1 points for ryokan on Aug 15, and +4.5 points for business hotels on Aug 15. Understanding how much a market moves relative to the days remaining, and then deciding what to stake on close-in measures — that is a way of thinking that carries over to designing any peak period, not just Obon.
About the Data
| Definition of estimated OCC | Occupancy based on OTA-listed inventory = 100 − 100 × OTA-listed unsold rooms ÷ total rooms. It is an estimate based on how far inventory offered on OTAs has been sold down, and its definition differs from actual room occupancy (it reads higher). This article labels it “estimated OCC (based on OTA-listed inventory).” |
| Booking curves | Based on observations from 45 days before the stay date through the latest observation. Scope covers stays on August 11–16, 2026 plus the control date of August 22. Because the latest observation sits at a different number of days out for each stay date, the days remaining are shown in each table. The number of observed properties (obs) varies by cross-section (63–83 of 83 ryokan, 36–41 of 41 business hotels, 7–8 of 8 city hotels). Cross-sections with extremely few observed properties are excluded from the charts. |
| Definition of estimated settled ADR | The settled price level (tax-exclusive equivalent) estimated from OTA and other sales data (lowest-plan level × category coefficient, ensembled across multiple channels). Past months are finalized values; the current and future months are estimates based on present selling conditions. Median error against published operating results is 6.6%. |
| Breakdown of property counts | Booking curves: 83 ryokan (1,783 rooms), 41 business hotels (4,042 rooms), and 8 city hotels (406 rooms; 7 properties and 372 rooms for August 22 only) in Saga Prefecture. Estimated settled ADR: ryokan N=90 properties (July 2026 finalized) and N=91 properties (August 2026 estimate), business hotels N=48 properties (July 2026 finalized), city hotels N=8 properties (July 2026 finalized). Day-of-week aggregation: daily actuals for July 2026, with observed properties of 63–84 ryokan, 40–41 business hotels, and 8 city hotels. |
| Data as of | Data as of August 8, 2026. Selling conditions and inventory change daily, so the figures in this article are a snapshot at the time of retrieval. |
References and Sources
■ Data sources
Pickup by stay date (45 days out, 30 days out, 15 days out, latest observation) and the day-of-week levels for July 2026 are our own aggregation based on daily observation of OTA-listed inventory within Saga Prefecture. Scope covers 83 ryokan / 1,783 rooms, 41 business hotels / 4,042 rooms, and 8 city hotels / 406 rooms (7 properties and 372 rooms for city hotels on August 22 only). Estimated settled ADR uses monthly series by category (ryokan N=90 properties, business hotels N=48 properties, city hotels N=8 properties, all for the finalized month of July 2026). Public holiday dates were confirmed against the Cabinet Office’s “National Holidays.” Data as of August 8, 2026.
■ Calculation assumptions
The room counts in the section “Restating the Dip in Rooms” are a unit conversion from estimated rooms sold = total rooms × estimated OCC, obtained by rearranging the article’s metric definition (estimated OCC = 100 − 100 × OTA-listed unsold rooms ÷ total rooms); they are not a demand forecast. The only inputs are the room counts and estimated OCC presented in the text, and both the rows of the conversion grid (372 / 406 / 1,783 / 4,042 / 6,231 rooms) and its columns (63.6 / 70.1 / 77.6 / 84.1 / 87.0%) are confined to levels that appear in the text, with no extrapolation beyond the observed range. Room counts are rounded in each cell, so totals may differ slightly from the sum of their parts. Year-over-year changes are calculated using estimated settled ADR for finalized months only.
■ Limitations and caveats
Estimated OCC is an estimate based on OTA-listed inventory, and its definition differs from actual room occupancy (it reads higher). The number of observed properties varies by cross-section; at 45 and 30 days out, some cross-sections cover only 65–76 of the 83 ryokan and 36–38 of the 41 business hotels. The 45-days-out cross-section for business hotels on August 16 was excluded from comparison because only one property was observed. City hotels comprise a thin base of 8 properties and 406 rooms in the prefecture, so inventory actions at a single property can move the whole figure by several points. Estimated settled ADR has a median error of 6.6% against published operating results, and the August 2026 figure is an estimate based on present selling conditions that will move within the month. Inventory and selling conditions change daily, so the figures in this article are a snapshot as of August 8, 2026.
• Cabinet Office of Japan, “National Holidays,” list of public holidays (August 11, 2026 = Mountain Day)
https://www8.cao.go.jp/chosei/shukujitsu/gaiyou.html
• Accommodation demand pickup and estimated settled ADR: MetroEngines Research
Related Reading
- Obon T-7: Kyushu’s 31.7pt Gap — Fukuoka 73.0%, Kagoshima 41.3%
- Shimane Obon 2026: Only Aug 15-16 Dip; Aug 22 Business Hotels 90.9%
- Wakayama Obon 2026: Aug 13 Peaks 94.9%, Aug 15 Ryokan Stuck at 73.2%
- Kyoto Obon 2026 Booking Curves: Ryokan Add the Most Close In, +11.4pt
- Yamanashi Obon: Ryokan Gain Only +1.1pt, Business Hotels +7.9pt
- Hokkaido City Hotels: Only Aug 15 Trails at 78.7% OCC, 45 Days Out
- Okayama Booking Curves: 3 Checkpoints, Aug 8 Late-Surges +11.8pt