

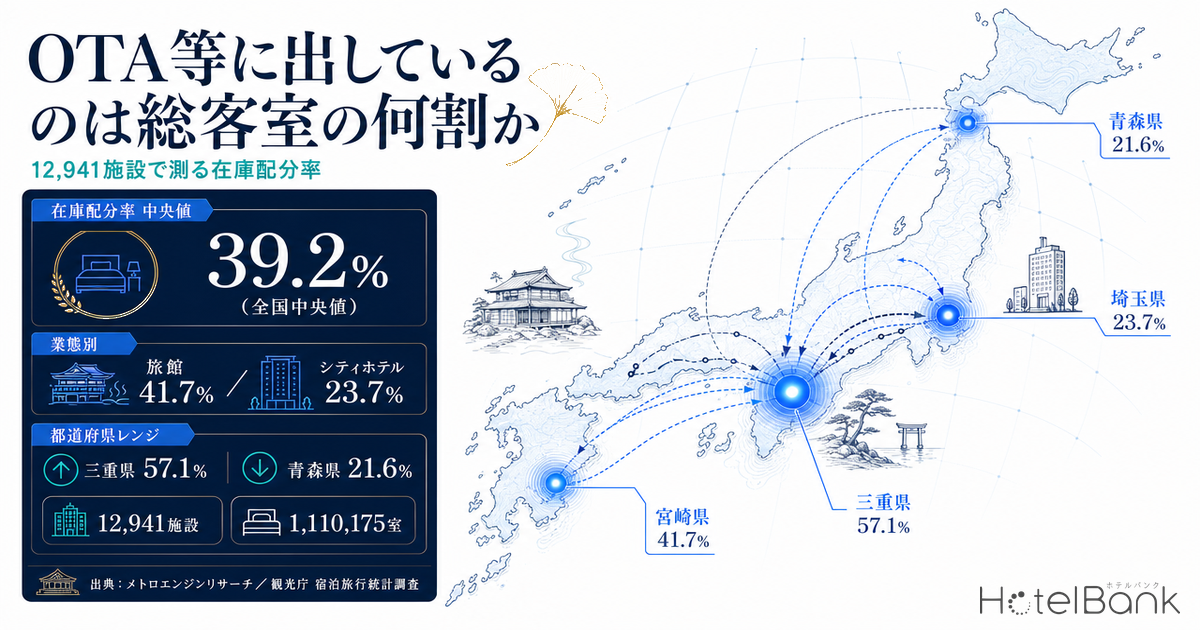
Hotel inventory data has, until now, been used to answer essentially one question: when did it sell out? Turn the same data over, however, and it answers something entirely different — what share of its total rooms is a property actually placing in online distribution? Using inventory observation data covering 12,941 properties and 1,110,175 rooms nationwide, this article calculates an “inventory allocation ratio” and quantifies how sharply that design differs by property type, region, and scale.
Metric Definitions Used in This Article
- Inventory allocation ratio: The maximum number of bookable rooms simultaneously visible on online distribution during the observation window ÷ the property’s total room count (%). Calculated on a room basis; plan counts are not used. It is a lower bound on the room capacity assigned to online distribution, and serves as a proxy for inferring the share a property allocates to direct booking on its official website, corporate contracts, travel agencies, and other channels. Observations exceeding 100% (inconsistency with the total-room master) are excluded.
- LT (lead time): Days remaining until the check-in date. LT0 = same day. Observations in this article are limited to lead times within 90 days.
- ADR (average daily rate): An estimated settled rate (tax-exclusive equivalent) calculated by applying property-type correction coefficients to the lowest published plan level on each property’s online distribution (two guests per room, per-room rate, tax included). Cross-checked against property-level results disclosed by listed hotel REITs, the median error is approximately 7%. It is an estimate and differs from each property’s actual transaction prices and accounting figures. Area-level ADR is the median of the properties covered (the level of a typical property in that area).
- Room occupancy rate: Figures described in this article as “actual occupancy” are 2025 annual values (final) from the Japan Tourism Agency’s Overnight Travel Statistics Survey. They are not our own estimates.
- Data sources: MetroEngines Research / Japan Tourism Agency, Overnight Travel Statistics Survey
- — Across 12,941 properties and 1,110,175 rooms nationwide, the median inventory allocation ratio calculated from inventory observations is 39.2%. With 11.8% of properties in the 0–10% band and 7.7% in the 90–100% band, there is no level that could be called an industry-standard allocation.
- — The gap between property types is 18.0pt. Ryokan are highest at 41.7% (N=5,126) and city hotels lowest at 23.7% (N=546). City hotels build actual occupancy of 74.1% (2025 annual final) outside the publicly visible allocation.
- — Regional spread is 35.5pt across prefectures (Mie 57.1% to Aomori 21.6%) and 40.4pt across municipalities (Hamamatsu Chuo-ku 57.6% to Nagasaki 17.2%) — tracking neither the major-metro/regional divide nor city size.
- — “The tighter the market, the higher the rate” does not hold. Rank correlation with estimated settled ADR is −0.248 for business hotels, +0.304 for ryokan, and −0.094 combined — essentially no correlation. Allocation is not a dependent variable of rate.
- — A stable negative relationship with room scale (19 rooms or fewer 50.0% / 200 rooms or more 29.8%). Ordinary weekdays run 10.7pt higher than the long-weekend Saturday, so the figures here must be read as a lower bound on allocation.
The Allocation Variable Hiding Behind Sellouts
Coverage tracking remaining-room data has multiplied over the past year. But an observation such as “zero rooms left 60 days out” only means something if you also know how many rooms that property had placed in online distribution to begin with. A property with 180 total rooms selling out the 8 it listed is a completely different demand signal from one that listed 150 and sold out. For a demand-side reading of the same room-level inventory observations, see Tokyo Aug 14: 434 Hotels, Front-Loaded 10.8% vs Late-Surge 9.4%.
This article therefore extracts a different quantity from the same room-level inventory observations used for sellout detection: the maximum number of bookable rooms simultaneously visible on online distribution throughout the observation window, divided by the property’s total room count. We call this the inventory allocation ratio. The higher the figure, the heavier the tilt toward online distribution; the lower it is, the greater the weight of other channels such as direct, corporate, and travel agency sales.
Aggregating 12,941 properties and 1,110,175 total rooms nationwide, the median inventory allocation ratio was 39.2%. The distribution is not concentrated: 11.8% of properties fall in the 0–10% band and 7.7% in the 90–100% band. There is no such thing as an industry-standard allocation — the first observation is that design varies enormously from property to property.
Source: MetroEngines Research; compiled by the HotelBank Editorial Team
Allocation Design Splits by Property Type — Ryokan 41.7%, City Hotels 23.7%
By property type, the median is highest for ryokan at 41.7% (N=5,126), followed by business hotels at 39.0% (N=6,182). The lowest is city hotels at 23.7% (N=546), an 18.0pt gap from ryokan.
Overlaying the 2025 annual final figures from the Japan Tourism Agency’s Overnight Travel Statistics Survey sharpens the outline. City hotels post actual occupancy of 74.1%, high among property types, yet the rooms simultaneously visible in online distribution amount to less than a quarter of their total. A substantial share of the rooms being filled moves without passing through publicly visible online allocation. The characteristics of a segment with deep traditional sales channels — banquet- and wedding-linked stays, corporate contracts, MICE, travel agency blocks — show up directly in how its inventory looks.
Ryokan present the opposite picture. Their actual occupancy of 38.2% (2025 annual final / Japan Tourism Agency, Overnight Travel Statistics Survey) is the lowest of any type, yet their inventory allocation ratio is the highest. Many are small properties that struggle to maintain an in-house sales organization, which makes a design that entrusts a large share of inventory to online distribution more likely. Occupancy and allocation lining up in opposite directions shows plainly that allocation reflects not whether rooms sell, but where they are sold.
Source: MetroEngines Research; compiled by the HotelBank Editorial Team
| Property type | Properties analyzed | Median allocation | 1st quartile | 3rd quartile | Share below 10% | Share at 50% or above | Actual occupancy (2025) |
|---|---|---|---|---|---|---|---|
| Ryokan | 5,126 | 41.7% | 22.9% | 65.9% | 7.9% | 42.6% | 38.2% |
| Business hotels | 6,182 | 39.0% | 16.7% | 70.0% | 14.3% | 40.7% | 75.3% |
| Resort hotels | 1,049 | 35.3% | 18.4% | 62.5% | 10.8% | 35.7% | 56.9% |
| City hotels | 546 | 23.7% | 11.7% | 46.0% | 20.7% | 22.2% | 74.1% |
| Deluxe hotels | 38 | 17.0% | 10.8% | 36.1% | 21.1% | 10.5% | — |
Source: MetroEngines Research / Japan Tourism Agency, Overnight Travel Statistics Survey, 2025 annual values (final); compiled by the HotelBank Editorial Team
Prefecture Map — Business Hotel Allocation Spans 21.6% to 57.1%
Aggregating business hotels (N=6,182), the largest group, by prefecture, medians range from a high of 57.1% in Mie to a low of 21.6% in Aomori — a 35.5pt spread. The map below places a circle at each prefecture’s center point, with color showing the allocation band and size showing the number of properties analyzed. Prefecture labels on the map are in Japanese.
Source: MetroEngines Research; compiled by the HotelBank Editorial Team
What the map shows is that high and low allocation ratios do not map cleanly onto city size or the major-metro/regional divide. Even within the three major metropolitan areas, Saitama at 51.5% and Aichi at 33.5% differ by 18.0pt, and among regional prefectures Miyazaki at 53.0% and Aomori at 21.6% sit at opposite poles. Allocation measured at the prefecture level appears to reflect which sales channels the properties clustered in that area have built their business around, rather than the size of the market.
High and Low Markets — Prefectures and Municipalities
Source: MetroEngines Research; compiled by the HotelBank Editorial Team
| Prefecture | Properties analyzed | Median allocation | 1st quartile | 3rd quartile | Median room count | Estimated settled ADR |
|---|---|---|---|---|---|---|
| Mie | 82 | 57.1% | 30.0% | 81.2% | 108 rooms | ¥7,031 |
| Miyazaki | 70 | 53.0% | 21.4% | 81.2% | 82 rooms | ¥6,025 |
| Saitama | 118 | 51.5% | 26.3% | 78.6% | 98 rooms | ¥7,628 |
| Gunma | 88 | 50.0% | 20.0% | 84.7% | 70 rooms | ¥6,465 |
| Ehime | 87 | 50.0% | 26.2% | 81.1% | 91 rooms | ¥5,888 |
| Nara | 29 | 48.0% | 21.1% | 73.3% | 131 rooms | ¥8,647 |
| Yamanashi | 59 | 48.0% | 20.0% | 78.5% | 63 rooms | ¥7,900 |
| Tottori | 42 | 47.8% | 23.0% | 71.7% | 80 rooms | ¥5,934 |
| Yamagata | 49 | 46.4% | 15.3% | 70.4% | 100 rooms | ¥6,650 |
| Oita | 75 | 44.4% | 19.3% | 73.7% | 91 rooms | ¥6,299 |
| Prefecture | Properties analyzed | Median allocation | 1st quartile | 3rd quartile | Median room count | Estimated settled ADR |
|---|---|---|---|---|---|---|
| Ishikawa | 94 | 35.5% | 14.4% | 70.5% | 106 rooms | ¥7,769 |
| Fukui | 38 | 35.1% | 18.7% | 71.7% | 120 rooms | ¥7,614 |
| Iwate | 73 | 34.0% | 14.3% | 65.0% | 109 rooms | ¥6,277 |
| Aichi | 269 | 33.5% | 14.7% | 63.0% | 128 rooms | ¥7,837 |
| Gifu | 97 | 33.3% | 19.4% | 67.9% | 81 rooms | ¥7,409 |
| Shizuoka | 197 | 33.3% | 18.1% | 72.9% | 102 rooms | ¥7,135 |
| Shiga | 69 | 32.7% | 15.9% | 61.7% | 82 rooms | ¥7,343 |
| Miyagi | 119 | 30.0% | 15.4% | 67.8% | 120 rooms | ¥7,572 |
| Hokkaido | 357 | 29.4% | 12.9% | 60.3% | 98 rooms | ¥8,858 |
| Aomori | 72 | 21.6% | 8.8% | 56.2% | 112 rooms | ¥6,930 |
Source: MetroEngines Research; compiled by the HotelBank Editorial Team
Drop down to the municipal level and the gap widens further. Among the 45 municipalities with 25 or more properties analyzed (business hotels), the highest is Hamamatsu Chuo-ku (the former Naka-ku area) at 57.6% (N=28) and the lowest is Nagasaki at 17.2% (N=30). Central business districts in major cities — Hakata-ku in Fukuoka at 27.6% (N=119), Kita-ku in Osaka at 26.7% (N=47), Chuo-ku in Kobe at 25.1% (N=37) — all sit near the bottom.
What deserves care here is that a low allocation ratio cannot be pinned on a single cause. All the public online data tells us is that the visible allocation is small, and there are at least three possible explanations behind it. First, operations built around channels other than public online distribution — direct booking on the official website, corporate contracts, travel agencies. Second, inventory control that withholds the full room count and adds rooms in small increments as check-in approaches. Third, cases where the allotment assigned to online distribution is contractually set low to begin with. The tendency for low allocation ratios to cluster in office districts can be explained equally well by deep corporate demand or by incremental inventory release. A small number of remaining rooms means rooms remaining within the public allocation, not that the property as a whole is full — also worth keeping in mind. Read alongside Obon T-7: Kyushu’s 31.7pt Gap — Fukuoka 73.0%, Kagoshima 41.3%, which tracks how inventory is actually absorbed at the area level, and the distance between how remaining rooms look and how allocation is designed becomes easier to grasp.
| Municipality | Properties analyzed | Median allocation | |
|---|---|---|---|
| High | Hamamatsu Chuo-ku / former Naka-ku (Shizuoka) | 28 | 57.6% |
| High | Naniwa-ku, Osaka (Osaka) | 39 | 56.5% |
| High | Matsuyama (Ehime) | 30 | 55.2% |
| High | Iwaki (Fukushima) | 33 | 55.2% |
| High | Chuo-ku, Niigata (Niigata) | 31 | 52.6% |
| High | Hakodate (Hokkaido) | 45 | 49.4% |
| High | Miyazaki City (Miyazaki) | 30 | 45.7% |
| High | Kagoshima City (Kagoshima) | 51 | 44.8% |
| Low | Shimogyo-ku, Kyoto (Kyoto) | 94 | 28.6% |
| Low | Naka-ku, Hiroshima (Hiroshima) | 48 | 28.5% |
| Low | Hakata-ku, Fukuoka (Fukuoka) | 119 | 27.6% |
| Low | Kita-ku, Osaka (Osaka) | 47 | 26.7% |
| Low | Takamatsu (Kagawa) | 49 | 25.8% |
| Low | Chuo-ku, Kobe (Hyogo) | 37 | 25.1% |
| Low | Yodogawa-ku, Osaka (Osaka) | 27 | 24.3% |
| Low | Nagasaki City (Nagasaki) | 30 | 17.2% |
Source: MetroEngines Research; compiled by the HotelBank Editorial Team
Ryokan reveal the character of their markets even more starkly. Onsen destinations near the Tokyo metropolitan area occupy the top of the table — Ito 60.0% (N=55), Nasushiobara 60.0% (N=37), Izu 57.1% (N=43), Yugawara 56.4% (N=44) — while Takayama 27.5% (N=74) and Fujikawaguchiko 24.6% (N=30) sit at the bottom. The destinations at the top are catchment areas that draw heavily on individual bookings; those at the bottom are markets with a traditionally deep multi-channel mix, including inbound individual and group business.
| Municipality | Properties analyzed | Median allocation | |
|---|---|---|---|
| High | Ito (Shizuoka) | 55 | 60.0% |
| High | Nasushiobara (Tochigi) | 37 | 60.0% |
| High | Izu (Shizuoka) | 43 | 57.1% |
| High | Yugawara (Kanagawa) | 44 | 56.4% |
| High | Shirahama (Wakayama) | 27 | 55.6% |
| High | Izunokuni (Shizuoka) | 29 | 53.8% |
| High | Kaga (Ishikawa) | 38 | 51.5% |
| High | Yufu (Oita) | 102 | 50.0% |
| Low | Tsuruoka (Yamagata) | 28 | 33.3% |
| Low | Matsumoto (Nagano) | 50 | 32.6% |
| Low | Minamioguni (Kumamoto) | 42 | 32.4% |
| Low | Matsue (Shimane) | 25 | 31.6% |
| Low | Matsuyama (Ehime) | 30 | 29.0% |
| Low | Nakanojo (Gunma) | 27 | 27.8% |
| Low | Takayama (Gifu) | 74 | 27.5% |
| Low | Fujikawaguchiko (Yamanashi) | 30 | 24.6% |
Source: MetroEngines Research; compiled by the HotelBank Editorial Team
“The Tighter the Market, the Higher the Rate” Does Not Hold
The initial hypothesis was a straightforward one: properties able to restrict their public online allocation should be facing stronger demand and commanding higher rates. Testing prefecture × property-type medians against estimated settled ADR, the hypothesis was not supported.
Across the 47 prefectures of business hotels, the rank correlation stops at −0.248, a weak negative relationship, while across the 46 prefectures of ryokan it flips to a weak positive +0.304. Combined, the two come to −0.094 — essentially no correlation. In other words, there is no consistent direction between allocation ratio and rate level.
Individual cases do not line up either. Among business hotels, Tokyo at an estimated settled ADR of ¥14,500 sits at 37.7% and Kyoto, also at ¥14,500, at 36.4% — both near the national median — while Mie at around ¥7,000 tops the table at 57.1%. Among ryokan, Kyoto at an estimated settled ADR of ¥21,600 is at 40.0% and Kanagawa at ¥20,300 at 41.7%, both mid-table, while Tokushima at ¥7,200 stands near the top at 60.0%. The inventory allocation ratio is not a dependent variable of rate level; it is an independent management decision in its own right — that is the natural reading.
Source: MetroEngines Research; compiled by the HotelBank Editorial Team
The Smaller the Property, the Thicker the Public Allocation
Cut by room scale and a more stable relationship appears. Properties with 19 rooms or fewer show a median inventory allocation ratio of 50.0% (N=3,597), against 29.8% for those with 200 rooms or more (N=1,416). The larger the property, the lower the share placed in public allocation.
Large properties are more likely to have their own sales organization, corporate contracts, and annual agreements with travel agencies, giving them more room to spread inventory across channels. Small properties, constrained by sales resources, tend to depend more heavily on online distribution. That said, the 100–199 room band at 37.3% exceeds the 50–99 room band at 33.8%, so the decline is not monotonic. Looking at business hotels alone, the 100–199 room band is at 40.0%; this size band contains many nationally expanding chain properties, and standardized channel operations may be lifting the allocation ratio.
Source: MetroEngines Research; compiled by the HotelBank Editorial Team
Demand Dates Change the Picture — Measuring the Metric’s Limits
The metric has a structural weakness. What can be observed is the inventory visible at that point in time; rooms sold before observation begins (90 days of lead time) are not included. On stronger demand dates, the allocation ratio should therefore look smaller than it really is.
This article therefore observed two check-in dates with different demand characteristics, independently. One is Saturday, September 19, 2026 — the first day of a three-day weekend that includes Respect for the Aged Day. The other is Tuesday, October 6, 2026 — an ordinary weekday with no public holiday. Comparing the same set of properties, the weekday median came out higher by +10.7pt for business hotels, +6.3pt for ryokan, and +5.7pt for city hotels. In 86.0% of all 114 groups, the weekday side was higher.
The largest gap is among business hotels (long-weekend Saturday 20.7% → weekday 31.4%), quantifying how much the demand pressure of a holiday weekend shrinks the visible allocation. Resort hotels, by contrast, differed by only +2.8pt — a relatively muted change in how inventory appears across demand dates.
The headline figures in this article are estimates that take, for each property, the higher of these two dates. The allocation ratios shown are therefore a lower bound on actual online allocation, and true allotments will be higher. Rankings and comparisons between property types are stable enough, but readers should note that the absolute levels come out conservative.
Source: MetroEngines Research; compiled by the HotelBank Editorial Team
How Far Can Allocation Be Moved — Implications for Practice
Allocation is one of the few structural variables a property can set for itself. Three practical points follow.
1. Locate your own property within the distribution for its type and market. The intuition that “we may be putting too much online” can be tested by lining it up against the 1st and 3rd quartiles for the same property type and market. For business hotels overall, the 1st quartile is 16.7% and the 3rd quartile 70.0%; where a property sits within that range changes the starting point of the discussion. Properties above the 3rd quartile are worth examining for whether the demand generation gained from a thick public allocation balances against the commission burden.
2. A low allocation ratio can itself be an asset. The city hotel median of 23.7% shows that a segment genuinely exists that builds actual occupancy of 74.1% (2025 annual final / Japan Tourism Agency, Overnight Travel Statistics Survey) without relying on public allocation. Corporate contracts and long-term trading relationships cannot be built quickly, which is precisely why they are less exposed to price competition. Properties already achieving high occupancy on a low allocation ratio have a strong rationale for investing in maintaining and expanding those channels. A separate question, beyond the scope of this article, is how deliberately capping the number of rooms sold relates to the quality of occupancy.
3. Properties with high allocation ratios have room to add channels. High allocation among small properties and regional ryokan reflects the practical constraint of sales resources. What matters here is that reducing the public allocation is not itself the goal. By building out the booking path on the official website and running membership programs for repeat guests, room opens up to diversify the channel mix while holding occupancy steady. Properties at 50% or above account for 40.7% of business hotels, and that layer structurally retains upside from strengthening direct sales.
Allocation is also a variable that can be moved by season and day of week. As the comparison between the long-weekend Saturday and the ordinary weekday shows, the stronger the demand, the faster the public allocation disappears. Varying allocation itself between peak and soft dates — holding back a thicker direct and repeat-guest allocation on strong days, widening the public allocation on weak ones — remains untouched territory at many properties.
Methodology and Data Coverage
The scope of this analysis is domestic properties whose inventory MetroEngines Research tracks over time, across five property types: business hotels, ryokan, resort hotels, city hotels, and deluxe hotels. The coverage universe (properties eligible for inventory tracking) is 34,112; of these, inventory data was actually obtained for 14,397 (42%) for check-in dates of September 19 or October 6, 2026. After further excluding properties with fewer than 20 observation days and those whose allocation ratio exceeded 100% due to inconsistency with the total-room master, 12,941 properties were analyzed.
Because prefecture-level aggregation alone runs into a population ceiling, prefectures with large property counts were all re-retrieved split by municipality, and for major city centers that still hit the ceiling, retrieval was run under multiple conditions varying the allocation band and sort order, with duplicates removed. Tokyo business hotels, for example, break down as a coverage universe of 1,532 properties, inventory data obtained for 862, and 781 analyzed.
| Prefecture | Property type | Coverage universe | Inventory data obtained | Analyzed | Retrieval rate |
|---|---|---|---|---|---|
| Kyoto | City hotels | 87 | 56 | 55 | 64% |
| Kyoto | Business hotels | 765 | 292 | 269 | 38% |
| Kyoto | Ryokan | 467 | 168 | 144 | 36% |
| Hokkaido | City hotels | 109 | 75 | 73 | 69% |
| Hokkaido | Business hotels | 902 | 384 | 357 | 43% |
| Hokkaido | Ryokan | 861 | 262 | 241 | 30% |
| Osaka | City hotels | 139 | 92 | 91 | 66% |
| Osaka | Business hotels | 969 | 455 | 419 | 47% |
| Osaka | Ryokan | 122 | 29 | 28 | 24% |
| Aichi | Business hotels | 537 | 283 | 269 | 53% |
| Aichi | Ryokan | 323 | 118 | 100 | 37% |
| Tokyo | City hotels | 170 | 101 | 100 | 59% |
| Tokyo | Business hotels | 1,532 | 862 | 781 | 56% |
| Tokyo | Ryokan | 194 | 44 | 32 | 23% |
| Okinawa | Business hotels | 485 | 179 | 171 | 37% |
| Kanagawa | City hotels | 57 | 42 | 42 | 74% |
| Kanagawa | Business hotels | 438 | 198 | 189 | 45% |
| Kanagawa | Ryokan | 620 | 246 | 208 | 40% |
| Fukuoka | City hotels | 54 | 36 | 34 | 67% |
| Fukuoka | Business hotels | 481 | 314 | 294 | 65% |
| Fukuoka | Ryokan | 190 | 64 | 61 | 34% |
| Shizuoka | City hotels | 44 | 30 | 30 | 68% |
| Shizuoka | Business hotels | 461 | 212 | 197 | 46% |
| Shizuoka | Ryokan | 988 | 409 | 347 | 41% |
Source: MetroEngines Research; compiled by the HotelBank Editorial Team
Inventory data can be obtained for only 42% of the coverage universe. This includes properties with no listing for those dates on online distribution and properties that were listed but for which observation points could not be secured; it does not indicate temporary closure or going out of business. The lower 36% retrieval rate for ryokan reflects the fact that smaller properties tend to have intermittent listings for any given date.
Summary
The inventory allocation ratio calculated from inventory observations across 12,941 properties nationwide has a median of 39.2%. By property type, ryokan are highest at 41.7% and city hotels lowest at 23.7%. Across prefectures the range runs 35.5pt, from Mie at 57.1% to Aomori at 21.6%, and at the municipal level it widens to 40.4pt, from Hamamatsu Chuo-ku (the former Naka-ku area) at 57.6% to Nagasaki at 17.2%.
Crossed against estimated settled ADR, no consistent relationship emerged, confirming that allocation is not a dependent variable determined by rate level. Room scale, by contrast, shows a stable relationship: 50.0% for 19 rooms or fewer against 29.8% for 200 rooms or more — the larger the property, the thinner the public allocation.
Where sellout-timing analysis speaks to how demand was handled, allocation speaks to where a property decided to sell in the first place. The former is a variable moved in day-to-day operations; the latter belongs to management design on an annual horizon. That the same inventory data reflects decisions on two different time horizons suggests this metric still has depth left to explore.
⚠ Note on future-dated data: The check-in dates observed in this article, September 19 and October 6, 2026, were both future stay dates at the time of the survey. The inventory allocation ratios shown are estimates based on public inventory observed up to the survey date, and the figures will move if additional inventory is released or cancellations return rooms before check-in. Because rooms sold before observation begins (90 days before the stay date) are not included, please read them as a lower bound on actual online allocation. Estimated settled ADR is likewise an estimate, carrying a median error of approximately 7% when cross-checked against disclosed results from listed hotel REITs, and differs from each property’s actual transaction prices and accounting figures.
Related Reading
- Tokyo Aug 14: 434 Hotels, Front-Loaded 10.8% vs Late-Surge 9.4%
- Hyogo Booking Curves: 3.6x Pickup Gap, Ryokan Sellout Rate 28.4%
- Oita Ryokan vs Resorts: 61.6% and 78.5% OCC 45 Days Out for Sep 12
- Obon T-7: Kyushu’s 31.7pt Gap — Fukuoka 73.0%, Kagoshima 41.3%
References and Sources
■ Market data
- MetroEngines Research — room-level inventory tracking of domestic accommodation properties (coverage universe 34,112 properties; inventory data obtained for 14,397; 12,941 analyzed, covering 1,110,175 total rooms; check-in dates September 19 and October 6, 2026; observations within 90 days of lead time)
- MetroEngines Research — estimated settled ADR by prefecture × property type (monthly averages for finalized months, March–July 2026)
■ Government statistics
- Japan Tourism Agency, “Overnight Travel Statistics Survey (April 2026 second preliminary; May 2026 first preliminary; and 2025 annual values (final))”, released July 6, 2026 — room occupancy rate by facility type, 2025 annual final
- Japan Tourism Agency, Overnight Travel Statistics Survey — statistics top page