

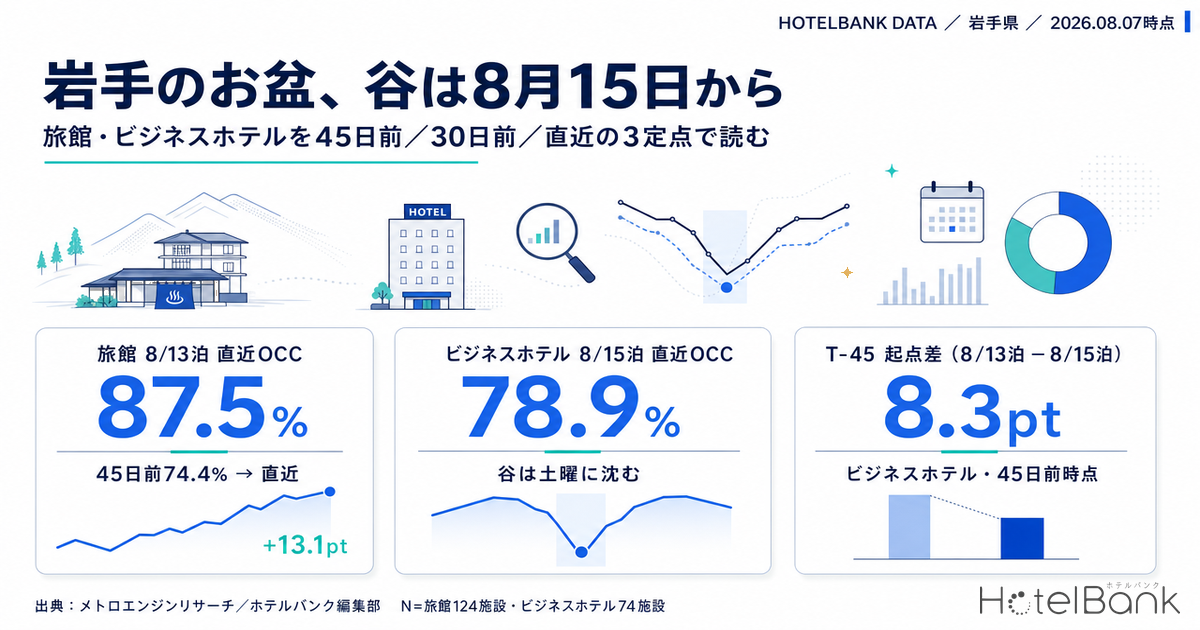
In Iwate Prefecture, Obon 2026 split cleanly between the night of Thursday, August 13 and the night of Saturday, August 15. For ryokan (N=124 properties), estimated OCC on the August 13 stay climbed 13.1pt from 74.4% at 45 days out to 78.5% at 30 days out and 87.5% at the latest cut, while the August 15 stay went 67.0% → 72.1% → 78.9% (+11.9pt). The gap at the latest cut is 8.6pt. For business hotels (N=74 properties) the spread is wider still: 92.5% on August 13 against 78.9% on August 15, a difference of 13.6pt. What matters is that this gap was not created at the last minute — it already stood at 7.4pt for ryokan and 8.3pt for business hotels 45 days out. The structure in which the back half of Obon becomes a valley was readable in the T-45 cut.
Coverage: Iwate Prefecture ryokan N=124 properties (4,134 rooms), business hotels N=74 properties (8,725 rooms), resort hotels N=9 properties (1,136 rooms). Price figures in this article are estimated settled ADR (the transaction price level inferred from OTA and other sales data, tax-exclusive equivalent); occupancy is an estimate based on OTA-listed inventory. Both definitions appear at the end of the article. Data as of August 7, 2026.
- — 87.5% on the August 13 stay vs 78.9% on the August 15 stay (ryokan, latest estimated OCC). Business hotels run 92.5% → 78.9%, so the valley begins on August 15.
- — The gap was not created close in. It already measured 7.4pt for ryokan and 8.3pt for business hotels 45 days out, and it never narrowed through to the latest cut.
- — The build-up from 45 days out to the latest cut is +14.4pt on the August 13 stay against +9.1pt on the August 15 stay (business hotels). The later the date, the slower the accumulation.
- — In July actuals, Saturday was the peak day of the week at 90.4% for ryokan and 94.3% for business hotels, yet Saturday, August 15 sits at 78.9% for both categories. The calendar position outranks the day of the week.
- — Year-on-year estimated settled ADR for the confirmed month is +4.1% for business hotels, +5.9% for city hotels and -3.5% for ryokan. Rate growth is diverging by category.
T-45, T-30 and the latest cut — Iwate’s Obon at three fixed points
We start with the seven stay nights from Tuesday, August 11 through Monday, August 17, lining up estimated OCC (based on OTA-listed inventory) at three fixed points: 45 days out, 30 days out and the latest observation (as of August 6, 2026). Because the latest observation sits anywhere from 5 to 11 days before the stay date depending on the night, the applicable number of remaining days is shown on each row. On why these three fixed points alone are enough to read the shape of demand, we set out the operating framework in Okayama Booking Curves: 3 Checkpoints, Aug 8 Late-Surges +11.8pt.
| Stay date | Ryokan (N=124 properties) | Business hotels (N=74 properties) | ||||||
|---|---|---|---|---|---|---|---|---|
| 45 days out | 30 days out | Latest | 45 days out → latest | 45 days out | 30 days out | Latest | 45 days out → latest | |
| Aug 11 (Tue, 5 days out) | 74.7% | 80.2% | 89.3% | +14.6pt | 76.7% | 83.3% | 93.1% | +16.4pt |
| Aug 12 (Wed, 6 days out) | 74.3% | 80.1% | 88.0% | +13.7pt | 75.4% | 78.7% | 89.8% | +14.4pt |
| Aug 13 (Thu, 7 days out) | 74.4% | 78.5% | 87.5% | +13.1pt | 78.1% | 81.8% | 92.5% | +14.4pt |
| Aug 14 (Fri, 8 days out) | 75.9% | 79.9% | 86.2% | +10.3pt | 74.5% | 77.6% | 87.1% | +12.6pt |
| Aug 15 (Sat, 9 days out) | 67.0% | 72.1% | 78.9% | +11.9pt | 69.8% | 72.4% | 78.9% | +9.1pt |
| Aug 16 (Sun, 10 days out) | — | 69.0% | 76.3% | +7.3pt*vs 30 days out | — | 69.9% | 74.2% | +4.3pt*vs 30 days out |
| Aug 17 (Mon, 11 days out) | 69.5% | 72.4% | 79.0% | +9.5pt | 67.9% | 70.2% | 78.6% | +10.7pt |
*Estimated OCC (based on OTA-listed inventory). The 45-days-out cut for August 16 is withheld because the number of observed properties was minimal (1 ryokan, 4 business hotels); for that date only, the build-up is shown from the 30-days-out baseline. Observed property counts: ryokan 106-110 properties at the 45-days-out cut, 109-112 at the 30-days-out cut and 59-96 at the latest cut; business hotels 65-69 properties at the 45-days-out cut, 65-69 at the 30-days-out cut and 44-65 at the latest cut.
Source: MetroEngines Research; compiled by the HotelBank Editorial Team
Three things stand out from the sequence. First, the four nights from August 11 to 14, which cover the start of Obon, were already at 74-78% for both categories 45 days out and have since risen to 86-93% at the latest cut. Second, the three nights from August 15 to 17 started from a base of 67-70%, some 7-9pt below the first four nights. Third, that difference in starting point has not narrowed at all through to the latest cut. If anything, for business hotels the build-up on the August 13 stay was +14.4pt against +9.1pt on August 15 and +4.3pt on August 16 versus 30 days out — the later the night, the flatter the accumulation.
Obon demand in Iwate therefore takes the shape of a period that concentrates in the first half and eases rapidly from the 15th onward. The first four nights were already running by the 45-days-out mark and climbed further on the late surge. The last three nights started lower and gained less late. That asymmetry shows up in the booking curve below.
Source: MetroEngines Research; compiled by the HotelBank Editorial Team
The horizontal axis is the number of days remaining until the stay date (from 45 days out through to the latest cut). All four lines slope upward, but the upper pair (August 13 stay) and the lower pair (August 15 stay) never cross. Business hotels on the August 15 stay moved only 2.6pt, from 76.3% to 78.9%, across the stretch from 15 days out to 9 days out. Business hotels on the August 13 stay held a high level over the same stretch, 89.6% to 91.4% — the volume of inventory still on the shelf is simply different.
The valley starts on August 15 — the seven-night spread at the latest cut
Laying the latest observation (as of August 6, 2026) out in stay-date order makes the position of the valley clearer still.
Source: MetroEngines Research; compiled by the HotelBank Editorial Team
Business hotels peak at 93.1% on the August 11 stay, followed by 92.5% on August 13. From there they fall 18.9pt, to 78.9% on August 15 and 74.2% on August 16. Ryokan peak at 89.3% on the August 11 stay and drop 13.0pt to 76.3% on August 16. The valley is deeper for business hotels and gentler for ryokan. The pattern of a peak on August 13 and a trough on August 15 is not unique to Iwate; the same ordering appears for ryokan and resort hotels in Wakayama’s Obon.
The estimated share of properties with no listed inventory left points the same way. At the latest cut, ryokan run 42.7% on the August 13 stay against 30.6% on August 15. Business hotels run 39.2% against 25.7%. A higher proportion of properties have sold through their inventory in the first half.
Resort hotels have a small observed base within the prefecture, N=9 properties (1,136 rooms), and the observed property count runs between 7 and 9 from 45 days out to the latest cut, so the category does not support a definitive reading. Presented as a range, estimated OCC at the latest cut sits between 78.8% and 87.1% across the seven nights of August 11-17, with build-up from 45 days out of +1.7pt to +6.8pt (the 45-days-out cut for August 16 is excluded because only one property was observed). The one point worth noting as a supporting line is that the gap between the first and second halves is not as pronounced as it is for ryokan and business hotels. That said, with a base this small, these observations cannot separate whether the difference reflects category characteristics or the sales policies of individual properties.
The day-of-week shape in July actuals, and August estimated settled ADR
Before considering how to fill the Obon valley, it is worth looking at the actuals for the month that has just closed. Monthly average estimated OCC for Iwate Prefecture in July 2026 was 79.3% for ryokan (108-125 properties observed), 89.5% for business hotels (65-75 properties) and 87.8% for resort hotels (8-9 properties). Averaged by day of the week, the picture is as follows.
| Day | Ryokan | Business hotels | Resort hotels | Days counted |
|---|---|---|---|---|
| Mon | 76.0% | 85.2% | 86.3% | 4 |
| Tue | 75.2% | 91.8% | 87.4% | 4 |
| Wed | 76.4% | 92.8% | 87.5% | 5 |
| Thu | 76.1% | 92.7% | 87.8% | 5 |
| Fri | 79.7% | 87.4% | 87.7% | 5 |
| Sat | 90.4% | 94.3% | 90.1% | 4 |
| Sun | 83.0% | 81.3% | 87.6% | 4 |
*Estimated OCC (based on OTA-listed inventory), calculated by averaging daily actuals for July 2026 (closed month) by day of the week.
Source: MetroEngines Research; compiled by the HotelBank Editorial Team
Ryokan run 90.4% on Saturday and 83.0% on Sunday against 75-76% on weekdays, a weekend premium of more than 14pt — the classic leisure profile. Business hotels are heavier midweek, at 91.8-92.8% from Tuesday to Thursday, with Sunday the weakest at 81.3%, the shape of a business-travel market. The July high for both categories fell on Saturday, July 18, at 98.4% for ryokan and 99.4% for business hotels — the first day of the three-day weekend that includes Monday, July 20 (Marine Day).
What deserves attention here is that August 15, the valley in the back half of Obon, is a Saturday, and August 16 is a Sunday. Even though Saturday is the peak day for both categories in July actuals, the latest estimated OCC for Saturday, August 15 is 78.9% for ryokan and 78.9% for business hotels — well below the July Saturday averages (90.4% and 94.3%). In other words, what is normally the strongest day of the week is coming in weaker than an ordinary weekend because of the post-Obon return flow. The phenomenon of a single Saturday in August sinking into a valley while the others hold up can also be seen through the same three fixed points in Hokkaido City Hotels: Only Aug 15 Trails at 78.7% OCC, 45 Days Out.
Next, the price side. Because estimated settled ADR is canonical on a monthly basis, we do not discuss daily rates here. Taking the most recent month that can be compared on a like-for-like confirmed basis, we set July 2026 against the same month a year earlier.
| Category | July 2025 (confirmed) | July 2026 (confirmed) | YoY | August 2026 (current estimate) |
|---|---|---|---|---|
| Ryokan | ¥8,390 (N=140) | ¥8,100 (N=142) | -3.5% | ¥11,822 (N=140) |
| Business hotels | ¥6,049 (N=84) | ¥6,300 (N=85) | +4.1% | ¥10,252 (N=78) |
| City hotels | ¥7,240 (N=18) | ¥7,664 (N=18) | +5.9% | ¥12,054 (N=18) |
| Resort hotels | ¥11,918 (N=10) | ¥9,468 (N=10) | -20.6% | ¥11,870 (N=10) |
*Estimated settled ADR (tax-exclusive equivalent). July 2025 and July 2026 are confirmed figures; August 2026 is an estimate based on the current state of sales, so the bases differ and the two cannot be compared directly (August should be assessed once the month closes). Resort hotels have a small base at N=10.
Source: MetroEngines Research; compiled by the HotelBank Editorial Team
Comparing confirmed months, business hotels are up 4.1% year on year and city hotels 5.9%, while ryokan are slightly down at -3.5%. The -20.6% for resort hotels needs to be read with latitude given the small base of N=10. For August, ryokan currently estimate at the ¥11,800 level, business hotels at ¥10,300 and city hotels at ¥12,100 — but these are values inferred from the current state of sales, and a direct comparison with the confirmed figures for August last year (ryokan ¥10,600, N=137; business hotels ¥7,100, N=84) has to wait for the month to close.
Overlaying the annual shape reveals the seasonal structure of estimated settled ADR in Iwate Prefecture.
Source: MetroEngines Research; compiled by the HotelBank Editorial Team
Ryokan have peaks in August and December with a trough in June — a twin-peak profile within the year. Business hotels hold a narrow range across the year: in 2025 they stayed within ¥5,700 (February) to ¥7,100 (August). Confirmed figures for January-July 2026 track a similarly narrow band of ¥5,900 (March) to ¥6,700 (May). From August onward the basis changes (current estimate), which is why those points are shown as a dotted line.
For revenue managers running ryokan and business hotels in Iwate — implications and an action plan
(1) There is a case for treating Obon as two markets — first half and second half — rather than one block. Market-wide estimated OCC at the latest cut is 87.5% for ryokan and 92.5% for business hotels on the August 13 stay, and 78.9% for both categories on August 15. Simply putting your own two nights side by side and seeing whether your gap is narrower or wider than this tells you whether your property has the same shape as the market, or is stronger in the second half (or has failed to capture the first half). If your shape matches the market, this is a question of demand structure rather than pricing strategy, and there is little reason to force the issue with rate in the second half.
(2) The second-half valley was visible 45 days out — a useful marker for when to set up next year. Estimated OCC at 45 days out for the August 15 stay was 67.0% for ryokan and 69.8% for business hotels, already 7.4pt and 8.3pt below the August 13 stay (74.4% and 78.1%). The strength of the first half versus the second was therefore distinguishable at the T-45 cut. Put the other way round, if you only notice and act after T-45, the levers left to you are largely confined to inventory and conditions.
(3) The assumption that “Saturday is strong” does not hold immediately after Obon. In July actuals Saturday was the peak day at 90.4% for ryokan and 94.3% for business hotels, yet Saturday, August 15 sits at 78.9% for both. If you apply weekend settings automatically off a day-of-week calendar, there is a case for treating the post-Obon weekend as an exception. The same applies to Sunday, August 16, the weakest of the seven days at 76.3% for ryokan and 74.2% for business hotels.
(4) Rate growth is diverging by category. Year on year for the confirmed month, business hotels are +4.1% and city hotels +5.9% against -3.5% for ryokan. The business and city side is passing rate through, while the ryokan side is flat to slightly soft versus last year. When reviewing your annual rate-revision calendar, the questions for a ryokan operation are whether the revenue structure has become dependent on the August and December peaks (¥10,600 and ¥11,000 in 2025) and how to handle the June trough (¥7,700 in 2026).
(5) Do not build a case on figures from a category with a small base. Resort hotels in the prefecture number N=9 properties, and the base for estimated settled ADR is N=10. Latest estimated OCC falls within a range of 78.8% to 87.1%, which works as a supporting reference line but is too thin to serve as a benchmark underpinning decisions at your own property.
The resulting action plan is set out in three tiers by time horizon. Every trigger is tied to a figure presented in this article.
| Horizon | Action | Decision trigger | Objective |
|---|---|---|---|
| Today to this week (5-11 days out) | Take stock of whether inventory for the August 15 and 16 stays has been fully released, including anything held back | Your own outlook for the August 15 and 16 stays is running below the market’s latest estimated OCC (ryokan 78.9% and 76.3% / business hotels 78.9% and 74.2%) | Avoid leaving inventory dormant on the two valley nights |
| Today to this week | Consider lifting consecutive-night conditions and minimum-length-of-stay restrictions set for Obon on the final three nights (August 15-17) | Your property reproduces the market pattern in which build-up from 45 days out to the latest cut on the August 15 stay is +9.1pt for business hotels and +4.3pt versus 30 days out on August 16 — slower than the first half (+14.4pt) | Reduce leakage of single-night demand |
| Today to this week | Review how exposure is allocated across the channels where inventory is released, and reweight it toward the final three nights | Your own gap between the first four nights (ryokan 86.2-89.3% / business hotels 87.1-93.1%) and the final three is larger than the market’s drop (ryokan 13.0pt, business hotels 18.9pt) | Concentrate views on the three valley nights |
| Within two weeks (late August) | Reapply the day-of-week shape from July actuals to weekdays and weekends after Obon | Your day-of-week actuals diverge from the July shape — ryokan at 90.4% Saturday and 83.0% Sunday against 75-76% on weekdays, business hotels at 91.8-92.8% Tuesday to Thursday with Sunday lowest at 81.3% | Return to day-of-week weighting that fits the category |
| Within two weeks | Compare your own August ADR against the market’s current estimate, on the understanding that the month has yet to close | Your projected August rate is far from the market’s current estimate (ryokan ¥11,800 / business hotels ¥10,300 / city hotels ¥12,100) | Secure the inputs to feed into settings from September onward |
| Looking to next month (designing the next T-45) | Establish the practice of recording your own booking curve at T-45 for the next peak period | Check whether your own records can reproduce what was observable this time — the weakness of the August 15 stay showing up at T-45 as 67.0% for ryokan and 69.8% for business hotels | Separate next year’s first-half and second-half Obon settings early |
*None of these guarantee an outcome; they are offered as material for consideration in light of your own demand structure and sales policy.
How far can rate fill the two valley nights? — converting to estimated RevPAR equivalent
Multiplying the estimated OCC and estimated settled ADR figures above gives a comparable level of revenue per room by stay date. This is a unit conversion exactly as defined — estimated RevPAR equivalent = estimated settled ADR × estimated OCC — and introduces no new observations or revenue forecasts. Rate uses the current estimate for August 2026 (ryokan ¥11,822, business hotels ¥10,252) and occupancy uses the latest observation (as of August 6, 2026).
| Stay date | Ryokan | Business hotels | ||||
|---|---|---|---|---|---|---|
| Estimated OCC | Estimated RevPAR equivalent | vs Aug 13 stay | Estimated OCC | Estimated RevPAR equivalent | vs Aug 13 stay | |
| August 13 (Thu) stay — first-half peak | 87.5% | ¥10,344 | — | 92.5% | ¥9,483 | — |
| August 15 (Sat) stay — second-half valley | 78.9% | ¥9,328 | -¥1,016 (-9.8%) | 78.9% | ¥8,089 | -¥1,394 (-14.7%) |
| August 16 (Sun) stay — lowest of the seven | 76.3% | ¥9,020 | -¥1,324 (-12.8%) | 74.2% | ¥7,607 | -¥1,876 (-19.8%) |
*A unit conversion multiplying estimated settled ADR (August 2026, current estimate) by estimated OCC at the latest cut. Not a revenue forecast — an indication of how a difference in occupancy translates into revenue per room.
Source: MetroEngines Research; compiled by the HotelBank Editorial Team
The two valley nights work out to -¥1,016 (-9.8%) on August 15 and -¥1,324 (-12.8%) on August 16 for ryokan, and -¥1,394 (-14.7%) and -¥1,876 (-19.8%) for business hotels. Conversely, to bring the August 15 stay up to the same estimated RevPAR equivalent as the August 13 stay, holding occupancy constant, rate would have to rise 10.9% for ryokan and 17.2% for business hotels. Pushing an increase of that size through a phase in which demand is easing in the back half of Obon is not realistic — which supports, from the revenue side as well, this article’s view that the valley is not something to fill with price.
The sensitivity of combining rate levels with occupancy levels is set out below. Both axes use only observed values that appear in this article, with no extrapolation beyond that range.
| Estimated settled ADR \ Estimated OCC | 74.2% Aug 16 stay, business hotels | 78.9% Aug 15 stay, both categories | 86.2% Aug 14 stay, ryokan | 89.3% Aug 11 stay, ryokan | 93.1% Aug 11 stay, business hotels |
|---|---|---|---|---|---|
| ¥8,100 Ryokan, July 2026, confirmed | ¥6,010 | ¥6,391 | ¥6,982 | ¥7,233 | ¥7,541 |
| ¥10,252 Business hotels, August 2026, current estimate | ¥7,607 | ¥8,089 | ¥8,837 | ¥9,155 | ¥9,545 |
| ¥10,588 Ryokan, August 2025, confirmed | ¥7,856 | ¥8,354 | ¥9,127 | ¥9,455 | ¥9,857 |
| ¥11,822 Ryokan, August 2026, current estimate | ¥8,772 | ¥9,328 | ¥10,191 | ¥10,557 | ¥11,006 |
| ¥12,054 City hotels, August 2026, current estimate | ¥8,944 | ¥9,511 | ¥10,391 | ¥10,764 | ¥11,222 |
*Shaded cells are at or above the business-hotel level for the August 13 stay (¥9,483) — 9 of 25 cells. The vertical axis is the five estimated settled ADR levels appearing in the text; the horizontal axis is the five estimated OCC levels observed at the latest cut. A unit conversion, not a revenue forecast.
Source: MetroEngines Research; compiled by the HotelBank Editorial Team
Summary — three yardsticks for measuring Obon in Iwate
Yardstick 1: the spread between the first four nights and the last three. At the latest cut, ryokan fall 13.0pt from a peak of 89.3% on the August 11 stay to a low of 76.3% on August 16; business hotels fall 18.9pt from 93.1% to 74.2%. If your own spread is wider than this, you are leaving business on the table in the second half; if it is narrower, you have a strength in the second half.
Yardstick 2: the difference in starting point at T-45. Estimated OCC 45 days out for the August 15 stay was 67.0% for ryokan and 69.8% for business hotels, 7.4pt and 8.3pt below the August 13 stay. That difference in starting point never narrowed through to the latest cut. Design on the assumption that a gap visible at T-45 may not be fully closed by subsequent promotion.
Yardstick 3: the day-of-week exception. In July actuals Saturday was the peak day at 90.4% for ryokan and 94.3% for business hotels, yet Saturday, August 15 sits at 78.9% for both. This is a weekend on which the calendar position — the days right after Obon — outranks the day of the week.
These three points transfer directly to Obon in future years. Take two stay dates, August 13 and August 15, and line them up at three fixed points: 45 days out, 30 days out and the latest cut. That alone is enough to tell whether your property has the same shape as the market or a different one.
About the Data
| Item | Detail |
|---|---|
| Definition of estimated OCC | Occupancy based on OTA-listed inventory = 100 − 100 × rooms still listed on OTAs ÷ total rooms. An estimate based on how far inventory offered for sale on OTAs has been absorbed; it is defined differently from actual room occupancy (and runs higher). |
| Booking curve | Based on observations from 45 days before the stay date through to the latest cut. Coverage is the seven nights of August 11-17, 2026, with the latest observation as of August 6, 2026. |
| Definition of estimated settled ADR | The transaction price level (tax-exclusive equivalent) inferred from OTA and other sales data (lowest-plan levels × category coefficients, ensembled across multiple channels). Past months are confirmed figures; the current and future months are estimates based on the current state of sales. Median error against published operating results is 6.6%. |
| Breakdown of properties covered | Booking curve: Iwate Prefecture ryokan N=124 properties (4,134 rooms), business hotels N=74 properties (8,725 rooms), resort hotels N=9 properties (1,136 rooms). Observed property counts vary by cut: ryokan 106-110 at 45 days out, 109-112 at 30 days out and 59-96 at the latest cut; business hotels 65-69, 65-69 and 44-65 respectively; resort hotels 7-9. For the closed month of July 2026, ryokan 108-125 properties, business hotels 65-75 and resort hotels 8-9. Estimated settled ADR: ryokan N=140-142, business hotels N=78-85, city hotels N=18, resort hotels N=10. |
| Data date | Data as of August 7, 2026. Sales conditions and inventory change daily, so the figures in this article are a snapshot at the time of retrieval. |
Source: MetroEngines Research; compiled by the HotelBank Editorial Team
■ Data sources
Aggregated data from MetroEngines Research & Consulting. We used occupancy inferred from daily snapshots of OTA-listed inventory and transaction price levels inferred from sales data. Coverage is Iwate Prefecture ryokan N=124 properties (4,134 rooms), business hotels N=74 properties (8,725 rooms) and resort hotels N=9 properties (1,136 rooms). The booking curve covers the seven stay nights of August 11-17, 2026, with the latest observation as of August 6, 2026 and data as of August 7, 2026. The day-of-week shape averages daily actuals for July 2026 (closed month) by day of the week.
■ Calculation assumptions
The booking curve covers lead times of 45 days or less only, compared at three fixed points: 45 days out, 30 days out and the latest observation. Price uses monthly estimated settled ADR only; daily rates are not treated. Estimated RevPAR equivalent is a unit conversion of “estimated settled ADR × estimated OCC” and is not a revenue forecast. The vertical axis of the sensitivity grid (five estimated settled ADR levels) and its horizontal axis (five estimated OCC levels) are both observed values appearing in the text, with no extrapolation beyond that range. Year-on-year comparisons are calculated between confirmed figures only and are not made against August 2026, which is a current estimate.
■ Limitations and caveats
Estimated OCC is based on OTA-listed inventory and is defined differently from actual room occupancy (it runs higher). Observed property counts vary by cut, and minimal cuts (1 ryokan and 4 business hotels at 45 days out for the August 16, 2026 stay) are withheld. Resort hotels have a small base at N=9 properties and are kept to a supporting reference line. Estimated settled ADR for August 2026 is an estimate based on the current state of sales and cannot be compared directly with confirmed figures (assessment should wait for the month to close). The median error of estimated settled ADR against published operating results is 6.6%. This article neither guarantees nor forecasts the revenue of any specific property.
Related Reading
- Wakayama Obon 2026: Aug 13 Peaks 94.9%, Aug 15 Ryokan Stuck at 73.2%
- Shimane Obon 2026: Only Aug 15-16 Dip; Aug 22 Business Hotels 90.9%
- Kyoto Obon 2026 Booking Curves: Ryokan Add the Most Close In, +11.4pt
- Okayama Booking Curves: 3 Checkpoints, Aug 8 Late-Surges +11.8pt
- Osaka Obon 2026 Booking Curve: Aug 14 at 74.9%, Aug 16 Stuck at 64.1%
- Hokkaido City Hotels: Only Aug 15 Trails at 78.7% OCC, 45 Days Out
- Obon T-7: Kyushu’s 31.7pt Gap — Fukuoka 73.0%, Kagoshima 41.3%
- Nasu vs Morioka Lodging Tax Oct 1: Tiered 1.0-3.0% vs Flat ¥200