

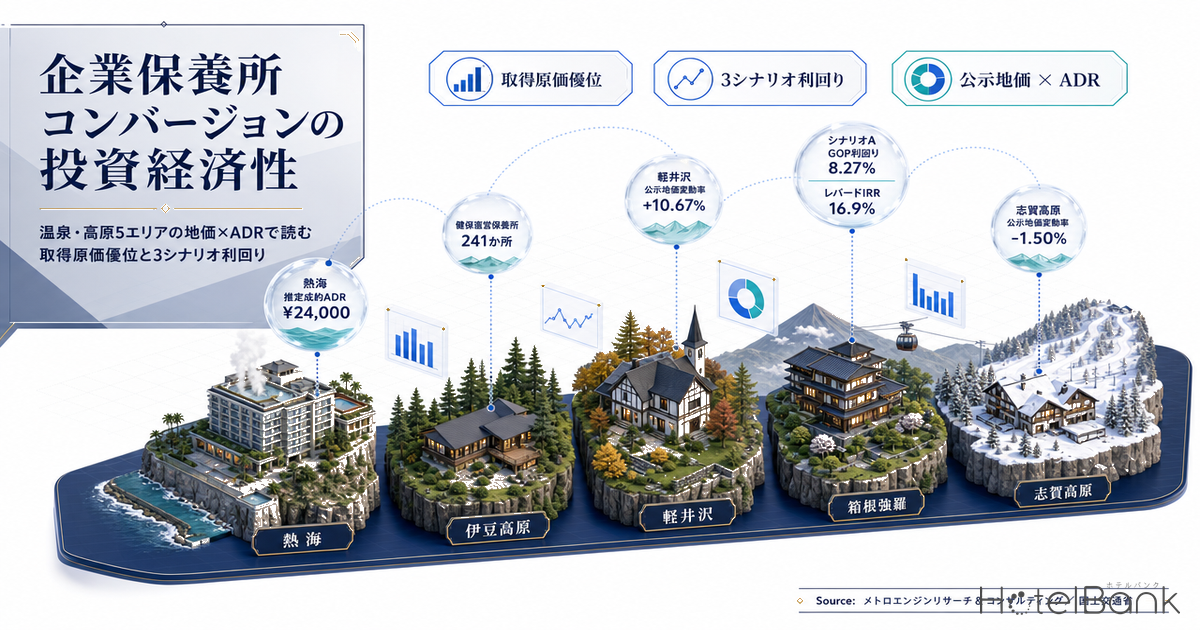
The corporate retreats and training lodges that Japanese companies built en masse in onsen towns and highland resorts during the bubble years are now quietly flowing back onto the market. Retreat facilities directly operated by health insurance societies fell from 295 at the end of March 2021 to 241 at the end of March 2023 — an 18.3% decline in just two years (Kenporen, “Kenpo News”). These are not flimsy structures. They come to the sale table carrying onsen water rights, large communal baths, banquet halls and — above all — view locations that can never be assembled again, with book value almost entirely depreciated away. This article quantifies where an acquisition-cost advantage still survives across five retreat-dense areas — Atami, Izu-Kogen, Karuizawa, Hakone Gora and Shiga Kogen — by pairing published land price movement with estimated settled ADR, then models GOP yield and IRR under three conversion scenarios at different renovation capex levels.
Metric Definitions Used in This Article
- ADR (average daily rate) = an estimated settled rate (tax-exclusive equivalent) derived by applying category-specific adjustment coefficients to the lowest publicly listed plan level each property posts on OTAs and similar channels (double occupancy, per-room rate, tax-inclusive). Cross-checked against property-level results disclosed by listed hotel REITs (91 properties, most recent three months), the median error is approximately 7%. These are estimates and differ from each property’s actual transacted prices or accounting figures. Area-level ADR is the median of the target properties (the level of a typical property in that area).
- OCC (occupancy) = sold rooms as a share of total rooms in the area (estimated from OTA sales inventory). In this article it is used only as a modelling assumption; occupancy for individual properties has not been calculated.
- GOP yield = GOP (gross operating profit) ÷ total investment (acquisition price + renovation capex). NOI yield deducts 15% from GOP as an FF&E reserve and property-tax equivalent.
- Published land price = standard site prices from MLIT’s Land Price Publication and the prefectural land price surveys. “Change rate” in this article is the simple average of year-on-year change rates for standard sites within the target municipality; “level” is the median of the same.
- Data sources: MetroEngines Research & Consulting / MLIT Real Estate Information Library / MLIT National Land Numerical Information / Economic Census (MIC & METI)
- — Health insurance society retreats fell to 241 facilities, down 54 in two years (end of March 2023). Onsen rights and view locations with depreciated book value keep coming to market.
- — Acquisition-cost advantage splits along land price movement. Karuizawa +10.67% versus Shiga Kogen -1.50% (2025); the advantage survives in the latter.
- — Scenario A, a light-touch renovation, delivers a GOP yield of 8.27% and a levered IRR of 16.9% — 3.45 points above the 4.82% a new build on the same site would return.
- — Total investment per room runs ¥16.94M to ¥52.20M, below the ¥58.52M median that listed REITs actually paid per room for onsen resorts, in every scenario.
- — The first screening gate is zoning. 9 of 23 zoning parcels (39.1%) within 1km of central Atami sit in districts where a new hotel or ryokan cannot be built at all.
Conclusion — the acquisition-cost advantage survives where land prices did not move, and is disappearing in Karuizawa
Start with the conclusion. Three numbers now decide whether a corporate retreat conversion works. First, acquisition cost. Two “idle onsen-town retreats” can look identical, yet in an area like Karuizawa, where published land prices are running at +10.7% a year, the entry price for an asset generating the same income is close to double what it is in Shiga Kogen, where land is sinking at -1.5%. Second, the level of renovation capex. A guestroom-only light refit (¥450k per tsubo) and a full renovation (¥1.20M per tsubo) differ by a factor of two in total investment — but by a factor of 3.2 in the ADR they can support. Third, zoning. Of 23 zoning parcels sampled within 1km of Atami Station, 9 (39%) lie in districts where a new hotel or ryokan cannot be built; for a retreat standing on such a site, converting the existing building is the only route available.
In our modelling, Scenario A — a light refit into simple lodging — returns the highest figures at a GOP yield of 8.3% and a levered IRR of 16.9% after construction inflation, followed by Scenario C, a full renovation into small-scale luxury, at 7.1% and 12.6%. Building a new hotel on the same site yields just 4.8%. Pushed to its essence, the investment appeal of conversion lies not in avoiding the purchase of a building, but in avoiding the need to rebuild one.
The idle stock — 54 sites reached the market in two years, and supply is thinning society by society
First, the population. According to the annual tally of directly operated health facilities published by the National Federation of Health Insurance Societies (Kenporen), society-run retreats numbered 295 at the end of March 2021 (held by 178 societies), 269 at the end of March 2022 (166 societies) and 241 at the end of March 2023 (152 societies). Over two years the facility count fell by 54 and the number of holding societies by 26. Deteriorating society finances driven by rising medical cost burdens sit behind this, and the trend is structural. For scale: directly operated retreats are reported to have numbered 1,581 at the end of fiscal 2000 (per Reloclub), meaning the base has shrunk to less than one-sixth in a quarter of a century.
One caveat matters here: these figures cover health-insurance-society-operated facilities only. No public statistic comprehensively captures the total private idle stock once you include retreats and training centres owned by operating companies, facilities held by mutual aid associations and labour unions, and seminar houses run by universities and school corporations. The 241 society facilities are only the part visible above the waterline. Read the other way, that means for investors the main battlefield is off-market negotiated transactions, before anything reaches the open market.
Seller circumstances also shape conversion economics. Because retreats were treated as an employee-benefit expense even when occupancy was low, many sellers have no experience pricing them as income-producing assets. On top of that, depreciation has run its course on the building, so land value effectively sets the floor on the transaction price. This is the source of the “acquisition-cost advantage” discussed below — and equally the reason that advantage evaporates quickly in areas where land prices have risen.
Location analysis — land price movement splits the five areas in two
For the five retreat-dense areas (Atami City / Ito City–Izu-Kogen / Karuizawa Town / Hakone Town–Gora / Yamanouchi Town–Shiga Kogen), we extracted standard sites within roughly a 4km radius of each area centre from MLIT’s Real Estate Information Library and tracked year-on-year change rates from 2021 to 2025. The result splits cleanly in two.
Karuizawa Town accelerated from +5.16% in 2021 to +10.67% in 2025, lifting the median standard site price 44.7% over those five years, from ¥64,900 to ¥93,900 per m². Permanent-residence demand for second-home land plus new luxury hotel development is driving land higher. Yamanouchi Town (Shiga Kogen), by contrast, has not turned positive once in five years and was still at -1.50% in 2025. Atami City recovered gently from +0.12% in 2021 to +3.34% in 2025, and Hakone Town swung from -2.33% to +3.89%. Ito City (Izu-Kogen) only just escaped decline in 2025, at +0.01% — its first non-negative print in five years.
| Area | Median land price (2025, ¥/m²) | YoY change (2025) | 2021→2025 level change | Standard sites | Zoning status (within 1km of centre) |
|---|---|---|---|---|---|
| Karuizawa Town | 93,900 | +10.67% | +44.7% | 15 | 5 parcels. Category I low-rise exclusive residential 3; neighbourhood commercial and Category I residential 1 each |
| Hakone Town (Gora) | 63,800 | +3.89% | +13.3% | 11 | 6 parcels. Commercial 300%, neighbourhood commercial 200%, Category I residential 200%, 1 each |
| Atami City | 61,600 | +3.34% | -1.4% | 16 | 23 parcels. Commercial 4, neighbourhood commercial 4, Category I/II residential 6, others |
| Ito City (Izu-Kogen) | 41,100 | +0.01% | +3.3% | 7 | No zoning district designated |
| Yamanouchi Town (Shiga Kogen) | 26,400 | -1.50% | -6.4% | 1 | No zoning district designated |
Zoning directly governs whether conversion is possible at all. Under Appended Table 2 of the Building Standards Act, hotels and ryokan cannot be built in Category I or II low-rise exclusive residential districts, Category I or II mid/high-rise exclusive residential districts, industrial districts or exclusive industrial districts (in Category I residential districts they are capped at 3,000 m²). Of the 23 parcels extracted within a 1km radius of Atami Station, 7 were Category II mid/high-rise exclusive residential, 1 was Category I mid/high-rise exclusive residential and 1 was Category I low-rise exclusive residential — 9 parcels in total (39.1%) where a new hotel or ryokan cannot be built. In Karuizawa, 3 of the 5 parcels extracted are Category I low-rise exclusive residential.
Here lies a point specific to conversion schemes. Zoning restrictions apply in principle to new construction and to changes of use, so converting an existing retreat into a lodging-business facility faces the same constraint. That said, the 2019 amendment to the Building Standards Act (in force June 2019) removed the requirement for a building confirmation application where the floor area subject to the change of use is 200 m² or less. A retreat sitting in a low-rise exclusive residential district will, as a rule, not be able to obtain a lodging business licence; in areas with no designated zoning district, such as Izu-Kogen and Shiga Kogen, no use restriction under the Building Standards Act applies at all. Cheap land plus loose use restrictions — that double condition is precisely what the residual acquisition-cost advantage in these two areas consists of.
The absence of zoning does not, however, mean the absence of constraint. Shiga Kogen falls partly within Joshinetsu-Kogen National Park and Izu-Kogen within Fuji-Hakone-Izu National Park, so construction, extension or alteration of structures requires permission or notification under the Natural Parks Act. Restrictions on exterior appearance, colour and height reach existing-building renovations too, which makes “how much of the existing condition, including legally non-conforming elements, can be retained” the single largest practical variable.
Area distribution map — land price movement overlaid on lodging stock
| Atami | 1,500 establishments / 11,614 employees / office sector 11.1% |
| Karuizawa | 822 / 5,913 / 8.3% |
| Hakone Gora | 451 / 4,076 / 3.0% |
| Izu-Kogen | 89 / 370 / 5.7% (1 district covered) |
| Atami | 15,937 → -27.1% by 2040 / aged 50.0% |
| Izu-Kogen | 5,688 → -31.2% / aged 58.0% |
| Karuizawa | 3,057 → -3.9% / aged 37.4% |
| Hakone Gora | 3,393 → -28.7% / aged 37.3% |
| Shiga Kogen | 107 → -31.8% / aged 40.5% |
The trade area data sharpens the contrast between the five locations further. Atami holds 1,500 establishments and 11,614 employees within 1.5km, with an office-sector share of 11.1% — the most urban of the resource areas. Hakone Gora, at 3.0% office sector, is overwhelmingly tourism employment. Izu-Kogen has only one small district covered in the Economic Census (89 establishments, 370 employees), which makes it a location where demand simply cannot be argued from trade area data.
The population outlook is harsher still. Within 2km of Atami, the 15,937 residents recorded in 2020 are projected to fall 27.1% by 2040, and the aged share has already reached 50.0%. Izu-Kogen shows an aged share of 58.0% and a 31.2% decline by 2040. In these areas, demand for a converted asset cannot be sought from the local population. Conversely, the post-conversion business plan must be built on the assumption of 100% out-of-area and inbound demand. The single exception is Karuizawa, where the 2040 decline is just 3.9% and the aged share 37.4% — second-home land turning into permanent residence is holding up the population structure. For how trade-area ageing constrains the exit options available to an owner, see Aging Trade Areas Constrain Hotel Exits: Atami 49.1% vs Takayama 38.8%, which examines Atami and Takayama in depth.
What the mesh map shows is a structure in which Atami’s resident population clings to the seaward slopes below the station and thins rapidly on the inland hillsides. Most corporate retreats sit precisely on those inland, elevated slopes. They hold an irreplaceable asset in the view, but they are distant from everyday convenience, and staffing plus the logistics of food and linen determine the operating cost of a converted property. This feeds directly into the differences in GOP margin by scenario discussed below.
Post-conversion revenue — estimated settled ADR is up 10.4% in Atami and 12.7% in Karuizawa
After acquisition cost comes the revenue side. Tracking estimated settled ADR across the five areas in MetroEngines Research data, the first-half 2026 (January–June) average was ¥26,200 in Hakone Town (+4.8% year on year, N=173–187 properties), ¥24,000 in Atami City (+10.4%, N=100–105), ¥21,300 in Karuizawa Town (+12.7%, N=49–52), ¥20,200 in Ito City (-1.3%, N=123–126) and ¥12,800 in Yamanouchi Town (+7.2%, N=89–118). Ito City is the only one below the prior-year period, yet in level terms it still sits above the ryokan category for Shizuoka Prefecture as a whole (¥18,700, N=453 properties).
What deserves attention here is less the level than the seasonal amplitude. Across full-year 2025, Karuizawa Town’s ratio between its cheapest month (June, ¥16,900) and its most expensive (August, ¥37,000) reaches 2.18x. Hakone Town, by contrast, sits at 1.27x, Atami City at 1.49x and Ito City at 1.36x. Where amplitude is large, the majority of annual GOP concentrates into just two or three months, so the same average annual ADR implies a completely different working capital design and a different tolerance for off-season fixed costs. A Karuizawa retreat conversion has to be designed to “take it all in summer”, or the levelled funding plan will not hold.
A second question is the balance between revenue and acquisition cost. Dividing first-half 2026 estimated settled ADR by the 2025 median published land price (¥/m²) gives an index of 0.49 for Ito City, 0.49 for Yamanouchi Town, 0.41 for Hakone Town and 0.39 for Atami City — against a conspicuously low 0.23 for Karuizawa Town. Even though Karuizawa’s ADR is growing at +12.7%, land is rising faster still, so its entry price relative to income is the heaviest of the five areas. Ito City, conversely, has ADR below the prior year yet ranks at the top of the index because land has barely moved in five years.
Cost advantage Izu-Kogen & Shiga Kogen
Land at ¥26,400–41,100/m², roughly flat to falling over five years. No zoning district designated, so no use restriction under the Building Standards Act applies. ADR is relatively low, but the revenue-to-cost ratio is the highest of the five. Natural Parks Act permitting is the practical hurdle.
Balanced Atami & Hakone Gora
Land recovering gently at +3.3–3.9% a year, ADR up 4.8–10.4%. A balanced zone where revenue and cost move at the same speed. Since 40–50% of parcels sit in districts where hotels and ryokan cannot be built, converting an existing building is effectively the only way in.
Cost running ahead Karuizawa
Land up 44.7% over five years and +10.7% in 2025 alone. Land has overtaken ADR growth of +12.7%, leaving the lowest revenue-to-cost ratio of the five. Timing the acquisition is what determines the yield here. Population decline is limited at -3.9%, so the long-run upside is the largest.
Development scenario modelling — renovation capex moves the yield by two points
Building on the location and revenue conditions above, we model investment economics on a standardised conversion. The assumed asset is a retreat with a 1,500 m² site, 1,000 m² of gross floor area (302.5 tsubo), RC construction, completed in the 1990s, with around 20 original guestrooms. Using Atami City’s median published land price (¥61,600/m²), land is valued at ¥92M and the building at ¥28M, for an acquisition price of ¥120M. Renovation capex is set at three levels with reference to prevailing per-tsubo ranges (guestroom-only refit ¥500k–1.0M/tsubo; full renovation including common areas and building services ¥1.2M–2.0M/tsubo).
| Item | A. Simple lodging, room-only Highest yield | B. Mid-scale renovation, onsen inn revival | C. Full renovation, small-scale luxury | Ref: new build (RC) |
|---|---|---|---|---|
| Rooms | 16 | 14 | 10 | 10 |
| Renovation / construction unit cost | ¥450k/tsubo | ¥800k/tsubo | ¥1.20M/tsubo | ¥2.026M/tsubo |
| Capex (2025 actual basis) | ¥136M | ¥242M | ¥363M | ¥613M |
| Capex per room | ¥8.51M | ¥17.29M | ¥36.30M | ¥61.30M |
| Assumed ADR (estimated settled) | ¥14,000 | ¥28,000 | ¥45,000 | ¥45,000 |
| Assumed OCC (full-year modelling assumption) | 58% | 63% | 60% | 60% |
| Room revenue (annual) | ¥47.43M | ¥90.14M | ¥98.55M | ¥98.55M |
| Total revenue (annual) | ¥49.79M | ¥126M | ¥143M | ¥143M |
| GOP margin | 45% | 20% | 26% | 26% |
| GOP (annual) | ¥22.41M | ¥25.24M | ¥37.15M | ¥37.15M |
| Total investment | ¥257M | ¥362M | ¥483M | ¥705M |
| GOP yield | 8.73% | 6.96% | 7.69% | 5.27% |
| Capex (after construction inflation) | ¥151M | ¥268M | ¥401M | ¥678M |
| Total investment (same basis) | ¥271M | ¥388M | ¥522M | ¥770M |
| Total investment per room | ¥16.94M | ¥27.71M | ¥52.20M | ¥77.00M |
| GOP yield (same basis) | 8.27% | 6.51% | 7.12% | 4.82% |
| NOI yield (same basis) | 7.03% | 5.53% | 6.05% | 4.10% |
| Levered IRR (10-year hold) | 16.9% | 9.9% | 12.6% | — |
| Simple payback period | 12.1 years | 15.4 years | 14.0 years | 20.7 years |
Reading the results: Scenario A posts the highest GOP yield at 8.27%, but it does so by trading low ADR and minimal service for a 45% GOP margin. An operating model built on room-only stays, self check-in and no food service fits well with the “hard-to-staff hillside location” identified in the previous section. Scenario C, on the other hand, generates the largest GOP in absolute terms (¥37.15M), and that is what drives the exit sale price. On a 10-year hold at a 6.0% exit cap rate, the levered IRR ranking runs A at 16.9%, C at 12.6% and B at 9.9%.
Scenario B looks weakest because the GOP margin of a two-meals-included ryokan is structurally low (an industry rule of thumb of 5–15%; we adopt a conservative 20% here). That does not, however, mean B has little room to improve. Lift the GOP margin by a few points through better food and beverage gross margin, repurposing the banquet hall for events, or selling room-only plans alongside the full-board product, and the yield improves immediately. Scenarios A and C, by contrast, face structural constraints — a low ADR ceiling and heavy capex respectively — that operational effort cannot easily overturn.
The most important comparison is against a new build. Delivering the same location and the same product (10 rooms, ADR ¥45,000) through new construction costs ¥613M on the ¥2.026M/tsubo RC basis from MLIT’s 2025 “Statistics on Building Construction Starts”, or ¥678M after inflation, dropping the GOP yield to 4.82%. That is 2.3 points below conversion Scenario C, and on total investment per room the gap is ¥52.20M versus ¥77.00M — 32%. Rising construction costs suppress new supply and raise the scarcity of existing assets, which makes them a double tailwind for conversion schemes. Where exactly the boundary falls between renovating and rebuilding depends on how much ADR lift each yen of capex can buy, and has to be tested project by project against recent large-scale renewal precedents.
Sensitivity analysis and market benchmarks — what still works at ADR -10% and OCC -5pt
To test the robustness of the modelling, we ran a sensitivity analysis on each post-inflation scenario with ADR and OCC shaded downwards.
| Scenario (post-inflation) | Base case | ADR -10% | OCC -5pt | Both | Downside |
|---|---|---|---|---|---|
| A. Simple lodging, room-only | 8.27% | 7.44% | 7.56% | 6.80% | -1.47pt |
| B. Mid-scale renovation, onsen inn revival | 6.51% | 5.85% | 5.99% | 5.39% | -1.12pt |
| C. Full renovation, small-scale luxury | 7.12% | 6.41% | 6.53% | 5.87% | -1.25pt |
| OCC \ ADR | ¥11,200 | ¥12,600 | ¥14,000 | ¥15,400 | ¥16,800 |
|---|---|---|---|---|---|
| 48% | 5.47% | 6.16% | 6.84% | 7.52% | 8.21% |
| 53% | 6.04% | 6.80% | 7.55% | 8.31% | 9.06% |
| 58% | 6.61% | 7.44% | 8.27% | 9.09% | 9.92% |
| 63% | 7.18% | 8.08% | 8.98% | 9.88% | 10.77% |
| 68% | 7.75% | 8.72% | 9.69% | 10.66% | 11.63% |
Read across both axes (all on a full-year modelling basis), even the bottom-left cell of the grid — ADR ¥11,200 × OCC 48% — returns a GOP yield of 5.47%, which is 0.65 points above the 4.82% a new build of the same location and product would deliver. Let ADR fall 20% below base and hold OCC at 58% and the yield is 6.61%; let OCC fall to 48% while ADR holds at base and it is 6.84%. No single-factor downside breaks the advantage over a new build. The robustness of the conversion scheme derives not from the low ADR assumption itself but from the lightness of that ¥16.94M total investment per room. Note that the middle row of this grid matches the Scenario A downside sensitivity table (ADR -10% = 7.44%; ADR -10% with OCC -5pt = 6.80%).
Even under the harsher combined downside of ADR -10% and OCC -5pt, all three options hold a GOP yield above 5.3%. The Japan Real Estate Institute’s “53rd Real Estate Investor Survey” (as of October 2025) reports expected yields for limited-service hotels of 4.2% in Tokyo and 4.4% in Osaka; even allowing a risk premium for a resort location and small scale, the range in this modelling sits within investment-grade territory. That said, these figures assume the acquisition price can be held down to a land-valuation basis. Push the acquisition price from ¥120M to ¥200M and Scenario A’s yield falls from 8.27% to 6.39%, a drop of 1.9 points. Backing a maximum acquisition price out of the revenue side — dividing achievable GOP by a target yield — is the discipline that keeps this exposure bounded.
It is worth checking actual transaction levels as well. Extracting onsen and highland resort acquisitions from our ownership master (7 listed REITs, 301 properties, as of 20 July 2026) gives the following.
| Property | Holding REIT | Acquired | Acquisition price | Rooms | Per room |
|---|---|---|---|---|---|
| Kamenoi Hotel Izu-Kogen (亀の井ホテル 伊豆高原) | Invincible Investment Corporation (インヴィンシブル投資法人) | July 2024 | ¥5,563M | 55 | ¥101.15M |
| Kamenoi Hotel Kusatsu Yubatake (亀の井ホテル 草津湯畑) | Invincible Investment Corporation (インヴィンシブル投資法人) | August 2025 | ¥4,682M | 80 | ¥58.52M |
| Tateshina Grand Hotel Takinoyu (蓼科グランドホテル滝の湯) | Invincible Investment Corporation (インヴィンシブル投資法人) | August 2023 | ¥8,365M | 160 | ¥52.28M |
| Hotel Epinard Nasu (ホテルエピナール那須) | Invincible Investment Corporation (インヴィンシブル投資法人) | March 2016 | ¥21,002M | 310 | ¥67.75M |
| Hakone Gora Onsen Kinoyu Setsugetsuka (箱根強羅温泉 季の湯 雪月花) | Japan Hotel REIT Investment Corporation (ジャパン・ホテル・リート投資法人) | October 2006 | ¥4,070M | 158 | ¥25.76M |
| Ooedo Onsen Monogatari Premium Ito Hotel New Okabe (大江戸温泉物語Premium 伊東ホテルニュー岡部) | Japan Hotel & Residential Investment Corporation (日本ホテル&レジデンシャル投資法人) | September 2016 | ¥2,657M | 73 | ¥36.40M |
Per-room acquisition prices for the three onsen resorts bought in the last three years (2023–2025) run from ¥52.28M to ¥101.15M, with a median of ¥58.52M. The conversion scenarios modelled here come to ¥16.94M per room for A, ¥27.71M for B and ¥52.20M for C — so even the heaviest, C, lands below what listed REITs actually pay per room. That is the quantitative meaning of “IRR upside from an acquisition-cost advantage”. It should be said, though, that what a REIT buys is a stabilised asset with an operating track record and a management platform in place, whereas a conversion carries the risk of ramping up from zero. Part of that unit-price gap is precisely that risk premium.
As an operating benchmark, Hoshino Resorts REIT (星野リゾート・リート投資法人), which holds predominantly resort properties, disclosed portfolio-wide results for May 2026 of 80.1% occupancy (+1.1 points year on year), ADR of ¥22,950 (+2.4%) and RevPAR of ¥18,373 (+3.8%). The OCC assumptions of 58–63% used here sit almost 20 points below that — a conservative setting we regard as a fair reflection of realistic ramp-up performance.
Risk assessment and investment judgement — three conditions for viability
| Risk category | Description | Impact | Mitigation |
|---|---|---|---|
| Regulatory | In low-rise and mid/high-rise exclusive residential districts, a change of use to a lodging business facility is, as a rule, not achievable. Within 1km of central Atami, 9 of 23 parcels fall into this category | High | Always confirm zoning and Natural Parks Act area classification before acquisition. Even in areas without designated zoning, open early discussions on landscape ordinance and park-law permitting |
| Construction | Renovation unit costs rose 41% between 2022 and 2024. Delays to construction starts could push unit costs higher still | High | Fix the design brief early and place budget orders. Build a condition survey of structure and building services into pre-acquisition due diligence |
| Demand | Resident population within 2km falls 27–32% by 2040 (Karuizawa excepted). Local demand cannot be relied on | Medium | Design the product for out-of-area and inbound demand. In areas with large seasonal amplitude, prioritise capturing peak season in full |
| Market | In Karuizawa, land price growth (+10.7% a year) outruns income growth, shrinking the acquisition-cost advantage | Medium | Set a ceiling on the acquisition price by backing it out of income. Consider alongside Izu-Kogen and Shiga Kogen, where the cost advantage survives |
| Operational | Staffing and logistics at hillside and suburban locations. A factor that pushes the GOP margin down by several points | Medium | Adjust labour intensity through either a low-headcount operation (Scenario A type) or high-rate, few-room formats (Scenario C type) |
The investment case that follows comes down to three points. First, the initial screening gate is zoning. Before any discussion of profitability, confirm that the retreat sits in a district where a lodging business facility is permitted. That test alone eliminates 30–60% of candidates. Second, the acquisition-cost advantage can be measured by land price movement. In areas where land is moving at +10% a year the advantage disappears within one to two years; where land is flat or falling, it is preserved. Third, the level of renovation capex determines the shape of the return. A light refit maximises yield and IRR; a full renovation maximises exit value and absolute GOP. Which is correct depends on the investor’s holding period and exit strategy.
Corporate retreats, as an idle asset class, come to market with book value written off while still holding onsen rights, large communal baths and views — assets that simply cannot be newly acquired today. With construction costs staying high and new-build yields slipping below 5%, converting this idle stock can be a realistic route in for regional banks, regional developers and operating companies. Whether it works, though, has to be judged deal by deal on three numbers — zoning, land price movement and renovation unit cost — not on generalisations about location.
⚠ Note on ADR for future dates: For months from July 2026 onward, the ADR figures in this article are estimates based on selling prices publicly listed on OTAs and similar channels at the time of the survey, and will shift as the check-in date approaches. Please note that rates currently set high may fall through last-minute discounting, and that levels may change as new plans are added.
※ Status of the modelling: The development scenario modelling in this article is a simplified model based on public statistics and our own aggregated data. An actual investment decision requires a condition survey of the target property’s structure and building services, discussions with the relevant authorities, and a detailed feasibility study. Nothing here constitutes a recommendation to invest in any specific property or area.
Related Reading
- Aging Trade Areas Constrain Hotel Exits: Atami 49.1% vs Takayama 38.8%
- Hotel vs Condo Land Rivalry: ADR-Implied Feasible Land Price Map
- Atami Ryokan Market 2026: 76 Properties, 2,508 Rooms ADR Analysis
- Simple Lodging × Vacant Home Reuse 2026: Kyoto, Osaka & Naha Whole-House IRR
- Can Hotels Survive Japan’s 2040 Population-Decline Resorts?
References and Sources
■ Data sources
Estimated settled ADR is our own estimate, applying category-specific adjustments to the history of selling prices published on OTAs (first half of 2026, by municipality: Atami City N=100–105, Ito City N=123–126, Karuizawa Town N=49–52, Hakone Town N=173–187, Yamanouchi Town N=89–118). Published land prices are standard site prices from MLIT’s Real Estate Information Library (standard sites extracted within roughly a 4km radius of each area centre); zoning is the urban planning GIS data from the same library. Trade area figures come from the Economic Census for Business Activity (2021), and resident population from National Land Numerical Information projected future population by 250m mesh. REIT acquisition records come from an ownership master covering 7 listed REITs and 301 properties (as of 20 July 2026).
■ Modelling assumptions
The target asset is a retreat with a 1,500 m² site, 1,000 m² of gross floor area (302.5 tsubo), RC construction, completed in the 1990s, with around 20 original guestrooms. From Atami City’s median published land price of ¥61,600/m², land is valued at ¥92M and the building at ¥28M, for an acquisition price of ¥120M. Renovation unit costs are set at three levels from prevailing ranges of ¥500k–1.0M/tsubo for a guestroom-only refit and ¥1.2M–2.0M/tsubo for a full renovation. Construction inflation applies Turner & Townsend forecasts (2026 +5.3%, 2027 +5.0%) compounded over two years for +10.6%. OCC is a full-year modelling assumption (58–63%), not an actual result for any individual property. GOP yield = GOP ÷ total investment; NOI yield deducts 15% from GOP. Levered IRR assumes 60% LTV, a 1.5% borrowing rate, a 10-year hold, a 6.0% exit cap rate and 3% disposal costs. The ADR × OCC two-axis grid is a deterministic re-computation of the Scenario A assumptions above.
■ Limitations and caveats
This article is a simplified model based on public statistics and our own aggregation, and is not a recommendation to invest in any specific property or area. Condition surveys of structure and building services, consultation with authorities under the Natural Parks Act and landscape ordinances, and the feasibility of obtaining a lodging business licence all require case-by-case verification. Yamanouchi Town’s published land price is indicative only, as just one standard site fell within the extraction radius. For Izu-Kogen, only one small district is covered in the Economic Census, so demand cannot be argued from trade area data. ADR from July 2026 onward is estimated from selling prices published at the time of the survey and will shift until the check-in date. Conversion projects carry the risk of ramping up from zero operating history, and the gap against REIT transaction unit prices includes that risk premium.
■ Market data
- MetroEngines Research & Consulting — estimated settled ADR (first half of 2026: Atami City N=100–105, Ito City N=123–126, Karuizawa Town N=49–52, Hakone Town N=173–187, Yamanouchi Town N=89–118), property master (N=1,598 properties within the five areas), ownership master for 7 listed REITs (301 properties, as of 20 July 2026)
■ Government statistics and public data
- MLIT Real Estate Information Library — Land Price Publication, prefectural land price surveys, urban planning GIS data (zoning)
- MLIT National Land Numerical Information — projected future population by 250m mesh (R6 NIPSSR-based estimate)
- Economic Census for Business Activity, MIC & METI (2021) — establishments and employees (boundaries = 2020 Census small areas)
- MLIT “Statistics on Building Construction Starts” — construction cost per tsubo by structure (2025 RC: ¥2.026M/tsubo)
■ Industry reports and surveys
- Japan Real Estate Institute, “53rd Real Estate Investor Survey” (as of October 2025)
- Nomura Real Estate Solutions, “Cap Rate Trends — from the Latest Real Estate Investor Survey (October 2025)”
- archi-book, “What is the per-tsubo construction cost level for hotels? (2025 edition)”
- Tenpo Naiso, “Interior fit-out cost benchmarks for hotels and ryokan: ¥500k–3.5M per tsubo, ¥1.2M–5.0M per guestroom”
- JLL, “Japan Hotel Investment Market 2025” — construction cost inflation and new supply rate
■ Retreat stock and regulation
- Kenporen, “Kenpo News”, late-March 2024 issue — 241 directly operated retreats across 152 societies (as of end of March 2023)
- Kenporen, “Kenpo News”, late-March 2023 issue — 269 directly operated retreats across 166 societies (as of end of March 2022)
- Reloclub, “What is a corporate retreat? A new form of employee benefit in an era of not owning” — 1,581 directly operated retreats at the end of fiscal 2000
- Minpaku-Kyoka.com, “Change-of-use procedures for existing buildings” — the 200 m² threshold under the 2019 Building Standards Act amendment
- Mitsui Fudosan Realty, “Hotels closed due to poor performance: subsequent reuse and conversion cases”
■ REIT disclosures
- Hoshino Resorts REIT (星野リゾート・リート投資法人) IR library — May 2026 portfolio-wide results (occupancy 80.1% / ADR ¥22,950 / RevPAR ¥18,373)
- Invincible Investment Corporation (インヴィンシブル投資法人) portfolio
- Japan Hotel REIT Investment Corporation (ジャパン・ホテル・リート投資法人) portfolio list