

Two-stage tenders for public land, 1,951 closed school buildings, fishing-port facility conversions, hotel development at 203 Park-PFI parks, roadside-station hotels. Every primary-supply series we have covered so far turned on the same question: how do you turn idle land or an idle building into lodging? This article is not about that. It is about municipally owned stock that is already operating as lodging — not a vacant lot, not a closed school, but a property with guest rooms, a bathhouse, a working kitchen and a designated manager on site — and how funds, regional banks and operating companies turn those into deals.
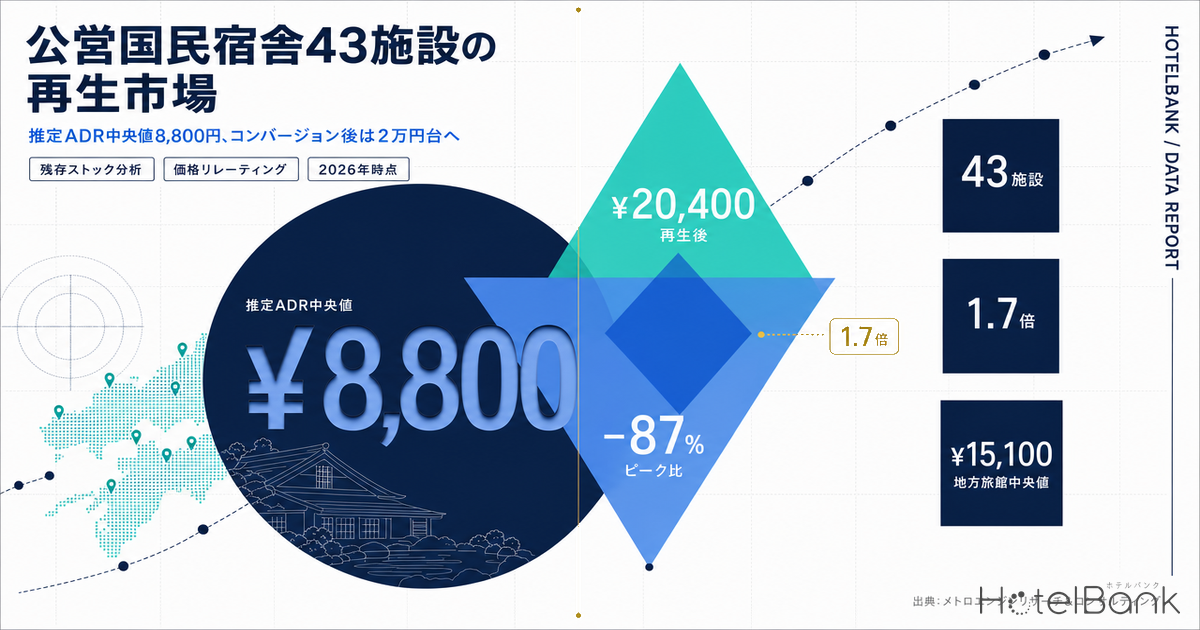
The entry point is the publicly run Kokumin-Shukusha (municipal public lodges). The roster published by the Public Kokumin-Shukusha Association lists 43 properties (as of 2026). By region: Hokkaido/Tohoku 6, Kanto/Chubu 11, Hokuriku/Kansai 9, Chugoku/Shikoku 13, Kyushu 4. That is the surviving stock after a decline to roughly one-eighth of the 345-property peak of fiscal 1979-1981, over some four decades. Using those 43 properties as the numerical anchor, this article sets out the real-world estimated settled ADR and occupancy levels we track, the price re-rating actually achieved by a converted property, the hard numbers on major renovation, and the issues that arise under each contract structure — organized so that it runs from sourcing through to deal execution.
Metric Definitions Used in This Article
- ADR (average daily rate): an estimated settled rate (tax-excluded equivalent) calculated by applying a property-type correction factor to the lowest published plan rate each property lists on OTAs (double occupancy, per-room rate, tax included). Cross-checked against property-level results disclosed by listed hotel REITs (91 properties, most recent three months), the median error is approximately 7%. These are estimates and differ from each property’s actual transacted prices and accounting figures. Area-level ADR is the median across the properties covered (the level of a typical property in that area).
- OCC (occupancy): the share of rooms sold against total rooms in the area (an estimate based on OTA sales inventory; consistency checks against monthly REIT disclosures confirm accuracy of roughly a few percentage points). The population and definition differ from the actual occupancy rate published in the Japan Tourism Agency’s “Overnight Travel Statistics Survey,” so the two are not compared arithmetically.
- Listed price: the per-room rate at double occupancy (tax included).
- Data source: MetroEngines Research & Consulting
- — 43 properties remain on the Public Kokumin-Shukusha Association roster. That is the surviving stock after a decline to roughly one-eighth of the 345-property peak of fiscal 1979-1981, and 30% of it is concentrated in Chugoku/Shikoku.
- — ¥8,800 vs. ¥15,100. The median estimated settled ADR of the 38 properties carrying the Kokumin-Shukusha name, against the median for 280 ryokan and resort properties (20+ rooms) in Chugoku/Shikoku. The gap is roughly 1.7x, and about 2.5x if the upper quartile is reached.
- — ¥20,400 is the most recent ADR at a property converted after transfer to the private sector. It climbed there in 16 months from the ¥13,000 range in its opening month, up 40.4% year on year. But it took two years and ten months from transfer to opening.
- — About ¥16 million per room is what one public Kokumin-Shukusha’s long-term repair plan (about ¥930 million over ten years) works out to when divided by room count. That is a variable to be compared directly against the ¥20-24 million per room cost of building new in regional Japan.
- — A 9.4% GOP yield is what the room-reduction, value-added scenario still delivers under a combined shock of ADR −10% and OCC −5pt. That beats the 7.9% of the light-renovation option, giving it the edge on downside resilience.
Conclusion — the price gap is about 1.7x, but the margin comes from a change in who carries the major repairs, not from pricing
The conclusion first. Across the properties we track whose names include “Kokumin-Shukusha” and for which continuous OTA sales could be confirmed over the past year — 38 properties — the estimated settled ADR was a median of ¥8,800 (Q1 ¥7,400 / Q3 ¥13,500). Average room count was 28.9, small for a hotel investment target.
By contrast, in Chugoku/Shikoku, where this stock is most densely concentrated, the estimated settled ADR of 280 ryokan and resort hotels with 20 or more rooms was a median of ¥15,100, with Q3 at ¥22,200 and the 90th percentile at ¥31,200. Median to median that is a gap of roughly 1.7x; reaching the upper quartile would make it about 2.5x.
It would be a mistake, however, to read that difference straight across as “room to raise prices.” Public properties price low not through weak management but because Kokumin-Shukusha were established for a policy purpose: to provide sound recreation at low cost. The legal basis is a 1963 directive from the Vice-Minister of Health and Welfare (the Guidelines for the Establishment and Operation of Public Kokumin-Shukusha), and from 1993 onward the equivalent guidelines issued by the Vice-Minister of the Environment. The price level is simply what that institutional design produces. What an investor should therefore examine is not “why are they cheap,” but two things only: how far the price moves the moment the property leaves that framework, and how much capital expenditure that move requires.
Point 1 The price re-rating is empirically proven
At a property converted after transfer to the private sector, the rate moved from the ¥13,000 range in its opening month to ¥20,400 in 16 months (detailed below). The level reached approaches the upper-quartile band of regional ryokan and resorts.
Point 2 Transferring the repair burden is the real issue
One public Kokumin-Shukusha’s long-term repair plan totals about ¥930 million over ten years — roughly ¥16 million per room across 58 rooms. Who takes on that burden determines both the transfer price and the choice of scheme.
Point 3 Favorable against the cost of building new
Lodging construction starts in 2024 ran at ¥1.569 million per tsubo in Chugoku/Shikoku. At 50 m² per room including common areas, building new costs about ¥23.7 million per room. For a renovation that reuses the existing frame, the decisive question is what fraction of that it comes in at.
Distribution of the surviving stock — 30% of the 43 properties sit in Chugoku/Shikoku; by name, 106 properties and 2,673 rooms nationwide
By the Public Kokumin-Shukusha Association roster, there are 43 public Kokumin-Shukusha. The regional breakdown is Hokkaido/Tohoku 6, Kanto/Chubu 11, Hokuriku/Kansai 9, Chugoku/Shikoku 13, Kyushu 4. Chugoku/Shikoku accounts for 30.2% of the total, followed by Kanto/Chubu at 25.6%. This stock is not skewed toward the three major metropolitan areas; if anything it survives most thickly in the regional areas now losing population.
Searching our database for properties whose names include “Kokumin-Shukusha” — including those whose name records remain after suspension or closure — returns 106 properties and 2,673 rooms in total. Because the set mixes privately run Kokumin-Shukusha and properties that kept only the name after moving to private operation, the denominator is larger than the association roster’s 43. The regional distribution is Chugoku/Shikoku 28, Kanto/Chubu 28, Hokuriku/Kansai 19, Kyushu 17 and Hokkaido/Tohoku 14, broadly consistent with the roster’s pattern. Room counts are small: a median of 22 and an average of 25.2.
That small scale cuts both ways for deal-making. With an investment of only a few hundred million yen per property, a fund investing alone is inefficient; for a regional bank or a local operating company, however, the size is within reach, and there is room to bundle several properties into a portfolio. In practice, a profile of 28.9 rooms on average and an estimated ADR of ¥8,800 means annual room revenue at a single property does not reach ¥100 million.
Distribution of actual rates — a median estimated ADR of ¥8,800 across 38 Kokumin-Shukusha, against an upper quartile of ¥22,200 for regional ryokan
This is the core of the article: using our estimated settled ADR to quantify where municipally owned stock stands today, and how far that sits from the price band private operators achieve in the same trade area.
Start with the municipally owned side. Of the 106 name-matched properties, 38 had an observable estimated settled ADR for six months or more over the past year (August 2025 to August 2026). The distribution: Q1 ¥7,400, median ¥8,800, Q3 ¥13,500, 90th percentile ¥15,400. Fifteen properties sit below ¥8,000 and nine between ¥8,000 and ¥12,000, so a little over 60% fall under ¥12,000. The median guest review score is 4.21 (N=37 properties) — hardly low, which suggests pricing is restrained relative to how guests rate the experience.
For comparison, we took the estimated settled ADR of 280 ryokan and resort hotels with 20 or more rooms across the nine prefectures of Chugoku/Shikoku, where this stock is most densely concentrated. Q1 ¥9,900, median ¥15,100, Q3 ¥22,200, 90th percentile ¥31,200.
What is striking is that property size does not explain the gap. Splitting the 280 Chugoku/Shikoku properties by room-count band gives medians of ¥13,900 for 20-39 rooms, ¥13,500 for 40-59, ¥18,500 for 60-99 and ¥17,600 for 100 or more. Even in the 20-39 room band — the main range for Kokumin-Shukusha — the median is ¥13,900, far above the ¥8,800 of the 38 name-matched properties. They are not cheap because they are small.
More telling is the price difference by review-score band. Stratifying the same 280 properties by guest review score, the 92 properties at 3.99 or below have a median of ¥13,500 and the 68 properties between 4.00 and 4.29 sit at ¥13,300, while the 111 properties at 4.30 or above reach ¥20,700 — about 1.5x. This is not a claim of causation between scores and prices, but the fact that, among regional ryokan and resorts, the top band of guest experience actually sustains a price level around ¥20,000 is an empirical reference point when setting a target ADR after renovation.
The demand side — regional ryokan show a two-layer structure: low actual occupancy, but high sell-through of listed inventory
Before discussing price, it is worth checking the depth of demand on two measures. Macro actual occupancy comes from the Japan Tourism Agency’s “Overnight Travel Statistics Survey.” National room occupancy for 2025 was 61.8%; by property type, business hotels ran at 75.3%, city hotels 74.2% and resort hotels 56.9%, while ryokan came in at 38.4% — far behind. Across the ryokan segment as a whole, that means six out of ten rooms sit empty through the year.
On the other hand, the occupancy we estimate from the sell-through of OTA sales inventory (July 2026, ryokan category) is high everywhere: Aomori 90.3%, Ehime 88.5%, Hokkaido 87.6%, Akita 85.8%, Nagano 85.7%. These are different metrics with different populations and definitions, and cannot be compared directly. Place them side by side, though, and a structure emerges for regional ryokan: “the inventory put on OTAs sells well, but the property’s rooms as a whole are not filling.” Exposure to sales channels, troughs in demand (weekdays, winter), or a deliberate throttling of rooms offered because of staffing constraints — one of these is very likely at work, which makes it one of the most important items to verify in due diligence.
Operating benchmarks — results disclosed by listed hotel REITs for regional and resort portfolios
When testing whether the ADR, occupancy and RevPAR assumed in a deal are plausible against industry levels, the monthly results listed hotel REITs publish are the most reliable reference point. The figures below are quoted directly as each REIT published them (we have not re-aggregated them).
| REIT | Month reported | Disclosure scope | OCC | ADR | RevPAR | YoY |
|---|---|---|---|---|---|---|
| Hoshino Resorts REIT (星野リゾート・リート投資法人) | June 2026 | Whole portfolio | 74.2% | ¥18,478 | ¥13,716 | OCC −2.0pt / ADR −4.0% |
| Ichigo Hotel REIT (いちごホテルリート投資法人) | July 2026 | 22 of 25 owned hotels combined (excluding 3 closed for renovation) | 84.4% | ¥9,684 | ¥8,175 | OCC −0.7pt / ADR −0.8% |
| Japan Hotel REIT (ジャパン・ホテル・リート投資法人) | July 2026 | 29 hotels under variable-rent and similar structures | 83.1% | ¥21,806 | ¥18,119 | OCC +4.0pt / ADR +0.1% |
| Invincible Investment (インヴィンシブル投資法人) | July 2026 | 101 domestic hotels | 86.3% | ¥15,100 | ¥13,039 | OCC +1.9pt / ADR −1.0% |
Read the table this way. A portfolio centered on regional business and limited-service hotels runs at ADR ¥9,684 and OCC 84.4% (July 2026); a portfolio including resort and ryokan properties runs at roughly ADR ¥18,500 and OCC 74.2% (June 2026). The level a renovated piece of municipally owned stock should aim for sits between those two bands — realistically ADR ¥13,000-¥22,000 with OCC of 55-70%. That is consistent with our own data: an upper quartile of ¥22,200 for Chugoku/Shikoku ryokan and resorts, and a median of ¥20,700 for the 4.30-and-above review band.
The other thing the table shows is that ADR at resort and ryokan portfolios has turned negative year on year. The 2023-2025 price upcycle driven by urban inbound demand is running its course in regional resorts. For deals from 2026 onward, the financials should be built on moving the property’s own price band through product strength, not on riding a market-wide price rise.
A conversion track record — two years and ten months from transfer, and 16 months from opening, to move the estimated ADR from the ¥13,000 range to ¥20,400
The most direct answer our data can track to the question “how far does price move once a property leaves the framework” is a case in Oshu, Iwate. The former Kokumin-Shukusha Sun Hotel Koromogawa-so was transferred by the City of Oshu to the private sector in July 2022. The buyer was Nagamori Shoji Co., Ltd. (now Libera Hotels & Resorts Co., Ltd.). A renewal opening was initially planned for March 2024, but material-cost inflation stretched the construction schedule, and the property opened on 25 April 2025 as “Oshu-Hiraizumi Onsen Ryokan ITSUMU” with 42 rooms. Two years and ten months passed between transfer and opening.
The estimated settled ADR we observed after opening moved as follows. The opening month, April 2025, was around ¥13,000. It rose in stages to about ¥16,200 in November 2025 and about ¥17,100 in January 2026, reaching about ¥20,400 in August 2026. That is up 56.5% from the opening month and up 40.4% against the same month a year earlier (August 2025, around ¥14,500). The trailing 12-month average is about ¥15,600.
What deserves attention here is less the level reached than the shape of the climb. The property did not come out of the gate at a high rate; it lifted its price band in stages over a year and a half from opening. For a regional onsen ryokan, it takes one or two seasons before accumulated reviews and an occupancy record function as support for price — which means that, in a business plan, the realistic design is to set a conservative ADR for the first year of operation and reach the target level in years two to three. A plan that assumes the upper quartile of regional ryokan from the opening year is, on the evidence of this case, too optimistic.
Note too that this deal took two years and ten months from transfer to opening, with the schedule extended by a surge in construction material costs along the way. Building construction-cost inflation into the plan, discussed below, is not desk-bound conservatism — it is what actually happened.
Where the deals come from — municipalities open up their options first, through market sounding
Deals involving municipally owned lodging stock do not begin with a sale notice. In most cases, a sounding-type market survey comes first: a dialogue-based procedure in which the municipality invites opinions and proposals from the private sector before fixing the scheme. Whether you can take part in it materially shapes your position in the public tender that follows. Sourcing starts not at the notice but at the sounding.
Below are cases that have actually been published, organized within the limits of public information.
| Property / municipality | Building outline | Current status | Scheme and schedule indicated by the municipality |
|---|---|---|---|
| Kokumin-Shukusha Akatonbo-so (Tatsuno, Hyogo; inside Tatsuno Park) |
Opened 1962, 8 storeys, 32 guest rooms, 8 banquet rooms | Lodging and day-use operations suspended since April 2021. More than 60 years since opening, with advancing deterioration and sections that do not meet seismic standards | Designated manager system, sale of the building, introduction of Park-PFI and more — “examining commercialization without ruling out any possibility.” Site briefings on 29 July, 21 August and 6 September; sounding applications until 30 September |
| Kokumin-Shukusha Ryokan-so (Kurashiki, Okayama; Tamashima Kashiwajima) |
Built 1996, hilltop location | Closed since 16 July 2025, citing deterioration and a room mix out of step with demand | Exchange of views on schemes including concession and leasing. Dialogue sessions 11-16 December 2025, applications by 9 December |
| Kokumin-Shukusha Boyo-so (Unzen, Nagasaki; Obama-cho) |
Reinforced concrete and steel-frame, 3 storeys, building 1,784.84 m², land 3,806.91 m², opened October 1965, 21 rooms | Operating as a city public facility providing lodging, meals and bathing/day-use | Inviting private-sector ideas for use of the building excluding the lodging business (meals, bathing and day-use) |
The pattern on the municipal side is clear from these three. First, deterioration and seismic performance are the direct triggers for suspension or closure. Second, municipalities present more than one scheme rather than narrowing to a single option (designated manager / sale / Park-PFI / concession / lease). Third, there are cases where continuing the lodging business is not a mandatory condition (Boyo-so is asking about uses excluding lodging). On the question of whether to extend the life of pre-1981 seismic stock through renovation or commit to rebuilding, we set out the tipping point across 588 buildings in Japan’s Pre-1981 Hotel Stock: 236k Rooms, 19.1% — Retrofit or Rebuild.
The second and third points mean considerable freedom for the proposing side. Keep the frame and recompose the use; cut room count and raise the rate; scale back lodging and pivot to day-use bathing and restaurants — all of these are on the table as far as the rules are concerned. Put the other way round, the municipality’s decision turns not on “which scheme” but on “who takes on the repair burden and the jobs.” That is where a proposal is won or lost.
Issues by contract structure — what you acquire, and what you carry
| Structure | What you acquire | What you carry | Issues in structuring the deal |
|---|---|---|---|
| Designated manager (operating a publicly owned, publicly run facility under contract) | Operating authority (and revenue, where the usage-fee system applies) | Routine repairs, operating costs, payroll | Low initial outlay makes entry easy, but there is re-designation risk at the end of the designation period (typically 3-5 years), which does not match the payback period of large capital investment. Rate-setting is constrained by the assembly and by ordinance, structurally limiting how far ADR can move |
| Concession (public facility operating rights) | Operating rights (registrable as a property right, and available as collateral) | Operating costs plus the renewal investment defined in the contract | Because the operating right is a property right, project finance is easier to arrange. Terms are typically 20-30 years, consistent with investment payback. Ownership stays with the municipality, so the split of responsibility for large-scale renewal of the building frame must be carved out precisely in the contract |
| Lease (public ownership, private operation) | The right to use the building | Rent plus investment in interiors and equipment | Rent level and contract term are everything. Settle the scope of restoration obligations, whether fixtures can be required to be bought back, and rent revision clauses at the outset. Contracting while responsibility for frame renewal remains ambiguous invites disputes from year ten onward |
| Transfer (sale to the private sector) | Ownership (land and building) | Purchase price plus all repair and renewal investment | Maximum freedom. Even where the transfer price is nominal, the gap between book and market value, employment-succession conditions, any use restrictions or buy-back covenants, and obligations to repay public subsidies (property-disposal approval) become real costs. Restrictions on change of use during a designated-use period bear directly on the exit |
| Park-PFI (public invitation for park facility installation and management) | Permission to install and manage within the park (up to 20 years) | Facility development costs plus part of the park facilities | An option for properties located inside urban parks (Akatonbo-so sits within Tatsuno Park). Integrated development of revenue-generating and park facilities is a requirement, so the proposal must cover redevelopment of the park as a whole |
The institutional base is broad. According to a Ministry of Internal Affairs and Communications survey, as of 1 April 2021 the designated manager system had been introduced at 77,537 public facilities, of which 43.5%, or 33,708 facilities, had a “private company or similar” — a joint-stock company, an NPO and so on — as designated manager, up 3.1 points from the previous survey. At the prefectural level it covered 6,721 of 11,301 public facilities, an introduction rate of 59.5%. Lodging and recreation facilities are among the categories covered by that survey, so room for private-sector participation is already open as a matter of policy.
Deterioration and major repairs — ¥930 million over ten years, or about ¥16 million per room
The biggest variable in structuring a deal around municipally owned stock is neither price nor occupancy but capital expenditure. And here there are concrete numbers to be read off public documents.
Kokumin-Shukusha “U-no-Misaki” in Ibaraki opened in 1971; its main building, constructed in 1997, is a steel-framed reinforced concrete structure of eight storeys with a total floor area of 10,458 m², and the Country Plaza, built in 1989, is a single-storey reinforced concrete building of 741.57 m². The long-term repair plan drawn up for the property commits about ¥930 million over the next ten years, of which the prefecture bears roughly ¥650 million for frame work such as exterior wall repairs, and the designated manager, the Ibaraki Prefectural Development Corporation, bears roughly ¥280 million for building and equipment upgrades. The fiscal 2025 program is ¥41.237 million, covering roof and exterior wall repairs to the No. 3 women’s dormitory building, exterior wall repairs to the Country Plaza, and roof repairs to the gas store.
Divided simply by the 58 rooms our database records for the property, that is about ¥16 million per room over ten years, or about ¥1.6 million per room per year. And this is the cost of “maintaining the property at its current level” for a building around 30 years old; renovation spending to improve the product is on top. Anyone considering a transfer must assume that capital expenditure of this magnitude comes with the property, even where the transfer price itself is nominal. For reference, capital expenditure disclosed by listed hotel REITs for their holdings runs between ¥130,000 and ¥620,000 per room per year (Hotel Capex: ¥134k-¥624k per Room a Year — 5 REITs’ IR Disclosures), so the roughly ¥1.6 million a year required by public stock of about 30 years’ age sits well above the top of that range.
What this means for due diligence: “the acquisition price is low” is not a basis for an investment decision. What must be assessed is acquisition price plus ten years of capital expenditure, and only by comparing that total against the cost of building new can the economic case for reusing the existing frame be tested. Where a long-term repair plan already exists, obtaining that document is the top priority in due diligence.
Construction-cost inflation — lodging buildings nationwide are up 62.5% per tsubo in the five years from 2019
The comparison point, the cost of building new, has itself moved sharply over these five years. Calculating cost per tsubo (3.3 m²) from lodging-use buildings in the Ministry of Land, Infrastructure, Transport and Tourism’s “Construction Starts Statistics Survey” (estimated construction cost divided by floor area), the national average went from ¥1.203 million in 2019 through ¥1.386 million in 2022 to ¥1.955 million in 2024 — up 62.5% on 2019. The number of buildings has also recovered, from 2,300 in 2019 to 2,836 in 2024.
Regional differences in that unit cost are large, however. In 2024, against ¥2.174 million per tsubo in the three major metropolitan areas, Hokkaido/Tohoku ran at ¥2.003 million, Chugoku/Shikoku at ¥1.569 million and Kyushu/Okinawa at ¥1.353 million. In the regional areas where municipally owned stock is concentrated, building new costs 20-40% less than in the three major metropolitan areas. That works against the relative advantage of reusing an existing frame, and means one cannot automatically say “it is regional, so renovating is cheaper.”
Working back from these unit costs gives a per-room cost of building new. Assuming 50 m² per room including common areas (about 15.1 tsubo), the benchmark for new construction is about ¥23.7 million per room in Chugoku/Shikoku, about ¥20.5 million in Kyushu/Okinawa and about ¥32.9 million in the three major metropolitan areas. A renovation that reuses the existing frame and comes in at ¥15 million per room is 63% of the Chugoku/Shikoku cost of building new; a light renovation at ¥5 million per room is 21%. That ratio is the clearest yardstick for the economics of acquiring existing stock. A per-room construction cost built up from room-level unit areas in actual development plans is derived in Hotel Construction Cost ¥20.67M/Room: 35.0m² Floor Area in 31 Plans, which can be read alongside the per-tsubo benchmark used here.
On land, the 2026 official land price survey showed a nationwide average gain of 2.8% across all uses (residential +2.1%, commercial +4.3%), a fifth consecutive year of increases, with gains continuing in regional areas too. But much of the municipally owned stock this article covers sits inside parks, along coastlines or in hot-spring districts, where absolute land values are low. In these deals, value comes not from unrealized gains on land but from the building frame, hot-spring rights, permits and the operating record — a fundamentally different valuation build-up from urban properties.
Development scenarios — three ways to structure a 30-room onsen property
Using the figures above, we model three scenarios for a typical municipally owned property: 30 guest rooms, hot spring, roughly 30 years old. ADR is set from the observed distribution of our estimated settled ADR, and the GOP ratio from general levels by property type. This is a simplified model only; an actual investment decision requires a detailed feasibility study.
| Item | A. Status quo (public ownership and operation, designated manager) | B. Light renovation (guest rooms and bathrooms plus price design) | C. Full conversion (fewer rooms, higher value)Recommended |
|---|---|---|---|
| Rooms | 30 | 30 | 24 (reduced) |
| Assumed ADR | ¥8,800 | ¥13,500 | ¥22,200 |
| Basis for ADR | Median of the 38 properties named Kokumin-Shukusha | Their upper quartile / median of the 20-39 room band for regional ryokan | Upper quartile of Chugoku/Shikoku ryokan and resorts |
| Assumed OCC | 45% | 55% | 60% |
| RevPAR | ¥3,960 | ¥7,425 | ¥13,320 |
| Annual total revenue (rooms + F&B) | ¥74M | ¥134M | ¥187M |
| GOP ratio | 8% | 18% | 28% |
| GOP | ¥6M | ¥24M | ¥52M |
| Renovation cost (per room) | — | ¥5M | ¥15M |
| Acquisition price + renovation | — | ¥250M | ¥460M |
| GOP yield | — | 9.7% | 11.4% |
| Simple payback period | — | 10.4 years | 8.8 years |
| After construction inflation (assuming a 2028 start) | — | Total investment ¥273M Yield 8.8% | Total investment ¥516M Yield 10.1% |
Scenario C is recommended not for the absolute level of its yield but for its resilience to downside. With ADR cut 10% and OCC cut 5 points, Scenario C still holds a 9.4% yield (payback 10.7 years), while Scenario B falls to 7.9% (payback 12.7 years). It is more resilient despite costing more than twice as much to renovate because reducing the room count raises the product quality per room and moves the property into a price band with a higher GOP ratio.
| Sensitivity case | B. Total revenue | B. GOP | B. Yield | C. Total revenue | C. GOP | C. Yield |
|---|---|---|---|---|---|---|
| Base case | ¥134M | ¥24M | 9.7% | ¥187M | ¥52M | 11.4% |
| ADR −10% | ¥121M | ¥22M | 8.7% | ¥168M | ¥47M | 10.2% |
| OCC −5pt | ¥122M | ¥22M | 8.8% | ¥171M | ¥48M | 10.4% |
| ADR −10% and OCC −5pt | ¥110M | ¥20M | 7.9% | ¥154M | ¥43M | 9.4% |
Rather than a single sensitivity case, flexing assumed ADR and assumed OCC together on a two-axis grid sharpens the outline of the conditions under which Scenario C works. Even if ADR falls to ¥19,980 (10% below base), securing 55% occupancy holds the yield at 9.4%; conversely, if occupancy stalls at 50%, the yield drops to 9.5% even at an ADR of ¥22,200. What governs the profitability of this scenario is less the ADR level itself than how far the 24 remaining rooms can be filled across the year.
| Assumed ADR | OCC 50% | OCC 55% | OCC 60% | OCC 65% | OCC 70% |
|---|---|---|---|---|---|
| ¥17,760 (−20%) | 7.6% | 8.3% | 9.1% | 9.8% | 10.6% |
| ¥19,980 (−10%) | 8.5% | 9.4% | 10.2% | 11.1% | 11.9% |
| ¥22,200 (base) | 9.5% | 10.4% | 11.4% | 12.3% | 13.3% |
| ¥24,420 (+10%) | 10.4% | 11.5% | 12.5% | 13.5% | 14.6% |
| ¥26,640 (+20%) | 11.4% | 12.5% | 13.6% | 14.8% | 15.9% |
Scenario C does, however, need the time axis shown by the conversion case above built into it: two years and ten months from transfer to opening, and another year and a half from opening to the target ADR. The practical assumption is around four years from acquisition before revenue reaches planned levels, and the structure must account for cash flow and funding costs over that period.
Due diligence checklist — 12 items to add to private-property DD
Due diligence on municipally owned stock layers public-sector-specific issues on top of ordinary hotel acquisition DD. The following is limited to what should be added to a private-property DD list.
| Area | Item to check | Why it matters / the trap |
|---|---|---|
| Property and rights | History of public subsidies and whether property-disposal approval is required | A facility built with national or prefectural subsidies needs the competent ministry’s approval for any change of use or transfer within the disposal-restriction period. If approval is withheld, or subsidy repayment is triggered, the acquisition structure collapses. Check this first |
| Designated-use conditions and buy-back covenants, and their duration | Transfer agreements often carry a designated use — “operate as a lodging facility for X years.” Because that directly constrains the timing of an exit (resale or change of use), always confirm the period and the penalty clauses in the contract text | |
| Hot-spring rights (usage rights and ownership of the source) | The source may be owned by the municipality or a hot-spring cooperative, with the property holding only a supply contract. Supply volume, unit price, contract term and renewal conditions define the premises of the product design (Who Owns the Hot Spring? Water Rights and Ryokan Valuation). If the rights to the source do not transfer, the ADR assumption does not hold | |
| Building and repairs | Whether a long-term repair plan exists, its total and the split of responsibility | Where one exists, take the amounts and the year-by-year program as given. In the published case above, ¥930 million over ten years, about ¥16 million per room. Where none exists, cost it out yourself and use actual replacement cost, not book value |
| Seismic assessment results and retrofit history | A pre-1981 building, or one assessed but with sections left unretrofitted, is a direct cause of suspension or closure. Seismic retrofit spend contributes nothing to room product quality — a pure fixed cost that should be assessed separately from the payback calculation | |
| Outstanding asbestos, PCB and plumbing-renewal work | For buildings from the 1970s and 1980s, survey records may not survive (64.5% of Japan’s Hotel Rooms Predate 2006 — Asbestos Adds Up to 25.8%). Removal costs feed straight into the schedule and, as in the case above, can push an opening back by more than a year | |
| Operations and staffing | Employment-succession conditions (municipal staff and the current designated manager’s employees) | Municipalities sometimes make continued employment a condition of transfer or tender. Payroll becomes fixed, shifting the GOP assumption. Maintaining local jobs is also a scoring point in proposals, so it cannot be treated as a pure cost question |
| Sales-channel mix and historical occupancy | Municipal facilities tend to lean heavily on municipal publicity, group bookings and telephone reservations, with limited OTA exposure. Our data likewise shows inventory published on OTAs selling through strongly while the property’s overall occupancy has room left. Whatever headroom exists in channel redesign converts directly into occupancy upside | |
| Contracts and regulation | Remaining term of the designated management contract and its penalty clauses | Transferring or moving to a concession while the current designated management contract runs should as a rule be timed to its expiry. Check the early-termination penalty and who bridges operations until the handover |
| Rate ceilings under ordinance and the revision procedure | Where the property stays a public facility, a usage-fee ceiling may be set by ordinance. The level of that ceiling, and the procedure and time needed to revise it, form the effective ceiling on ADR design | |
| Location and trade area | Designations such as urban park, natural park or protected forest | Inside an urban park, the Urban Parks Act governs extension and rebuilding (including Park-PFI); inside a national or quasi-national park, the Natural Parks Act does. Whether floor area can be added or the exterior altered shapes the choice of scheme itself |
| Competing supply within the catchment radius and gaps in the price band | New supply is thin in regional areas, so gaps in the price band tend to persist. In Chugoku/Shikoku, the upper quartile for the 280 ryokan and resorts with 20+ rooms is ¥22,200 and the 90th percentile ¥31,200. How high a price band existing competitors already achieve sets the ceiling on repositioning |
A practical sourcing sequence
Step 1 | Monitor public disclosures continuously
Each municipality’s “public property utilization” and “sounding-type market survey” pages, plus comprehensive public facility management plans and individual facility plans. A suspension or closure notice is a signal one to two years ahead of a deal.
Step 2 | Engage at the sounding stage
Take part in the pre-notice dialogue and establish what the municipality wants — jobs, local contribution, repair burden. At this stage you can still influence the set of schemes on offer.
Step 3 | Quantify the repair burden
Obtaining the long-term repair plan is the first priority. If none exists, cost ten years from a building survey and judge the economics against the cost of building new (¥20-24 million per room in regional Japan) (Japan Lodging Capex Is 1.51x Depreciation — ¥431k per Room a Year).
Step 4 | Set the target ADR empirically
Derive it from the observed distribution in the same trade area. Target the upper quartile rather than the median, and phase it: a conservative figure in year one, reaching the target in years two to three.
Step 5 | Choose the scheme
If the plan extends to large-scale renewal of the frame, transfer or concession. If it stops at interiors and operational improvement, lease or designated management. Match the payback period to the duration of the rights.
Step 6 | Fund on a four-year assumption
Around four years from acquisition until revenue reaches planned levels. Build in schedule-extension risk from material-cost inflation, and include one to two seasons of price ramp-up after opening.
In summary — operating public stock carries a different risk-return structure from a vacant site
The 43 public Kokumin-Shukusha (Hokkaido/Tohoku 6, Kanto/Chubu 11, Hokuriku/Kansai 9, Chugoku/Shikoku 13, Kyushu 4) are what survives after a fall to roughly one-eighth of the 345-property peak of fiscal 1979-1981. The profile our database returns for name-matched properties — 106 properties, 2,673 rooms, an average of 25.2 rooms — shows what that means: small property by property, but an inventory too large to ignore in aggregate, and concentrated in regional Japan.
The figures established in this article come down to three. First, the distance in price. Against a median estimated settled ADR of ¥8,800 across the 38 properties named Kokumin-Shukusha, the 280 ryokan and resorts with 20+ rooms in Chugoku/Shikoku run at a median of about ¥15,100 and an upper quartile of about ¥22,200. The band scoring 4.30 or above in guest reviews has a median of ¥20,700, an empirical reference point for a target. Second, the proof that the move happens. At a property converted after transfer to the private sector, the rate moved from the ¥13,000 range in the opening month to ¥20,400 in 16 months (up 40.4% year on year). Third, the cost of that move. One public property’s long-term repair plan runs to about ¥930 million over ten years, or about ¥16 million per room, against a cost of building new in regional Japan of ¥20-24 million per room.
The decisive difference from vacant-site and closed-school deals is that an operating record, permits, hot-spring rights and a workforce already exist. That is upside — start-up risk is lower — and at the same time a burden to be assumed: repairs, employment, designated use. The basic discipline for turning operating public stock into a deal is to assess that duality not by acquisition price but by the total of “acquisition price plus ten years of capital expenditure,” and to judge it as a ratio against the regional cost of building new.
And the deal starts at the sounding, not the notice. Notices of suspension or closure citing deterioration and seismic performance, revisions to comprehensive public facility management plans, and published sounding-type market surveys: monitoring those three continuously is the highest-return initial investment available to anyone sourcing regional deals.
⚠ A note on the estimates in this article: ADR figures here are estimated settled rates calculated from OTA published prices and differ from each property’s actual transacted prices and accounting figures. The yields and payback periods in the development scenarios are simplified models based on public statistics and our own estimates; an actual investment decision requires a detailed, property-specific feasibility study. The schedules shown for each municipality’s sounding-type market survey are as published at the time, and current application status must be confirmed against the municipality’s latest notice.
Related reading
- Park-PFI Hotels at 203 Parks: 20-Year Permit Needs ¥11,300 ADR
- Corporate Retreat Conversions: 8.27% GOP Yield Across 5 Onsen Areas
- Who Owns the Hot Spring? Water Rights and Ryokan Valuation
- 64.5% of Japan’s Hotel Rooms Predate 2006 — Asbestos Adds Up to 25.8%
- Japan Lodging Capex Is 1.51x Depreciation — ¥431k per Room a Year
- Hotel Acquisition Costs 7.1%: A 6.5% Gross Yield Becomes 4.65% Net
- Japan’s Pre-1981 Hotel Stock: 236k Rooms, 19.1% — Retrofit or Rebuild
- Hotel Capex: ¥134k–¥624k per Room a Year — 5 REITs’ IR Disclosures
- Hotel Construction Cost ¥20.67M/Room: 35.0m² Floor Area in 31 Plans
- Department Store Sites: 6 of 14 Go Hotel, ADR Needs 1.4-3.1x Market
- Leasehold Hotel Development: 1.38x Land Price Reach Across 9 Markets
References and Sources
■ Data sources
Estimated settled ADR is an estimated transacted rate (tax-excluded equivalent) calculated by applying a property-type correction factor to the lowest published plan rate each property lists on OTAs (double occupancy, per-room rate, tax included). The period covered is monthly values from August 2025 to August 2026; for the Kokumin-Shukusha name basis, N=38 properties with six or more months of observation out of the 106 matched by property-name search, and the comparison group is N=280 ryokan and resorts with 20 or more rooms across the nine prefectures of Chugoku/Shikoku. Estimated occupancy is an estimate for the ryokan category in July 2026 based on the sell-through of OTA-listed inventory (25 prefectures, N=2,751 properties and 76,126 rooms). REIT results are quoted directly from the monthly operating results each investment corporation published, with no re-aggregation on our side. Construction costs are cost per tsubo calculated from estimated construction cost divided by floor area for use category “52 lodging” in the Ministry of Land, Infrastructure, Transport and Tourism’s “Construction Starts Statistics Survey.”
■ Model assumptions
The development scenarios assume a profile of 30 guest rooms, a hot spring and roughly 30 years of age. Acquisition price ¥100 million; renovation cost ¥5 million per room for the light renovation and ¥15 million per room for the full conversion. Assumed ADR is taken from our estimated settled ADR distribution (status quo = median of the Kokumin-Shukusha name basis; light renovation = their upper quartile; full conversion = upper quartile of Chugoku/Shikoku ryokan and resorts). Total revenue including F&B is set at 1.60-1.70x room revenue, and the GOP ratio conservatively from general levels by property type (limited-service 50-60%, resort 20-40%, ryokan 5-15%). Construction inflation is applied on a compound basis at +5.3% (2026), +5.0% (2027) and +4.5% (2028). The sensitivity grid computes GOP yield = (rooms x ADR x OCC x 365 days x total-revenue multiple x GOP ratio) / total investment, with total investment before construction inflation in the denominator.
■ Limitations and caveats
ADR figures are estimates and differ from each property’s actual transacted prices and accounting figures. OCC is an estimate based on OTA-listed inventory; because its population and definition differ from the actual occupancy rate published in the Japan Tourism Agency’s “Overnight Travel Statistics Survey,” the two are not compared arithmetically. The 106 properties matched on the Kokumin-Shukusha name include privately run Kokumin-Shukusha and properties whose name records remain after suspension or closure, so the denominator does not match the association roster’s 43. The yields and payback periods in the development scenarios are simplified models based on public statistics and our own estimates; acquisition price, renovation cost and GOP ratio are all assumed values and not an appraisal of any specific property. An actual investment decision requires a detailed, property-specific feasibility study. The schedules for each municipality’s sounding-type market survey are as published at the time, and current application status should be confirmed against the municipality’s latest notice.
■ Market data
- MetroEngines Research & Consulting — estimated settled ADR (properties matching the name “Kokumin-Shukusha” N=38 / Chugoku-Shikoku ryokan and resorts with 20+ rooms N=280), estimated occupancy (July 2026, ryokan category, 25 prefectures, N=2,751 properties and 76,126 rooms), property master (N=106 properties, 2,673 rooms)
- Guest review scores compiled by the HotelBank Editorial Team
■ Primary information and public statistics
- Public Kokumin-Shukusha Association, “List of Public Kokumin-Shukusha” (43 properties and regional breakdown, as of 2026)
- Japan Tourism Agency, “Overnight Travel Statistics Survey (2025 annual, preliminary)” (published 27 February 2026; room occupancy 61.8% overall / ryokan 38.4% / resort hotels 56.9% / business hotels 75.3% / city hotels 74.2%)
- e-Stat, “Construction Starts Statistics Survey” (statistics ID: 0003114490; number of buildings, floor area and estimated construction cost for use category “52 lodging,” 2015-2024) / MLIT Construction Starts Statistics Survey
- Ministry of Internal Affairs and Communications, “Survey Results on the Introduction of the Designated Manager System at Public Facilities” (as of 1 April 2021; 77,537 facilities / private companies and similar 43.5%, 33,708 facilities)
- Kokumin-Shukusha (history of the system, peak of 345 properties in FY1979-1981, establishment and operation guidelines)
- Public Kokumin-Shukusha Association, “What is a Kokumin-Shukusha?” (the purpose of the system: providing recreation at low cost)
■ REIT monthly operating results
- Hoshino Resorts REIT (星野リゾート・リート投資法人) IR library (June 2026 results)
- Ichigo Hotel REIT (いちごホテルリート投資法人), “Monthly Operating Results” (July 2026 results)
- Japan Hotel REIT (ジャパン・ホテル・リート投資法人) IR materials (July 2026 results, 29 hotels under variable-rent and similar structures)
- Invincible Investment (インヴィンシブル投資法人), “Monthly Operating Results” (July 2026 results, 101 domestic hotels)
■ Case studies and municipal disclosures
- Iwanichi Shimbun, “ITSUMU opens on the 25th as a tourism base for Oshu and Hiraizumi — the former Koromogawa-so, transferred by the city to the private sector” (22 April 2025)
- Iwate Nippo, “Onsen ryokan ITSUMU opens on the 25th — Oshu City, the renovated former Koromogawa-so” (22 April 2025)
- Libera Gaming Operations Co., Ltd., “Handover ceremony for the former Kokumin-Shukusha Sun Hotel Koromogawa-so, Oshu, Iwate” (July 2022)
- Nihon Kogyo Keizai Shimbun, “Long-term repair plan drawn up for Kokumin-Shukusha U-no-Misaki / exterior wall repairs and HVAC renewal” (about ¥930 million over ten years)
- Nikkei BP, New Public-Private Partnership Frontline, “Private-sector vitality for a Kokumin-Shukusha with lodging suspended: Tatsuno City holds a sounding on utilization”
- Tamashima Chamber of Commerce and Industry, “On the second sounding-type market survey (Washuzan Rest House and Kokumin-Shukusha Ryokan-so)”
- City of Unzen, “On the sounding-type market survey for private-sector utilization of Unzen City Kokumin-Shukusha Boyo-so”
- Nikkei BP, New Public-Private Partnership Frontline, “Operating a whole-house machiya hotel under a concession, Tsuyama City”
■ References for investment assumptions
- JLL, “Japan Hotel Investment Market 2025” (construction-cost inflation, new supply rate, GOP outlook)
- Invincible Investment portfolio (actual GOP ratios)
- MLIT official land price survey (2026: all-use average +2.8% / residential +2.1% / commercial +4.3%)