

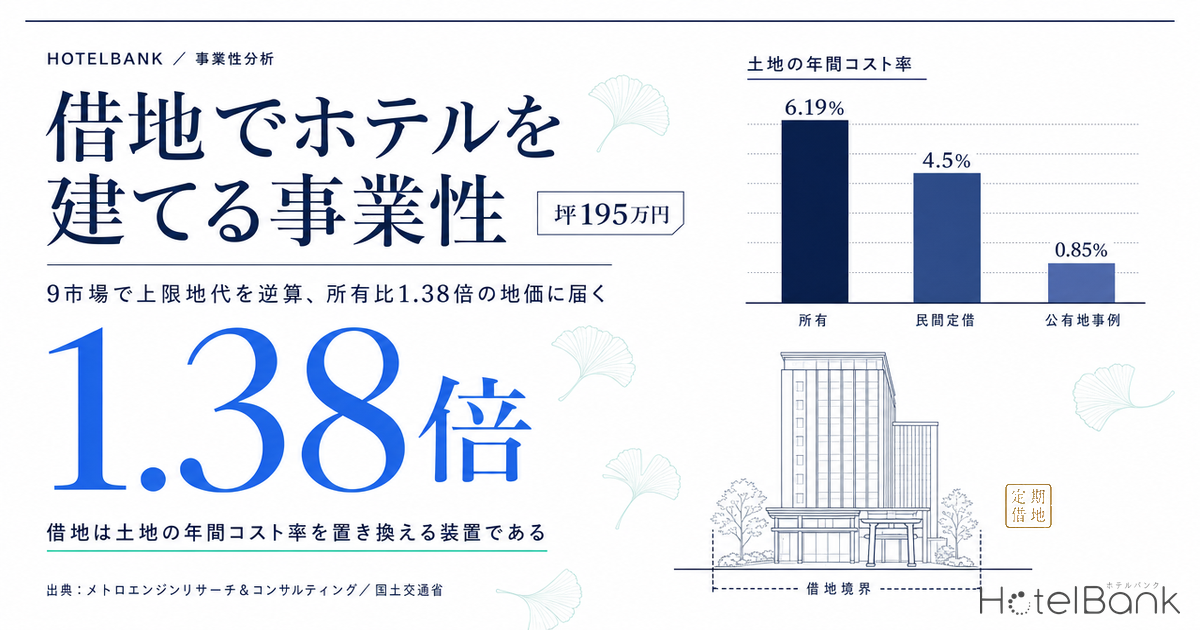
Buy the land, then build the hotel — that assumption is now audibly cracking. According to the Ministry of Land, Infrastructure, Transport and Tourism (MLIT) Building Construction Starts Statistics, the planned construction cost for accommodation-use buildings climbed to ¥1.95 million per tsubo (1 tsubo = 3.31㎡) in 2024. That is a 76% increase in seven years from ¥1.11 million per tsubo in 2017. Over the same period commercial land prices in major cities kept rising: in the 2025 Official Land Price survey, commercial land around Asakusa in Tokyo recorded +21.3% year on year (median of surrounding survey points, N=10 points). When construction costs and land prices run together, development cost overtakes what the operating economics can carry.
The escape route being chosen with increasing speed in practice is development that does not buy the land but leases it — hotel development under a business-use fixed-term leasehold (Article 23 of the Act on Land and Building Leases). This article back-calculates, from official land prices, estimated settled ADR and occupancy across nine markets nationwide, the supportable ground rent and the affordable land price for a limited-service hotel. The conclusion up front: on identical operating economics, the leasehold route reaches land that is 1.38 times more expensive than the freehold route can carry. And what decides success or failure is not the level of the ground rent so much as the contract term.
Metric Definitions Used in This Article
- ADR (average daily rate) = an estimated settled rate (tax-exclusive equivalent) calculated by applying a segment-specific adjustment factor to the lowest published plan level each property lists on OTAs and similar channels (double occupancy, per-room price, tax-inclusive). Cross-checked against property-level disclosures by listed hotel REITs, the median error is about 7%. These are estimates and differ from each property’s actual transacted prices and accounting figures. Area-level ADR is the median of the properties covered (the level of a typical property in that area).
- OCC (occupancy) = room occupancy by prefecture and accommodation type from the Japan Tourism Agency Overnight Travel Statistics Survey (monthly average for calendar year 2025). The calculations here use the business-hotel figure for the prefecture each market belongs to.
- RevPAR = ADR × OCC (revenue per available room).
- GOP (gross operating profit) = revenue less operating expenses attributable to running the property. This article assumes 50% of revenue as a benchmark for limited-service hotels.
- Land share = land value ÷ (land value + building investment). It shows how much of total investment the land accounts for when the same building is constructed.
- Capital recovery factor = the annual amount required, as a ratio to the investment, to recover the building investment in equal instalments of principal and interest within the contract term at a given discount rate.
- Data sources: MetroEngines Research & Consulting / MLIT Real Estate Information Library (Official Land Prices) / MLIT Building Construction Starts Statistics / Japan Tourism Agency Overnight Travel Statistics Survey
- — 1.38x — replacing the 6.19% annual land-holding cost ratio of ownership with a 4.5% ground rent ratio lifts the land price reachable on identical operating economics by 1.38 times. This factor is constant across all nine markets.
- — Three markets work only on a leasehold — Hakata Station-front, Namba and Shinjuku Station East, which never reach 100% coverage on a freehold basis, flip to 105–120% on a 30-year lease.
- — The term is the watershed — between a 30-year and a 49-year contract the annual building recovery burden differs by 1.00 percentage point (18% in relative terms), equivalent to ¥3.58 million per room of additional land-paying capacity.
- — Negotiating value is concentrated between 20 and 40 years — the capital recovery factor spikes below 20 years and flattens out beyond 40. This is exactly why Park-PFI’s 20-year ceiling sits heavily on capital-intensive uses.
- — Public land carries a 0.85% ground rent ratio — backing out the assumed terms for Block 15, Sumiyoshi-cho, Kagoshima gives roughly 0.85% against the median official land price for surrounding commercial land, an order of magnitude below the 4–5% a year seen in the private market.
Executive Summary — Replacing a 6.19% Annual Land Cost Ratio with a 4.5% Ground Rent Ratio
The skeleton of the calculation is simple. Whatever remains of the hotel’s GOP after deducting the building recovery amount, building property tax and the capital expenditure reserve is the ceiling on what can be paid for the land. Under ownership that residual has to cover “land price × (cost of capital + property taxes)”; under a leasehold it only has to cover “land price × ground rent ratio”. If the former burden is 6.19% a year and the latter 4.5%, the leasehold route reaches land priced 6.19 ÷ 4.5 = 1.38 times higher.
This 1.38x factor is constant across all nine markets. What varies by market is the absolute amount available for land in the first place — and that is where ADR, occupancy, floor area ratio and construction cost come in. The discussion below starts with the legal frameworks.
Six Frameworks for Building a Hotel on Leased Land — What Separates Park-PFI Is Term and Collateral
“Building a hotel without owning the land” covers several distinct regimes, differing in governing law, term and exit. The three points to sort out first in practice are: (1) the contract term, (2) how the building is treated at expiry, and (3) whether a lender can take security. The third directly determines whether the project can be financed at all.
| Framework | Governing law | Contract term | Form of contract | At expiry | Security over building and rights |
|---|---|---|---|---|---|
| Business-use fixed-term leasehold (long) | Act on Land and Building Leases, Art. 23(1) | 30 to under 50 years | Notarial deed mandatory (Art. 23(3)) | No renewal, no building buy-out claim. Land returned cleared as a rule | A mortgage can be created over both the leasehold and the building. In practice lenders require the landowner’s consent letter and notice provisions on termination |
| Business-use fixed-term leasehold (short) | Act on Land and Building Leases, Art. 23(2) | 10 to under 30 years | Notarial deed mandatory | As above | As above, but the short term leaves little room to structure a loan tenor |
| General fixed-term leasehold | Act on Land and Building Leases, Art. 22 | 50 years or more | Written form (notarial deed not required) | No renewal, no building buy-out claim. Land returned cleared | Available. The long term aligns well with long-tenor financing |
| Leasehold with building transfer covenant | Act on Land and Building Leases, Art. 24 | 30 years or more | Addition of a special covenant | The landowner buys the building at a reasonable price | Available. Unlike other fixed-term leaseholds, residual exit value remains in the building |
| Ordinary leasehold | Act on Land and Building Leases, Art. 3 and others | 30 years or more, renewable | No restriction | Renewed. A building buy-out claim exists | Available. But the land is tied up long term, so landowners rarely choose it |
| Installation and management permit (Park-PFI) | Urban Park Act, Arts. 5 and 5-2 | 20 years maximum | Certification of a public-solicitation installation plan | Restoration to original condition at the end of the permit period | An administrative disposition that creates no leasehold right; security over the right is not contemplated |
A distinction frequently muddled — alongside the new funding routes HotelBank has covered previously, such as real estate security tokens — is the one between Park-PFI and a fixed-term leasehold. Park-PFI, created by the 2017 amendment to the Urban Park Act, certifies the installation plan of an operator selected through public solicitation and allows the normal 10-year installation and management permit to be extended to a maximum of 20 years. It also comes with a special provision relaxing the building coverage ratio for park facilities from the usual 2% to 12%. As of March 2026 it is in use at 165 parks nationwide.
The regime is powerful, but from a hotel development standpoint its character is entirely different. An installation and management permit is an administrative disposition; it does not vest the operator with a leasehold as a property right. That makes it hard for lenders to take security over the right itself, and the 20-year cap is short against the physical life of the building (several decades for reinforced concrete). The earning potential inherent in a park location and the constraints the regime imposes are examined case by case in our analysis of the investment opportunity in in-park hotel development under Park-PFI. A paid lease under a business-use fixed-term leasehold, by contrast, is a private-law right established by notarial deed: the term can be designed contractually between 10 and 50 years, and a mortgage can be created over both the leasehold and the building. Term, the nature of the rent, the restoration obligation and the availability of security all differ — so even within the same conversation about “building a hotel on public land”, the feasibility case is assembled in a completely different way.
The Structure of Feasibility — A Leasehold Is a Device for Lowering the Annual Cost Ratio of Land
The essence of the leasehold route is not that you avoid paying for land. It is that the annual cost ratio applied to the land is swapped from the ownership level down to the ground rent level.
Under ownership, the capital committed to the land carries a cost of capital, and fixed asset tax and city planning tax accrue every year on top. Assessed values for commercial land are set at roughly 70% of the official land price, and a combined 1.7% (1.4% fixed asset tax plus 0.3% city planning tax) is levied on that. Restated on an official land price basis, the effective rate is 1.19% a year. At a 5% cost of capital, the annual cost ratio of land under ownership is 5% + 1.19% = 6.19%.
Ground rent under a business-use fixed-term leasehold, meanwhile, is in practice most often set at a benchmark of “4–5% of land value per year”. Fixed asset tax on the land is borne by the landowner, so the tenant’s land-related cost is the rent alone. This is where ownership and leasehold diverge.
As long as the ground rent ratio stays below the ownership-basis yield, the leasehold route lifts the return on invested capital. The lift is larger the higher the land share.
Two things follow from this formula. First, whether a leasehold is advantageous is not determined by whether land is expensive or cheap. It is determined by the relationship between the ground rent ratio and the project yield. Second, the higher the land share in a market, the more strongly leasehold leverage works. The corollary is that the moment the ground rent ratio exceeds the project yield, that same high land share goes into reverse.
What matters in practice, then, is the back-calculation: “in this location, for this format, how much ground rent can be paid?” The formula is as follows, and every term can be filled in from observable figures.
Affordable land price = supportable ground rent ÷ ground rent ratio
Having to recover the building investment in full within the contract term is the defining feature of the leasehold route. Under ownership the land remains at the end of the period, so securing a yield covering the cost of capital is enough. Under a leasehold the building is demolished and the site returned cleared at expiry, so the entire building investment must be recovered within the term. The weight of that recovery is expressed by the capital recovery factor, which spikes as the contract term shortens. As shown below, this is the watershed of feasibility.
Setting the Assumptions — Accommodation Buildings at ¥1.95M per Tsubo, +76% vs 2017
The starting point of the back-calculation is the building investment. Dividing planned construction cost by floor area in the use-classified data of MLIT’s Building Construction Starts Statistics yields a per-tsubo cost series for accommodation-use buildings. From ¥1.11 million per tsubo in 2017 the figure held broadly between ¥1.10 and ¥1.25 million through 2021, jumped to ¥1.39 million in 2022, and reached ¥1.954 million per tsubo in 2024 — +76% over seven years and +41% even against 2022 (¥1.39 million per tsubo). This construction cost level is itself a force compressing new supply volumes over the 2027–2029 window.
The calculations here take that statistic as an upper reference point and set ¥1.8 million per tsubo as the base case, assuming a limited-service format with a tightened specification. With 18㎡ guest rooms and a 72% guest-room ratio, gross floor area is 25.0㎡ per room (7.56 tsubo); adding 18% for design supervision, FF&E and pre-opening costs gives a building investment of ¥16.06 million per room. Sensitivity to construction cost assumptions of ¥1.5 million and ¥2.1 million per tsubo is shown later.
It is worth checking this level against transaction prices. Dividing the property-level acquisition prices disclosed by six listed hotel REITs by room count gives a median of ¥22.6 million per room across 282 properties of 30 rooms or more (first quartile ¥11.7 million, third quartile ¥39.63 million). Restricted to the 48 properties acquired from 2023 onwards, the median rises to ¥28.02 million. Acquisition prices include the land, so an assumption of ¥16.06 million for the building alone is consistent with observed market levels.
There is an implication here. The gap between transaction prices (median ¥22.6 million including land) and the cost of the building alone if built new today (¥16.06 million) is only ¥6.54 million. Urban land cannot possibly be bought with that difference. That distance between cost and market price is part of the background to the wave of cancelled and postponed projects. The leasehold route attacks that distance from the side of the land’s annual cost ratio.
Back-Calculating Nine Markets — Three Work Only on a Leasehold
For nine hotel clusters nationwide, official land price points for commercial land within an 800m radius of each centre point (101 points in total) were aggregated and the median taken as the prevailing land price. The floor area ratio is the median of the same set of points, and with an 85% utilisation rate the required site area per room is derived. On the revenue side, the estimated settled ADR for the ward or city each market sits in (trailing 12-month average) is multiplied by the prefecture’s business-hotel room occupancy (calendar 2025 average) to give RevPAR; other revenue is added at 10% and a 50% GOP margin applied.
| Market | Prevailing land price ¥/㎡ | FAR | Est. settled ADR | OCC | RevPAR | GOP ¥/room/yr | Land share |
|---|---|---|---|---|---|---|---|
| Kyoto Shijo-Karasuma Shimogyo-ku, Kyoto | 1,380,000 | 550% | ¥15,479 | 77.3% | ¥11,965 | ¥2,402,027 | 31.5% |
| Tokyo Asakusa Taito-ku, Tokyo | 1,480,000 | 600% | ¥14,398 | 81.5% | ¥11,734 | ¥2,355,675 | 31.1% |
| Sapporo Susukino Chuo-ku, Sapporo | 1,800,000 | 800% | ¥14,379 | 76.1% | ¥10,942 | ¥2,196,691 | 29.2% |
| Kanazawa Station-front Kanazawa, Ishikawa | 342,000 | 400% | ¥10,164 | 72.0% | ¥7,318 | ¥1,469,105 | 13.5% |
| Fukuoka Hakata Station-front Hakata-ku, Fukuoka | 3,105,000 | 550% | ¥14,279 | 77.8% | ¥11,109 | ¥2,230,144 | 50.8% |
| Osaka Namba Chuo-ku, Osaka | 3,420,000 | 700% | ¥12,195 | 82.9% | ¥10,110 | ¥2,029,513 | 47.2% |
| Tokyo Shinjuku Station East Shinjuku-ku, Tokyo | 7,295,000 | 800% | ¥16,131 | 81.5% | ¥13,147 | ¥2,639,213 | 62.5% |
| Hiroshima Kamiyacho Naka-ku, Hiroshima | 2,180,000 | 800% | ¥9,950 | 76.2% | ¥7,582 | ¥1,522,066 | 33.3% |
| Sendai Station-front Aoba-ku, Sendai | 1,110,000 | 600% | ¥9,657 | 69.4% | ¥6,702 | ¥1,345,418 | 25.3% |
Land share ranges from 62.5% at Tokyo Shinjuku Station East to 13.5% at Kanazawa Station-front — a spread of roughly five times. Build the same hotel to the same specification and the weight of land in total investment still differs completely by market. Leasehold leverage bites hardest in high land-share markets such as Shinjuku, Hakata and Namba; in a market like Kanazawa, where the land share is in the 13% range, switching to a leasehold does little to lighten the investment.
Next, the affordable land price derived from these economics is set against the prevailing land price as a ratio — the coverage ratio. Above 100% means the operating economics can carry the standard commercial land price level of that market.
| Market | Supportable ground rent 30-yr lease, ¥/room/yr | Supportable ground rent 49-yr lease, ¥/room/yr | Affordable land price 49-yr lease, ¥/㎡ | Coverage freehold | Coverage 30-yr lease | Coverage 49-yr lease |
|---|---|---|---|---|---|---|
| Kyoto Shijo-Karasuma | ¥1,052,519 | ¥1,213,336 | ¥5,042,086 | 230.4% | 316.9% | 365.4% |
| Tokyo Asakusa | ¥1,009,875 | ¥1,170,692 | ¥5,307,137 | 224.9% | 309.3% | 358.6% |
| Sapporo Susukino | ¥863,609 | ¥1,024,427 | ¥6,192,089 | 210.8% | 290.0% | 344.0% |
| Kanazawa Station-front | ¥194,230 | ¥355,047 | ¥1,073,032 | 124.8% | 171.6% | 313.8% |
| Fukuoka Hakata Station-front | ¥894,387 | ¥1,055,204 | ¥4,384,958 | 87.0% | 119.7% | 141.2% |
| Osaka Namba | ¥709,806 | ¥870,623 | ¥4,604,630 | 79.8% | 109.8% | 134.6% |
| Tokyo Shinjuku Station East | ¥1,270,730 | ¥1,431,547 | ¥8,652,907 | 76.5% | 105.3% | 118.6% |
| Hiroshima Kamiyacho | ¥242,955 | ¥403,772 | ¥2,440,579 | 49.0% | 67.4% | 112.0% |
| Sendai Station-front | ¥80,439 | ¥241,256 | ¥1,093,693 | 23.9% | 32.9% | 98.5% |
The picture splits into three groups.
The first group works under either ownership or a leasehold. Kyoto Shijo-Karasuma (freehold coverage 230.4%), Tokyo Asakusa (224.9%), Sapporo Susukino (210.8%) and Kanazawa Station-front (124.8%) all have paying capacity well above the prevailing land price even on a freehold basis. Kyoto and Asakusa combine high estimated settled ADR of ¥15,479 and ¥14,398 with prevailing land prices of ¥1.38 million and ¥1.48 million per ㎡ — below the three central Tokyo wards — giving a good balance between earnings and land price. In these four markets the leasehold is not a necessity but an option for improving capital efficiency.
The second group works only on a leasehold. Fukuoka Hakata Station-front, Osaka Namba and Tokyo Shinjuku Station East have freehold coverage ratios of 87.0%, 79.8% and 76.5% — short of 100%. Switch to a 30-year lease and they flip to 119.7%, 109.8% and 105.3%. Simply lowering the annual cost ratio of land from 6.19% to 4.5% moves projects that did not work onto the feasible side. In these markets, where the land share runs 47–63%, the 1.38x factor bites decisively. Which is also to say that the more a development chases the premium of a station-front location, the more a leasehold structure is worth examining.
The third group flips with the term. Hiroshima Kamiyacho has a coverage ratio of 67.4% on a 30-year lease but reaches 112.0% at 49 years. Sendai Station-front sits almost exactly on the watershed at 32.9% for 30 years and 98.5% for 49. In these two markets, extending the contract term does more than haggling over the rent. The next section confirms why, in numbers.
The Contract Term Is the Watershed — 30 Years vs 49 Years Differs by 18% in Recovery Burden
A building on fixed-term leased land is, as a rule, demolished and the site returned cleared at expiry. The building investment therefore has to be recovered in full over the contract term. At a 5% discount rate, the amount required each year for that recovery is 6.51% of the building investment over 30 years, 5.83% over 40 years and 5.50% over 49 years. A 30-year contract imposes a burden 1.00 percentage point — 18% in relative terms — heavier on the building than a 49-year contract.
Applied to a building investment of ¥16.06 million per room, that 1.00 point is ¥161,000 a year. Capitalised at a 4.5% ground rent ratio it is equivalent to ¥3.58 million per room of land-paying capacity. Extending the contract term from 30 to 49 years alone puts land that much more expensive within reach.
As the shape of the chart shows, the capital recovery factor curve rises steeply once the term falls below about 20 years. At a 5% discount rate, a 20-year contract requires 8.02% a year and a 10-year contract 12.95%. That single point explains why the 20-year ceiling on an installation and management permit, and the 10-year floor of a short business-use fixed-term leasehold, are heavy constraints for a capital-intensive use such as a hotel.
Conversely, beyond 40 years the curve all but flattens: the difference between 40 and 49 years is just 0.32 points. The value worth chasing in a term negotiation is concentrated in the 20-to-40-year band. Wanting 50 years or more switches the regime to a general fixed-term leasehold (Art. 22), which means redesigning the contract itself.
It is also worth looking at sensitivity to the construction cost assumption. For Sendai Station-front, which sits on the watershed, varying construction cost across ¥1.5 million, ¥1.8 million and ¥2.1 million per tsubo and the contract term across 30, 40 and 49 years gives the following.
| Construction cost assumption | 30-yr lease | 40-yr lease | 49-yr lease |
|---|---|---|---|
| ¥1.5M per tsubo Building investment ¥13,381,200 /room | Coverage 111.7% Supportable ground rent ¥273,330 /room/yr | Coverage 148.7% Supportable ground rent ¥363,994 /room/yr | Coverage 166.4% Supportable ground rent ¥407,344 /room/yr |
| ¥1.8M per tsubo (base case) Building investment ¥16,057,440 /room | Coverage 32.9% Supportable ground rent ¥80,439 /room/yr | Coverage 77.3% Supportable ground rent ¥189,236 /room/yr | Coverage 98.5% Supportable ground rent ¥241,256 /room/yr |
| ¥2.1M per tsubo Building investment ¥18,733,680 /room | Coverage -45.9% Supportable ground rent ¥-112,452 /room/yr | Coverage 5.9% Supportable ground rent ¥14,478 /room/yr | Coverage 30.7% Supportable ground rent ¥75,168 /room/yr |
At ¥1.5 million per tsubo the project works even on a 30-year contract; at ¥2.1 million it stalls at a coverage ratio of 30.7% even over 49 years. The higher construction costs go, the longer the term required. While construction costs stay elevated, the term offered by the landowner or municipality directly decides whether the project happens.
Why Public Land Is Different — Backing Out the Assumed Terms for Block 15, Sumiyoshi-cho, Kagoshima
Private landowners and municipalities think about setting ground rent in fundamentally different ways. Private owners derive rent from the expected yield on the land as an asset. Municipalities are trying to satisfy policy objectives — putting idle land to use, creating jobs, generating footfall — alongside securing non-tax revenue. The resulting ground rent ratio lands at a level different from the private market.
As a live example, Kagoshima Prefecture has announced the selected operator for its prefecture-owned “Block 15, Sumiyoshi-cho” site. According to the reported project terms, 21,549㎡ — most of the block — will be leased under a fixed-term leasehold at an assumed ground rent of ¥256 per ㎡ per month, with a project period of 55 years including construction and removal. The original schedule was a July 2028 start with operations opening in April 2031, but the operator asked the prefecture in November 2025 to push this back by about a year; the current assumption is 55 years from August 2029 to July 2084, with operations opening in April 2032. The plan is for a nine-storey, 281-room property with banquet facilities including a grand banquet hall seating up to 2,000.
| Item | Terms | Derived |
|---|---|---|
| Leased area | 21,549㎡ | — |
| Assumed ground rent | ¥256/㎡ per month | ¥3,072/㎡ per year |
| Total annual ground rent | ¥66,198,528 | Divided across 281 rooms: ¥235,582 per room/yr |
| Project period | 55 years (originally from July 2028; expected to shift to August 2029) | 50 years or more places it in general fixed-term leasehold territory |
| Surrounding commercial land price (Official Land Prices 2025) | Median ¥362,500/㎡ Within a 900m radius, N=6 points | Annual ground rent to land price: approx. 0.85% 0.5–1.4% against individual nearest points |
Viewed as a ratio of annual ground rent to land value, the figure is roughly 0.85% against the median official land price for surrounding commercial land, and stays within a 0.5–1.4% range even when compared against individual nearest points. Against the 4–5% a year used as a benchmark in private business-use fixed-term leaseholds, that is an order of magnitude lower. It is not a strict comparison, given reclaimed port land with no official land price point inside the block, but even discounting for that the difference in level is clear.
The effect on feasibility is large. In the Sendai Station-front calculation above, the supportable ground rent on a 49-year lease was ¥241,000 per room per year. The rent backed out of the Kagoshima project is ¥235,600 per room per year — almost exactly the same level. One reading is that the lease terms for public land happen to line up with what regional-city lodging demand can actually carry. On top of that, the 55-year project period puts the building recovery burden into the region where the capital recovery factor curve has flattened out. On both term and ground rent ratio, the structure makes it easier for the development side to underwrite the investment.
The implication for municipal and public-private partnership teams is clear. Rather than stacking up the absolute amount of rent, designing a longer term does more to raise the odds of attracting an operator. In capital recovery factor terms a term beyond 40 years works in the same direction as cutting the rent — without reducing the municipality’s income. Offer a short term of around 20 years, by contrast, and no amount of rent reduction will easily make a capital-intensive use work.
Where the Nine Markets and the Public-Land Case Sit
On the map, the markets clearing 100% coverage are not simply ordered from cheapest land upwards. Shinjuku Station East carries the heaviest land value per room of the nine at ¥26.82 million, yet earning power — an estimated settled ADR of ¥16,131 and occupancy of 81.5% (calendar year average January–December 2025; Japan Tourism Agency Overnight Travel Statistics Survey, business hotels in Tokyo) — absorbs the ground rent and takes coverage to 118.6% on a 49-year lease. Sendai Station-front, by contrast, carries a light ¥5.44 million of land value per room but only just reaches 98.5% on a 49-year contract on RevPAR of ¥6,702. It is not the level of land prices but the ratio of land price to RevPAR that decides feasibility.
Financing, Accounting and Restoration — Four Issues That Never Appear in the P&L
The back-calculation so far is about economics and yields, but the leasehold route carries several issues outside the P&L that shape the deal. Here are the four points invariably raised in regional and shinkin bank credit assessments and in fund acquisition reviews.
| Issue | Substance | Design points |
|---|---|---|
| Security | A mortgage can be created over both the fixed-term leasehold and the building. In practice, however, the leasehold’s perfection against third parties rests mainly on registration of the building on the land, so the treatment if the building is destroyed must be dealt with in the contract. | Build in the landowner’s consent letter, a provision requiring notice to the lender on rent arrears, and a lender’s-remedy clause allowing payment on the tenant’s behalf before termination. Loan tenors are typically set a few years shorter than the contract term. |
| Depreciation | A building is in principle depreciated over its statutory useful life, but where the contract term is shorter than that life, the undepreciated balance is written off in one go as a disposal loss at expiry. The statutory useful life of reinforced concrete for accommodation use runs to several decades, so a 30-year contract easily creates a mismatch. | Design the contract term together with the building’s structure and specification. On short-term deals, moving the structure and equipment specification towards the term is worth considering. |
| Restoration | A fixed-term leasehold means returning cleared land as a rule, so demolition costs fall on the operator at expiry. Demolition costs have been rising alongside construction costs and are too large to ignore as a one-off outlay at the end of the period. | Build the economics assuming the demolition cost equivalent is reserved over the period. The longer the term, the lighter the annual reserve. Clarify the treatment of buried objects and soil in the contract. |
| Deposits | Business-use fixed-term leaseholds commonly involve an interest-free deposit of several months’ to around 24 months’ ground rent. It is returned at the end of the period, but ties up working capital throughout. | Include the deposit in the funding plan as part of the initial investment. Negotiate it together with the rent revision clause (fixed period and revision index). |
What bites hardest in practice is the interaction between security and term. Lenders customarily set a loan tenor shorter than the contract term, so a 30-year contract often comes with a loan of around 25 years. The capital recovery factor above is calculated on the term itself; where the loan tenor is shorter than the term, principal amortises faster still and cash flow during the period tightens further. Negotiating a longer contract term is simultaneously a rent negotiation and a financing-terms negotiation.
Practical Implications — Checkpoints by Role
Development Site acquisition teams
Judge a candidate site not by “can we buy it?” but by “how much ground rent can this format pay?” Set the supportable ground rent per room from RevPAR and the floor area ratio first, then test it against the landowner’s asking rent. In markets where the land share exceeds 45% — Shinjuku, Hakata and Namba here — there is real value in re-running deals rejected on a freehold basis against leasehold assumptions.
Credit assessment Regional and shinkin banks
Check that contract term, loan tenor and statutory useful life line up. A deal structured in reinforced concrete against a 30-year contract term brings the disposal loss and the demolition cost due at the same moment. The index used in the rent revision clause (fixed, land-price-linked or inflation-linked) also materially changes the dispersion of future cash flows — another fork in the credit decision.
Public-private partnership Municipalities and inward investment teams
The design of the term matters more than the level of the rent in attracting operators. The capital recovery factor changes sharply across the 20-to-40-year band and flattens beyond 40 years. Extending the term is the only lever that lightens the operator’s recovery burden without reducing municipal income. Decide up front how this is used relative to Park-PFI’s 20-year ceiling.
Negotiating range on the ground rent ratio
The 6.19% annual land holding cost ratio under ownership is the ceiling for a leasehold to stay advantageous. Above that, leasehold leverage goes into reverse. The 4–5% private market range leaves only 1.2–1.7 points of headroom against that ceiling.
Negotiating range on the term
Going from 30 to 49 years lightens the annual building recovery burden by 1.00 point, equivalent to ¥3.58 million per room of land-paying capacity. Note that wanting 50 years or more switches the regime to a general fixed-term leasehold (Art. 22).
Building in construction costs
Accommodation-use buildings ran ¥1.954M per tsubo in 2024, +76% versus 2017. The higher construction costs go, the longer the term required. At ¥2.1M per tsubo, a market of Sendai’s calibre stalls at 30.7% coverage even on a 49-year contract.
Calculation Assumptions
| Item | Assumption | Basis |
|---|---|---|
| Format assumed | Limited-service hotel | 18㎡ guest rooms, 72% guest-room ratio, 25.0㎡ (7.56 tsubo) gross floor area per room |
| Construction cost | ¥1.8M per tsubo (sensitivity: ¥1.5M / ¥2.1M) | Set for a specification-tightened limited-service format, taking the ¥1.954M per tsubo for accommodation-use buildings in 2024 (MLIT Building Construction Starts Statistics) as an upper reference point |
| Soft costs | 18% of construction cost | Design supervision, FF&E and pre-opening costs. Building investment is ¥16,057,440 per room |
| FAR utilisation rate | 85% | Allows for inefficiency from setback rules, shadow regulations and site shape |
| ADR | Estimated settled ADR at ward/city level, trailing 12-month average | MetroEngines Research & Consulting. Thin sample months (property count below 60% of the period median) are excluded |
| OCC | Business hotels by prefecture, calendar 2025 average | Japan Tourism Agency Overnight Travel Statistics Survey. Calendar 2025 is used because the stratification basis changed from employee count to room count from the January 2026 survey, so 2025 is the consistent basis |
| Other revenue | 10% added to room revenue | Breakfast, vending and similar |
| GOP margin | 50% of revenue | A benchmark for limited-service hotels. Note this is above the portfolio results of listed REITs, which include full-service properties |
| Building property tax | 0.7% of building investment per year | Approximation of the average over the period |
| Capital expenditure reserve | 4% of revenue | FF&E replacement and similar |
| Discount rate | 5% (sensitivity: 4% / 6%) | Used to calculate the capital recovery factor |
| Ground rent ratio | 4.5% of land value per year | The midpoint of typical ground rent levels for business-use fixed-term leaseholds (4–5% per year) |
| Land holding cost ratio (freehold) | 6.19% per year | 5% cost of capital + an effective 1.19% for property taxes (assessed value at 70% of official land price, tax rate 1.7%) |
| Prevailing land price | Median of official land prices for commercial land within an 800m radius of each market’s centre point (2025) | MLIT Real Estate Information Library. 101 points across nine markets |
Frequently Asked Questions
| Can a hotel use a business-use fixed-term leasehold? | Yes. A business-use fixed-term leasehold is a leasehold for the purpose of owning a building used for business, with residential buildings excluded. Hotels and ryokan are facilities for lodging rather than residential buildings, so they are treated as eligible. Article 23(3) of the Act on Land and Building Leases requires the contract to be executed by notarial deed. |
| How long can the contract term be? | From 10 years to under 50 years. Terms of 30 to under 50 years fall under Article 23(1) of the Act on Land and Building Leases, and 10 to under 30 years under Article 23(2). To set 50 years or more, a general fixed-term leasehold (Article 22) is used instead, and the form of contract changes from a mandatory notarial deed to a written agreement. |
| What is the going rate for ground rent? | Business-use fixed-term leaseholds are commonly benchmarked at roughly 4–5% of land value per year, and this article uses the 4.5% midpoint. That applies to private landowners; leases of public land add policy objectives and land at a different level. In the Kagoshima prefecture-owned case, backing out the reported assumed terms gives about 0.85% against the median official land price of surrounding commercial land. |
| Which is better, Park-PFI or a fixed-term leasehold? | It depends on the use and the term. A Park-PFI installation and management permit runs to a maximum of 20 years with a special provision allowing a building coverage ratio of up to 12%, but no leasehold right arises, so security over the right is not contemplated. For a capital-intensive use with a long recovery period, such as a hotel, a 20-year term pushes the capital recovery factor up sharply. In many situations a fixed-term leasehold, where a longer term can be secured, is easier to build a feasible case around. |
| Is a leasehold always better than ownership? | Not necessarily. Once the ground rent ratio exceeds the land holding cost ratio under ownership (6.19% a year on the assumptions here), the leasehold route yields less than ownership — and the higher the land share, the larger that reversal. In addition, the building’s asset value falls to zero at expiry and demolition costs arise, so on an evaluation that includes the exit, the ranking against ownership can flip. |
On the use of these estimates: the supportable ground rent, affordable land price and coverage ratios in this article are the output of a simplified model combining published official land prices, lodging statistics and construction statistics with ADR estimated from published prices. In an actual deal the figures move substantially with site shape, statutory restrictions, soil, buried objects and operating terms. Estimated settled ADR is an estimate carrying a median error of about 7% against property-level disclosures by listed hotel REITs, not the actual result of any individual property.
Further Reading
- Frozen Pipeline & the Supply Gap: Cancelled Hotel Projects and Investor Implications
- Hotel Supply Pressure Ranking 2026-2027: Ozu Kumamoto Tops at 30.8%
- Station Premium Ends at an 8-Minute Walk: 8 Stations, 1,012 Hotels
- Own a Hotel from ¥100,000 — Security Tokens Open a Third Funding Route
- Policy Rate 1.00%: Break-Even ADR Across Japan’s 8 Hotel Markets
- Hotel vs Condo Land Rivalry: ADR-Implied Feasible Land Price Map
- Hotel Development Capacity 2026: Zoning, FAR & Land Price in 5 Markets
References and Sources
Data sources
On the revenue side, estimated settled ADR at ward/city level (12-month average, September 2025 to August 2026; monthly median property count N=61–192 properties) and room occupancy for business hotels by prefecture from the Japan Tourism Agency Overnight Travel Statistics Survey (calendar 2025 average). On the cost side, commercial land from MLIT Real Estate Information Library “Official Land Prices” 2025 (within an 800m radius of each market’s centre point; 101 points across nine markets plus 6 points in Kagoshima) and planned construction cost for accommodation-use buildings from the same ministry’s Building Construction Starts Statistics. Property-level acquisition prices disclosed by six listed hotel REITs (30 rooms or more, N=282 properties) were used as a cross-check.
Calculation assumptions
Assuming a limited-service hotel (25.0㎡ gross floor area per room, 85% FAR utilisation), the residual after deducting the building recovery amount, building property tax and the capital expenditure reserve from GOP is taken as the ceiling payable for land. Construction cost is ¥1.8M per tsubo (sensitivity ¥1.5M / ¥2.1M), the discount rate 5% (sensitivity 4% / 6%), the GOP margin 50%, the ground rent ratio 4.5% of land value per year, and the land holding cost ratio under ownership 6.19% a year (5% cost of capital + an effective 1.19% in property taxes). Individual assumptions and their basis are listed in the “Calculation Assumptions” section above.
Limitations
This article is a simplified model based on public data and does not carry the precision required for an investment decision. (1) ADR is estimated from published prices, with a median error of about 7% against property-level disclosures by listed REITs. (2) Occupancy is a statistic at prefecture and format level and diverges from individual markets and individual properties. (3) The prevailing land price is the median of official land prices within an 800m radius, not a valuation of the subject site itself. The Kagoshima site is reclaimed land with no official land price point inside the block, so the comparison is limited to surrounding commercial land. (4) Variation from site shape, statutory restrictions, soil, buried objects and operating terms, and demolition costs at expiry, are not built in.
Market data
- MetroEngines Research & Consulting — estimated settled ADR (ward/city level, trailing 12 months; monthly median property count N=61–192 properties); listed hotel REIT ownership master (property-level acquisition prices, N=282 properties of 30 rooms or more)
Government statistics and public data
- MLIT Real Estate Information Library — Official Land Prices (2025, commercial land; 101 points across nine markets plus 6 points in Kagoshima)
- MLIT Building Construction Starts Statistics — number of buildings, floor area and planned construction cost by use and by developer type (e-Stat table ID 0003114490)
- Japan Tourism Agency Overnight Travel Statistics Survey — room occupancy by prefecture and accommodation type, time series
- MLIT “Park-PFI Utilisation Guidelines for Improving the Quality of Urban Parks” (as amended 30 May 2025)
- Ministry of Finance, “On Leases Established as Fixed-Term Leaseholds”
Legal and practical commentary
- What is a business-use fixed-term leasehold? Differences from ordinary leaseholds, terms, and the rules of the Act on Land and Building Leases (KEIYAKU-WATCH, in Japanese)
- Business-use fixed-term leaseholds — contract terms, going ground rent rates and inheritance tax valuation (Iekon, in Japanese)
- Key points of the Urban Park Act amendment, centred on Park-PFI (Nikkei BP PPP, in Japanese)
News