

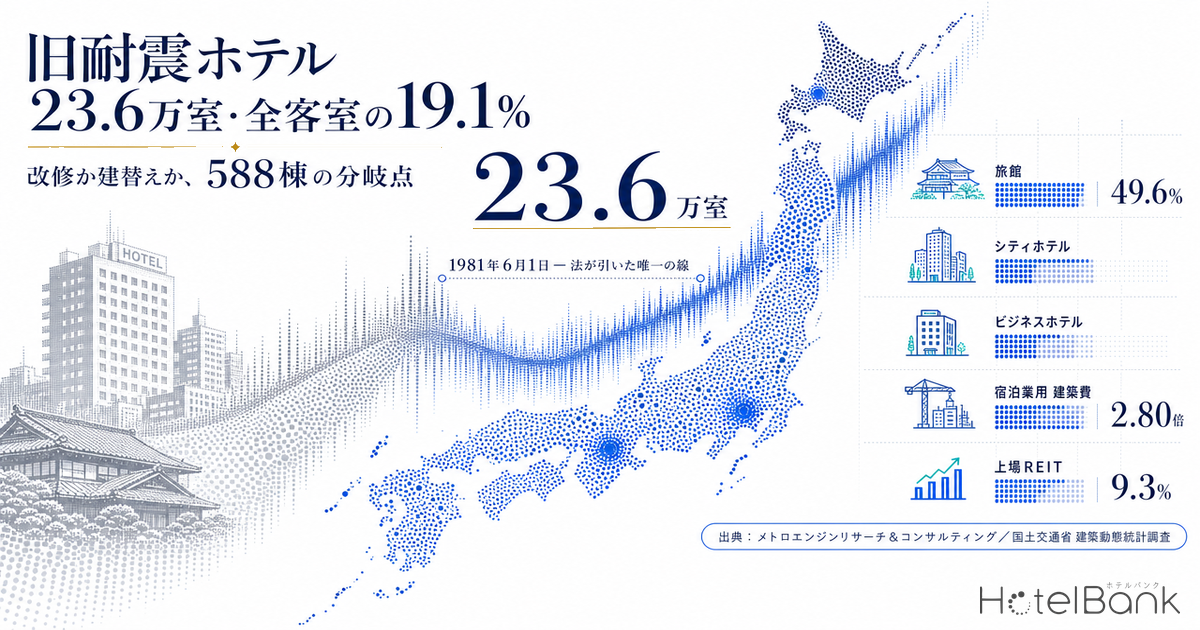
Articles that slice Japan’s hotel and ryokan stock by “what year did it open” are nothing new on this site. But 1996, 2015, ten years since opening — every one of those cut-off points was chosen by the analyst (our analysis measuring the right timing for renovation using the ten-year mark is collected in Hotels at Year 10). This article leaves that behind and fixes the line at a single date: 1 June 1981. That is the day the new seismic design standard took effect under the amended Enforcement Order of the Building Standards Act — the one boundary between buildings in Japanese real estate that was drawn by law rather than by an analyst.
The practical meaning of drawing this line is clear. Among buildings for which construction started on or before 31 May 1981, hotels and ryokan with three or more storeys and a total floor area of 5,000 m² or more were designated “large-scale buildings requiring urgent safety confirmation” under the 2013 amendment to the Act on Promotion of Seismic Retrofitting of Buildings, and their owners were obliged to carry out a seismic diagnosis and report the result to the competent administrative agency. The reporting deadline was the end of December 2015, and the results are published by local governments. In other words, this layer is not just one band in a vintage table — it is stock to which the legal system has given a name and a procedure. This article shows, in numbers, how much of it exists nationwide, where it clusters, what rates it earns, and which of the three paths — retrofit, rebuild, or conversion — it is heading toward.
Metric Definitions Used in This Article
- ADR (average daily rate): an estimated settled rate (tax-excluded equivalent) calculated by applying category-specific adjustment coefficients to the lowest published plan level at each property (double occupancy, per-room rate, tax-included). Cross-checked against per-property results disclosed by listed hotel REITs, the median error is 6.6% (ensemble estimate across both OTAs). These are estimates and differ from each property’s actual transacted prices and accounting figures. Area- and segment-level ADR is the median of the properties covered (the level of a typical property).
- Pre-1981 opening: properties whose opening year and month fall on or before 31 May 1981. This is a screening indicator based on the opening year, not the building’s completion year, so properties that were rebuilt or fully reconstructed after opening are also included. Conversely, properties housed in pre-1981 buildings but converted to hotel use in recent years are counted on the post-1981 side. It does not indicate actual seismic performance (see “What this indicator can and cannot tell you” below).
- OCC (occupancy rate): sold rooms as a share of total rooms in the area (an estimate based on OTA sales inventory). Note that the OCC figures used in this article’s investment calculations (75% / 78%) are assumed values for the model, not measured results.
- Population covered: of roughly 168,000 domestic properties tracked by MetroEngines Research, the 27,249 properties / 1,266,977 rooms for which operation can be confirmed. Of these, the 24,720 properties / 1,233,409 rooms with a known opening year and month were used for analysis.
- Data sources: MetroEngines Research & Consulting (opening-year basis) / Ministry of Land, Infrastructure, Transport and Tourism, “Statistical Survey on Building Construction”
- — 236k rooms, 19.1% — of the 1,233,409 rooms with confirmed operation and a known opening date, 235,730 opened before June 1981. Roughly one room in five dates from the pre-1981 period.
- — Half is concentrated in 588 buildings — there are only 588 pre-1981 properties with 100 or more rooms, but they contain 119,467 rooms (50.7% of all pre-1981 rooms). Decision-making converges on this population.
- — The vintage gap in rates reverses by category — median estimated settled ADR is −22.4% for city hotels (pre-1981 ¥11,700 / post-1981 ¥15,100), but ryokan are +8.1% and resorts +7.3%, with the pre-1981 side commanding more.
- — Rebuild cost is up 2.80x in 13 years — construction-start cost for lodging use rose from ¥699k per tsubo in 2011 to ¥1,955k per tsubo in 2024. Incremental revenue in the same use would take 43 years to pay back, moving the case for rebuilding from the building to the land.
- — The middle path is “retrofit plus guest-room renovation” — seismic reinforcement that cannot pay for itself alone pays back in 19.2 years at ¥9.0M per room when bundled with a guest-room renovation. A 10% shortfall in ADR stretches that to 39.0 years, so the outcome hinges on post-renovation rate strategy.
1 June 1981 — not an arbitrary year, but the one line drawn by law
The new seismic standard applies to buildings that received building confirmation on or after 1 June 1981. Buildings predating it are called “pre-1981” (kyu-taishin) and were designed only for shaking up to roughly JMA seismic intensity 5-upper. This boundary is more than a footnote in technical history because the amended Act on Promotion of Seismic Retrofitting of Buildings, in force from November 2013, made seismic diagnosis and reporting mandatory for large pre-1981 buildings.
The buildings covered are “large-scale buildings requiring urgent safety confirmation.” For uses serving the general public — hospitals, stores, and hotels and ryokan — the threshold is three or more storeys and a total floor area of 5,000 m² or more. Owners were required to complete a seismic diagnosis by the end of December 2015 and report it to the competent administrative agency, and the reported results are published on local-government websites. That lodging facilities are named in law alongside schools and hospitals as buildings warranting special care for evacuation and safety is precisely why this line belongs at the centre of an investment judgement.
There is a second practical implication. The three-storey, 5,000 m² threshold corresponds, in hotel terms, to roughly 100 rooms and above. Small ryokan and pensions sit outside the diagnosis obligation; only large properties sit inside the law. Even within the same “pre-1981” label, the regulatory environment differs completely by size band. We return to this point repeatedly below.
What this indicator can and cannot tell you. The tabulations in this article are based on the opening year and month — not the building-confirmation year, and not the completion year. It follows that (1) properties rebuilt or fully reconstructed after opening remain on the pre-1981 side, and (2) properties in pre-1981 buildings converted to hotel use in recent years fall on the post-1981 side. Because the error runs in both directions, this cannot be used to assert that any individual building “is pre-1981.” What it can be used for is sizing the market as a whole and primary screening ahead of individual due diligence. Confirming the status of a specific building requires obtaining a certificate of entry in the building-confirmation register, the confirmation certificate, and the inspection certificate.
236k rooms, 19.1% nationwide — concentrated in ryokan and city hotels
Dividing the 24,720 properties / 1,233,409 rooms with confirmed operation and a known opening date at 1 June 1981 gives 4,744 properties and 235,730 rooms on the pre-1981 side. On a room basis that is 19.1%, roughly one room in five. The breakdown skews older still: 2,785 properties / 109,988 rooms opened in or before 1971, and 1,959 properties / 125,742 rooms between 1971 and May 1981. About 47% of the pre-1981 layer opened in the earlier half of that period — before the 1971 tightening of hoop-reinforcement rules.
This 19.1% looks completely different depending on the category.
Ryokan stand at 49.6% — 86,465 of 174,209 rooms opened in the pre-1981 period, across 2,796 properties. Roughly half of Japan’s ryokan, in other words, were born before the new seismic standard. Business hotels, by contrast, sit at just 9.7% (61,390 of 634,220 rooms). The business-hotel category itself was supplied in volume only from the 1980s onward, so the gap reflects when each category came into being rather than the quality of the buildings.
The most important case for investment purposes lies between the two: city hotels. 47,947 of 176,145 rooms, or 27.2%, opened in the pre-1981 period, across 305 properties. At an average of 157 rooms each they are large, and many meet the three-storey, 5,000 m² diagnosis threshold. Resort hotels are at 22.5% (218 properties / 21,009 rooms) and deluxe hotels at 23.6% (22 properties / 6,875 rooms) — both categories of large buildings on fixed sites.
Cut by size band, the pre-1981 share traces a U. It peaks at 26.8% in the 20-49 room band, falls to 15.6% at 100-149 rooms and 13.2% at 150-299, then rebounds to 21.0% at 300 rooms and above. The middle is low because limited-service properties of 100-300 rooms were supplied in volume from the 1990s through the 2010s; both ends are high because two blocks supplied at different times — “small long-established ryokan” and “large buildings put up during the high-growth era” — are still standing.
And the reality as an investment target comes down to a single sentence. There are only 588 pre-1981 properties with 100 or more rooms, but they hold 119,467 rooms — exactly half (50.7%) of the 236k pre-1981 rooms. The other half is spread thinly across 4,156 small properties. The decisions that move the market as a whole come down almost entirely to how these 588 buildings are handled.
A gap of more than 2x between prefectures — Tottori 39.5%, Saitama 7.6%
Regional differences are differences in category mix. The highest pre-1981 share is Tottori at 39.5%, followed by Yamagata at 33.2%, Gunma 31.4%, Nagano 27.9% and Niigata 27.4% — all clusters of onsen ryokan, where the 49.6% pre-1981 share among ryokan pushes the prefecture figure up directly. At the low end are Saitama 7.6%, Okinawa 11.6%, Osaka 11.9% and Ibaraki 11.9%. Okinawa’s resort supply was concentrated from the 2000s onward, and Osaka’s denominator swelled during the limited-service boom of the 2010s.
| Prefecture | Pre-1981 properties | Pre-1981 rooms | Rooms with known opening year | Pre-1981 share | Of which 100+ rooms (buildings / rooms) |
|---|---|---|---|---|---|
| Tokyo | 176 | 24,060 | 155,728 | 15.5% | 67 / 19,920 |
| Hokkaido | 276 | 20,567 | 82,253 | 25.0% | 65 / 13,333 |
| Nagano | 384 | 12,154 | 43,631 | 27.9% | 18 / 2,784 |
| Osaka | 84 | 10,770 | 90,763 | 11.9% | 31 / 8,960 |
| Shizuoka | 268 | 10,409 | 43,882 | 23.7% | 29 / 4,313 |
| Hyogo | 189 | 7,870 | 35,189 | 22.4% | 20 / 3,793 |
| Kyoto | 200 | 7,700 | 42,434 | 18.1% | 20 / 4,795 |
| Fukuoka | 81 | 7,517 | 49,125 | 15.3% | 25 / 5,694 |
| Aichi | 104 | 7,362 | 49,090 | 15.0% | 22 / 4,747 |
| Niigata | 169 | 7,322 | 26,681 | 27.4% | 11 / 2,819 |
| Kanagawa | 188 | 6,651 | 42,346 | 15.7% | 16 / 2,957 |
| Gunma | 164 | 6,187 | 19,693 | 31.4% | 14 / 2,000 |
| Fukushima | 140 | 5,436 | 24,059 | 22.6% | 12 / 1,653 |
| Chiba | 105 | 5,148 | 41,416 | 12.4% | 10 / 2,943 |
| Tochigi | 106 | 4,899 | 19,731 | 24.8% | 14 / 2,385 |
Share and absolute volume are, however, different things. The largest pre-1981 room count itself is Tokyo’s 24,060 rooms (a 15.5% share), followed by Hokkaido at 20,567, Nagano at 12,154 and Osaka at 10,770. Tottori, top by share, has just 2,911 rooms. In terms of the volume of floor space that can actually change hands, absolute quantity is what to look at, not share.
Where the 588 buildings of 100+ rooms cluster
Narrowing to the 100-plus rooms that broadly correspond to the diagnosis threshold sharpens the concentration further. The map covers clusters of three or more properties, with circle size representing the number of rooms in pre-1981 properties of 100 rooms or more.
At the top are Minato-ku, Tokyo (16 properties / 4,716 rooms), Kita-ku, Osaka (10 / 4,594), Chuo-ku, Sapporo (17 / 4,488), Shinjuku-ku (10 / 4,382) and Chiyoda-ku (15 / 4,059). Large pre-1981 stock remains thick in the central business districts of the three major metropolitan areas and in the city centres of regional hub cities such as Sapporo, Fukuoka, Nagoya and Sendai. The places where urban functions concentrated in the 1970s were also the best hotel locations of that era, and those assets are still in operation today.
Elsewhere there are clusters in places with strong tourism or transport significance but land values far removed from the major city centres — Narita (4 properties / 1,867 rooms), Nikko (10 / 1,558), Beppu (3 / 1,244), Noboribetsu (4 / 1,082) and Hakodate (7 / 1,356). For these two groups, the answer to the decision discussed below comes out in opposite directions.
Rate is not set by building age — city hotels −22.4%, ryokan +8.1%
The premise that “old buildings can only sell cheap” does not hold once categories are separated. Comparing the median estimated settled ADR over the most recent 12 months (August 2025 to July 2026) for properties of 100 rooms or more, pre-1981 against post-1981, the direction splits by category.
The largest gap is in city hotels, where the pre-1981 median of ¥11,700 compares with ¥15,100 for post-1981 — a spread of −22.4%. Narrowing to large buildings of 300 rooms or more, however, the city-hotel median is ¥19,000 pre-1981 against ¥21,000 post-1981 (N=34 / 92), and the gap narrows to −9.3%. Among large urban full-service properties, the pre-1981 assets tend to hold prime central sites, and the vintage handicap is offset to a degree by the advantage of location. Fixtures and specifications, room size, bathroom configuration, circulation in the public areas — it is in this category that 1970s design thinking sits least comfortably with what today’s guests expect.
Business hotels come in at ¥7,900 pre-1981 against ¥8,200 post-1981, a difference of −3.1% and effectively nil. This is a category where price is set by standardised room specifications and location advantage, so building vintage has little effect on rate.
And the direction reverses for resort hotels and ryokan. Resort hotels run ¥16,700 pre-1981 against ¥15,500 post-1981, or +7.3%, and ryokan ¥18,500 against ¥17,100, or +8.1% — the pre-1981 properties achieve the higher rate. Being long-established, having secured irreplaceable locational resources such as a hot-spring source or a view, and the building itself carrying product value — these outweigh the vintage handicap. The post-1981 ryokan sample is small at N=18 and should be read with a margin, but at the very least the generalisation “pre-1981 means you cannot command a rate” does not apply to ryokan and resorts.
This is where the decision forks. In a category where rate is explained by vintage (city hotels), replacing the building has meaning for earnings. In a category where rate is not explained by vintage (ryokan, resorts), replacing the building will not lift the rate, and what is lost in the replacement — history, the memory of existing guests, the design — weighs more. Within the same “pre-1981” label, the direction to take is the opposite.
Rebuilding has receded by a factor of 2.8 in 13 years
So how realistic is rebuilding? Taking lodging-use buildings from the Ministry of Land, Infrastructure, Transport and Tourism’s “Statistical Survey on Building Construction” and dividing the estimated construction cost by floor area gives a unit cost per square metre of floor.
From ¥699k per tsubo in 2011 to ¥1,955k per tsubo in 2024 — a factor of 2.80 over 13 years. Even looking only at the most recent period, 2024 jumped 42.0% from ¥1,377k in 2023. 2024 was a year in which floor area of construction starts swelled to 1.756M m², 1.9 times the prior year, and large high-rise projects in central urban areas raised the mix; but the underlying upward trend in material prices and labour rates has been consistent since 2021.
This figure carries two meanings for how pre-1981 stock should be handled. First, the economic hurdle for rebuilding has risen: rebuilding the same floor area now costs more than twice what it did a decade ago. Second, and paradoxically, the relative value of existing stock has risen: if new supply is held back, the scarcity of rooms already in operation increases. How far this level of construction cost will hold down new supply from 2027 onward is a separate question, and one that turns on how many planned projects survive re-pricing at these levels.
Building in inflation over the construction period
Applying the 2024 result directly to a future rebuild cost cannot be called conservative. Taking the construction consultancy Turner & Townsend’s forecast for construction cost inflation in the Japanese market (+5.6% in 2025, +5.3% in 2026, +5.0% in 2027) and, in light of the same firm’s view that the pace of increase moderates gradually from 2027 onward, extending it at +4.5% from 2028 as this article’s assumption, a project starting construction in 2027 with a 30-42 month build period would reach the midpoint of its expenditure around 2029, giving a coefficient of roughly 1.28 against 2024. That puts the unit cost at approximately ¥2,490k per tsubo. The calculations below present both stages side by side (the 2024 actual basis and the inflation-adjusted basis).
Retrofit, rebuild, or convert — modelling the three options facing 588 buildings
The figures so far can be brought into a single decision model. The subject is a 150-room, pre-1981 city hotel in the centre of a regional hub city, with 6,750 m² of gross floor area (45 m² per room including public areas). It meets the three-storey, 5,000 m² threshold and is a typical profile for the seismic diagnosis obligation. The land is assumed to be already owned, and land cost is excluded from the investment amount.
■ Assumptions
- Construction unit cost: ¥591,280 per m² (¥1,955k per tsubo), the 2024 actual for lodging-use construction starts. The inflation-adjusted case applies a coefficient of 1.275 for a 2029 expenditure midpoint, giving ¥753,889 per m² (¥2,492k per tsubo)
- Demolition cost: ¥40,000 per m² (rising at the same rate in the inflation-adjusted case)
- Seismic reinforcement: ¥100,000 per m² for added shear walls in RC construction (adding RC seismic walls is generally cited at ¥100,000-300,000 per m² and column reinforcement at ¥50,000-150,000 per m²; the lower end is adopted on the assumption of a mix of methods)
- Guest-room renovation: ¥4.5M per room
- ADR: the category medians calculated in this article (pre-1981 city ¥11,700 / post-1981 city ¥15,100). The renovation case assumes recovery of about 70% of the difference, at ¥14,000
- OCC: 75% currently, 78% after renovation or rebuild
- Rooms-department profit contribution: 60% of revenue
- This is a simplified calculation; an actual investment decision requires a detailed feasibility study
| Item | A. Retrofit only | B. Retrofit plus full guest-room renovation middle path | C. Rebuild |
|---|---|---|---|
| Investment (total) | ¥680M | ¥1.35bn | ¥4.26bn |
| Investment (per room) | ¥4.5M | ¥9.0M | ¥28.41M |
| Same, inflation-adjusted | ¥5.74M | ¥11.48M | ¥36.22M |
| Assumed construction period | 6-12 months (partial operation possible) | 12-18 months (can be split floor by floor) | 30-42 months (full closure) |
| Assumed ADR | ¥11,700 | ¥14,000 | ¥15,100 |
| Assumed OCC | 75% | 78% | 78% |
| RevPAR | ¥8,775 | ¥10,920 | ¥11,778 |
| Annual rooms revenue (per room) | ¥3.20M | ¥3.99M | ¥4.30M |
| Incremental rooms revenue (per room) | — | +¥780k | +¥1.10M |
| Incremental rooms GOP (per room) | — | +¥470k | +¥660k |
| Simple payback on an incremental basis | not recovered through earnings | 19.2 years | 43.2 years |
| Same, inflation-adjusted | — | 24.4 years | 55.1 years |
The table points to three conclusions.
First, seismic retrofitting on its own generates no earnings. Against an outlay of ¥4.5M per room, neither ADR nor OCC moves. This is not an investment but a cost of staying in business. That is exactly why the decision stalls when the spending stands alone, and why so many properties have deferred it. Put the other way round, seismic retrofitting should always be executed bundled with work that does generate earnings.
Second, the economics stand up the moment it is bundled. In option B, which layers a full guest-room renovation onto the seismic reinforcement, the additional ¥4.5M per room of renovation investment generates ¥470k a year in incremental GOP and pays back the full ¥9.0M — seismic reinforcement included — in 19.2 years. The reinforcement cost that could not be recovered on its own becomes viable by riding on the renovation effect. Splitting the programme floor by floor also avoids a full closure. For the large majority of the 588 buildings, this is the realistic middle path. Where exactly renovation investment overtakes new construction on economics depends on the site’s land value and on how much of the rate gap can be recovered after refurbishment.
Third, rebuilding cannot be justified by incremental earnings in the same use. Against ¥28.41M per room (¥36.22M inflation-adjusted), payback runs to 43-55 years, far beyond the building’s economic life. There are still situations in which a rebuild stands up. But the basis is not “making the hotel new” — it is raising land value by switching the use and the floor-area ratio of the space. Mixed use with offices or housing, taking up unused floor-area allowance, joint redevelopment with adjacent sites: the investment significance of large pre-1981 stock remaining in the middle of commercial districts such as Minato-ku, Kita-ku in Osaka and Chuo-ku in Sapporo lies precisely here. For the same 150 rooms in a large building in a tourist area with low land values, this logic does not work.
Sensitivity analysis
| Case | RevPAR | B. Retrofit + renovation incremental GOP / payback | C. Rebuild incremental GOP / payback |
|---|---|---|---|
| Base case | B ¥10,920 / C ¥11,778 | ¥470k / 19.2 years | ¥660k / 43.2 years |
| ADR −10% | B ¥9,828 / C ¥10,600 | ¥230k / 39.0 years | ¥400k / 71.1 years |
| OCC −5pt | B ¥10,220 / C ¥11,023 | ¥320k / 28.4 years | ¥490k / 57.7 years |
| Construction cost +10% | B ¥10,920 / C ¥11,778 | ¥470k / 21.1 years | ¥660k / 47.5 years |
What stands out in the sensitivity analysis is how fragile case B is to the rate assumption. An ADR just 10% below plan doubles payback from 19.2 years to 39.0. How far the rate can be lifted after renovation all but determines whether this option works. A 10% overrun in construction cost, by contrast, extends payback only to 21.1 years — a limited effect. The risk to manage in B is not construction cost but the pricing strategy after renovation.
Payback on two axes, ADR by OCC (case B)
Widening the sensitivity analysis from one variable to two shows the conditions for case B as a surface. Rows are the assumed post-renovation ADR, columns the assumed post-renovation OCC, and each cell is the simple payback period on an incremental GOP basis against the ¥9.0M per-room investment. Assumptions are identical to “Assumptions” above, with a current ADR of ¥11,700 and OCC of 75% (assumed values anchored on the August 2025 to July 2026 aggregation) and a 60% rooms-department profit contribution; the shaded cell is this article’s base case. The reference current ADR is the median for pre-1981 city hotels from the August 2025 to July 2026 aggregation.
| Post-renovation ADR \ post-renovation OCC (assumed values) | 72% | 75% | 78% | 81% | 84% |
|---|---|---|---|---|---|
| ¥12,600 | 138.4 yrs | 60.9 yrs | 39.0 yrs | 28.7 yrs | 22.7 yrs |
| ¥13,300 | 51.3 yrs | 34.2 yrs | 25.7 yrs | 20.6 yrs | 17.1 yrs |
| ¥14,000 | 31.5 yrs | 23.8 yrs | 19.2 yrs | 16.0 yrs | 13.8 yrs |
| ¥14,700 | 22.7 yrs | 18.3 yrs | 15.3 yrs | 13.1 yrs | 11.5 yrs |
| ¥15,400 | 17.8 yrs | 14.8 yrs | 12.7 yrs | 11.1 yrs | 9.9 yrs |
What this shows is that the scale of rate recovery matters more than OCC. Adding three points of OCC above plan shortens payback only from 19.2 years to 16.0, a gain of 3.2 years, whereas lifting ADR 5% from ¥14,000 to ¥14,700 shortens it to 15.3 years. Conversely, if ADR sinks to ¥12,600 (−10%), payback is 39.0 years even at 78% OCC (an assumed value anchored on the August 2025 to July 2026 aggregation), and at 72% it exceeds 100 years and ceases to work as an investment. The decision in case B turns less on “what the works can be delivered for” than on the confidence around “what the rooms can be sold for afterwards.”
Conversion, the fourth path, is still a narrow channel
A third option is to stop operating as a hotel — converting to housing, senior housing, student dormitories, offices and the like. To size this, our collected building-plan notification data for lodging facilities shows that of the 300 filings recorded between January 2025 and July 2026, 295 (98.3%) were classified as new construction, with just three changes of use and one extension.
The figure shows that development that makes use of existing buildings remains a very narrow channel within the new-supply pipeline. It should be read as an understatement, however. Depending on the area thresholds, a change of use may not require a building-confirmation application, and a considerable number of projects will not appear in the statistics. Furthermore, these statistics capture conversion into lodging use; movement in the opposite direction, out of hotel use into something else, is not recorded in lodging statistics at all.
A Seismic retrofit only
¥4.5M per room / no payback from earnings
As a cost of staying in business it struggles to carry a decision on its own. In practice the key is to design it bundled with work that generates earnings.
B Retrofit plus guest-room renovation
¥9.0M per room / 19.2-year payback
An extra ¥4.5M yields ¥470k a year in incremental GOP. Splitting the programme floor by floor allows it to proceed without closing. The middle path for the majority of the 588 buildings.
C Rebuild or convert
¥28.41M per room / 43 years in the same use
Works only where switching use and floor-area ratio makes floor value jump. Large stock in the centre of commercial districts is the target.
Listed REITs sit at half the market average — a level of 9.3%
How institutional investors treat this layer can be seen in the holdings of listed hotel REITs. Checking opening dates for the 300 properties held by seven investment corporations that could be matched against our property master, 28 properties opened on or before May 1981. That is 9.3% by property count and 10.4% by room count (5,480 of 52,540 rooms) — roughly half the 19.1% level for the market as a whole.
| Investment corporation | Matched holdings | Of which opened pre-1981 | Share |
|---|---|---|---|
| Invincible Investment Corporation (インヴィンシブル投資法人) | 110 | 19 | 17.3% |
| Japan Hotel & Residential Investment Corporation (日本ホテル&レジデンシャル投資法人) | 16 | 3 | 18.8% |
| Hoshino Resorts REIT (星野リゾート・リート投資法人) | 71 | 4 | 5.6% |
| Japan Hotel REIT Investment Corporation (ジャパン・ホテル・リート投資法人) | 53 | 2 | 3.8% |
| Ichigo Hotel REIT Investment Corporation (いちごホテルリート投資法人) | 29 | 0 | 0.0% |
| Kasumigaseki Hotel REIT Investment Corporation (霞ヶ関ホテルリート投資法人) | 15 | 0 | 0.0% |
| Mori Trust REIT (森トラストリート投資法人) | 6 | 0 | 0.0% |
| Seven investment corporations, total | 300 | 28 | 9.3% |
It is worth emphasising here that a pre-1981 opening does not make a property deficient. Listed REITs obtain detailed engineering reports including earthquake PML at acquisition, and the properties concerned have typically already completed seismic diagnosis and reinforcement. If anything, the figure shows that pre-1981 properties whose seismic performance has been confirmed trade smoothly even in the listed market. The very existence of 28 pre-1981 properties inside seven investment corporations is the evidence.
On the other hand, the gap between the market’s 19.1% and the listed portfolios’ 9.3% also means that much of the pre-1981 stock has yet to come into institutional investors’ acquisition scope. Properties whose seismic performance has not been confirmed and remediated are stuck at a stage before the securitisation pipeline. Put the other way round, completing scenario B (retrofit plus guest-room renovation) does more than improve earnings — it widens the range of buyers available at exit. That is an important implication for private funds and regional financial institutions.
The practical sequence from screening to confirmation
The tabulations in this article are on an opening-year basis, which in itself neither proves nor disproves a building’s seismic performance. In practice, the narrowing proceeds in the following order.
| Stage | What to do | What it can and cannot tell you |
|---|---|---|
| 1. Primary screening | Extract candidates by opening year and month, room count and number of storeys | Equivalent to this article’s tabulation. Gives the size and geographic distribution of the population. Says nothing about the seismic performance of an individual building |
| 2. Confirming regulatory scope | Check whether the building has three or more storeys and 5,000 m² or more of total floor area. Cross-check against the lists of seismic diagnosis results published by the competent administrative agency | Shows whether the building is a large-scale building requiring urgent safety confirmation and whether its diagnosis result has been published. Local-government sites publish this by building use |
| 3. Confirming the building | Obtain the certificate of entry in the building-confirmation register, the confirmation certificate and the inspection certificate. Establish whether the confirmation application date falls before or after 1 June 1981 | Establishes pre- or post-1981 status as a legal fact. The opening-year estimate is superseded at this point |
| 4. Quantifying performance | Seismic diagnosis (Is value), earthquake PML, engineering report | Produces whether reinforcement is needed, an approximate cost, and a quantified earthquake risk. Becomes the basis for lending and securitisation decisions |
| 5. Business plan | Compare cash flows across the three options corresponding to A / B / C in this article | Enables an investment decision that reflects the impact of closure during works, the scale of rate recovery, and the assumed exit |
The published lists of seismic diagnosis results used for cross-checking at stage 2 are posted by building use on the websites of prefectures and of the cities and wards that maintain a building official. Osaka City, Fukuoka City, Hokkaido, Aichi Prefecture and Chiba Prefecture are representative examples, and building names, addresses and diagnosis-result categories can be confirmed there. That stage 2 can be reached on public information alone is a practical advantage easily overlooked at the early stage of deal sourcing.
Conclusion — 19.1% is not “old stock” but “stock the system has named”
To review this article in figures: of the 1,233,409 rooms with confirmed operation and a known opening date, 235,730 rooms, or 19.1%, opened in the pre-1981 period. Of those, 50.7% are concentrated in the 588 buildings of 100 rooms or more, most of them in central commercial districts and tourism hubs. By category the split is wide — ryokan 49.6%, city hotels 27.2%, business hotels 9.7% — and the vintage gap in estimated settled ADR reverses direction as well, at −22.4% for city hotels against +8.1% for ryokan. Rebuild unit costs have risen 2.80x in 13 years, and incremental earnings in the same use would take 43 years to recover them.
Three practical conclusions follow. First, neither “pre-1981 means you can buy cheap” nor “pre-1981 means no value” holds unless categories are separated. Among ryokan and resorts, the pre-1981 properties achieve the higher rate. Second, seismic retrofitting generates no earnings on its own, but bundled with a guest-room renovation it pays back in 19.2 years. Whether regulatory compliance can be designed as the starting point for repositioning, rather than as a cost, is the fork in the road. Third, the case for rebuilding lies in the land, not the building. Locations where switching floor-area ratio and use makes floor value jump — those overlap with the central commercial clusters shown on this article’s map.
The line of 1 June 1981 is not a cut-off chosen by an analyst. It was drawn by law, the administration publishes the register, and owners are put to a procedure. That is exactly why, when the stock is cut along this line, what comes into view is not “the distribution of old buildings” but “the distribution of inventory that will certainly move.” The figure of 588 buildings is the population itself for the renovation, rebuilding and conversion to come in Japan’s hotel market.
Frequently asked questions
Can seismic performance be judged directly from a pre-1981 opening?
No. The tabulations in this article are a screening indicator based on the opening year and month, and do not indicate a building’s seismic performance. Properties that completed a rebuild or seismic reinforcement after opening are still counted on the pre-1981 side. In fact, 28 of the 300 properties held by the seven listed hotel REITs opened in the pre-1981 period, and those have been through due diligence at acquisition. The seismic performance of an individual building has to be confirmed through the certificate of entry in the building-confirmation register and seismic diagnosis results.
What are the criteria for a hotel or ryokan to be a “large-scale building requiring urgent safety confirmation”?
Hotels and ryokan with three or more storeys and a total floor area of 5,000 m² or more, among buildings for which construction started on or before 31 May 1981. Under the 2013 amendment to the Act on Promotion of Seismic Retrofitting of Buildings, owners were obliged to carry out a seismic diagnosis by the end of December 2015 and report the result to the competent administrative agency. Reported results are published on the websites of prefectures and of the cities and wards that maintain a building official.
How much do seismic retrofitting and rebuilding differ in cost?
In this article’s calculation (a 150-room city hotel with 6,750 m² of gross floor area in a regional hub city), seismic reinforcement alone comes to ¥4.5M per room, reinforcement plus a full guest-room renovation to ¥9.0M, and a rebuild to ¥28.41M (¥36.22M once inflation over the construction period is built in). A rebuild is therefore about 3.2 times the cost of reinforcement plus full guest-room renovation (¥9.0M per room). The construction unit cost is a simplified calculation based on the 2024 actual for lodging-use construction starts (¥1,955k per tsubo); an actual decision requires a project-specific feasibility study.
Which regions hold the most pre-1981 stock?
In absolute room count, Tokyo leads with 24,060 rooms, followed by Hokkaido at 20,567, Nagano at 12,154 and Osaka at 10,770. By share, Tottori at 39.5%, Yamagata at 33.2% and Gunma at 31.4% are at the top, all of them clusters of onsen ryokan. Restricting to 100 rooms and above, the leading clusters are Minato-ku, Tokyo (16 properties / 4,716 rooms), Kita-ku, Osaka (10 / 4,594) and Chuo-ku, Sapporo (17 / 4,488).
On the limitations of the data: the opening-year tabulations in this article are based on properties with confirmed operation within the scope tracked by MetroEngines Research, and are not a complete census. The 2,529 properties / 33,568 rooms whose opening year and month are unknown are excluded from the denominator. Because the opening year differs from a building’s completion year or building-confirmation year, it cannot be used to determine the seismic classification of an individual property. Construction unit costs are on an estimated-cost basis and will differ from actual outturn.
Related reading
- Hotels at Year 10: The Renovation Gap Is +13.6% Below 100 Rooms
- Old Malls and Warehouses as Next Hotel Rooms: Conversion Investment Boundaries
- Corporate Retreat Conversions: 8.27% GOP Yield Across 5 Onsen Areas
- Hotel Supply Pressure Ranking 2026-2027: Ozu Kumamoto Tops at 30.8%
- Japan Hotel Closures 2026: 3 Hotels, 316 Rooms Closed, 1,149 Delayed
References and sources
■ Data sources
The property and room population and the opening dates come from our property master (27,249 properties / 1,266,977 rooms with confirmed operation, of which 24,720 properties / 1,233,409 rooms have a known opening year and month). Estimated settled ADR is a monthly estimate applying category-specific adjustment coefficients to each property’s daily lowest plan level; the aggregation period is August 2025 to July 2026, and for properties of 100 rooms or more it covers pre-1981 N=457 properties / post-1981 N=800 properties (post-1981 randomly sampled), taking per-property medians and then a median per segment. Construction unit costs are for lodging-use buildings from the Ministry of Land, Infrastructure, Transport and Tourism’s “Statistical Survey on Building Construction” (building starts), nationwide and all structures, estimated construction cost divided by floor area. REIT ownership is derived by matching our ownership master (as at 17 August 2026, domestic properties) against our property master.
■ Limitations and caveats
The classification in this article is a screening indicator based on the opening year and month — not the building-confirmation year, and not the completion year. Properties rebuilt or fully reconstructed after opening remain on the pre-1981 side, and properties in pre-1981 buildings converted to hotel use in recent years fall on the post-1981 side, so it cannot be used to determine seismic performance at the property level. The 2,529 properties / 33,568 rooms whose opening year and month are unknown are excluded from the denominator. ADR is an estimate and differs from each property’s actual transacted prices and accounting figures. Construction unit costs are on an estimated-cost basis and differ from actual outturn; note that in 2024 a rising share of large high-rise projects pushed the unit cost up. The three-option calculation is a simplified model based on an assumed 150-room property with 6,750 m² of gross floor area, and does not reflect site-specific land conditions, the treatment of legally non-conforming existing buildings, or profit forgone during the works.
■ Market data
- MetroEngines Research & Consulting — property and room composition by opening year and month (27,249 properties / 1,266,977 rooms with confirmed operation, of which 24,720 properties / 1,233,409 rooms have a known opening year), estimated settled ADR, and the listed-REIT ownership master (as at 17 August 2026)
■ Government statistics and public data
- Ministry of Land, Infrastructure, Transport and Tourism, “Statistical Survey on Building Construction” (building starts) — number of building starts, floor area and estimated construction cost for lodging-use buildings (e-Stat statistics ID: 0003114490)
- Ministry of Land, Infrastructure, Transport and Tourism, “Act on Promotion of Seismic Retrofitting of Buildings and related regulations”
- Ministry of Land, Infrastructure, Transport and Tourism, “Outline of the Act on Promotion of Seismic Retrofitting of Buildings” (amended act in force 25 November 2013)
- Chiba Prefecture, “On the Act on Promotion of Seismic Retrofitting” — buildings dating from on or before 31 May 1981, reporting deadline of end-December 2015
- Hokkaido, “List of use and scale requirements for large-scale buildings requiring urgent safety confirmation”
- Osaka City, “Publication of seismic diagnosis results for large-scale buildings requiring urgent safety confirmation”
- Fukuoka City, “Publication of seismic diagnosis results for large-scale buildings requiring urgent safety confirmation”
- Aichi Prefecture, “Seismic diagnosis results for large-scale buildings requiring urgent safety confirmation”
■ Regulatory and technical information
- Japan Seismic Diagnosis Association, “What are the conditions for hotels and ryokan to be subject to mandatory seismic diagnosis?” — three or more storeys and 5,000 m² or more, reporting deadline of end-December 2015
- Rebuild, “Do hotels and ryokan need a seismic diagnosis? How to check pre-1981 status and how the diagnosis proceeds”
- Yamaichi Seiko, “What is seismic reinforcement work? Cost benchmarks, process and points to note for building and condominium owners” — per-square-metre benchmarks for added RC shear walls
- Ministry of Land, Infrastructure, Transport and Tourism, “How to proceed with seismic diagnosis and retrofitting work for hotels and ryokan under the amended Act on Promotion of Seismic Retrofitting”
■ Construction cost
- Turner & Townsend, construction cost inflation forecast for the Japanese market (+5.6% in 2025, +5.3% in 2026, +5.0% in 2027; the +4.5% from 2028 onward is this article’s extension assumption)
- Invincible Investment Corporation, portfolio (reference for operating results and GOP ratio)