

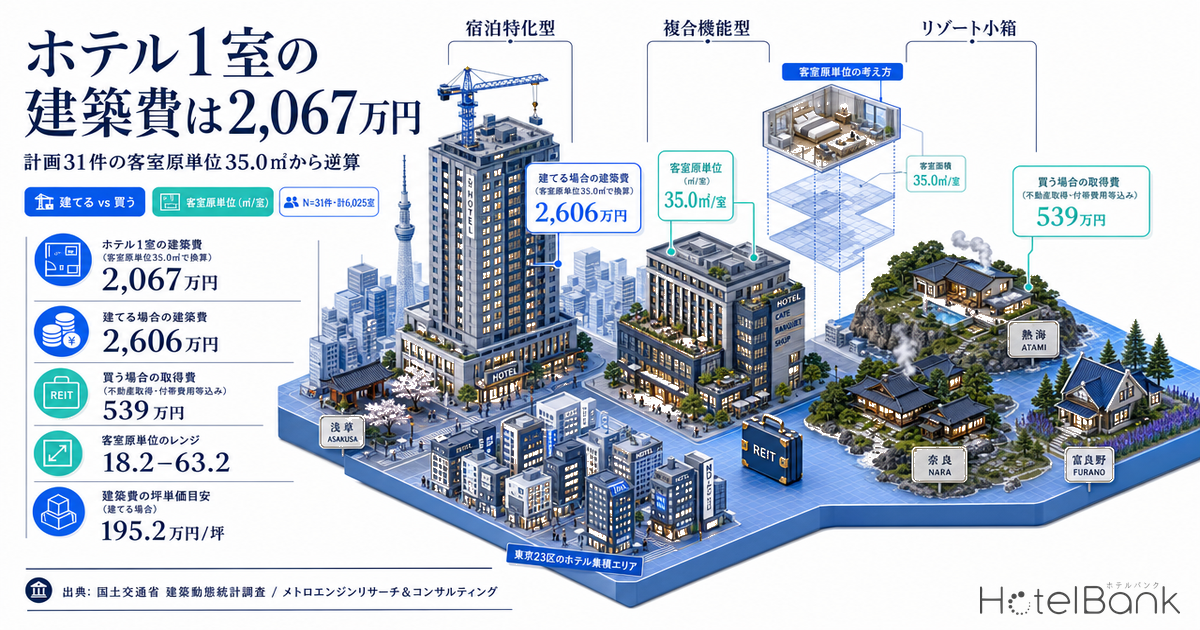
What does it actually cost, in building work alone, to construct one hotel room from scratch? Tables of cost per tsubo (1 tsubo = 3.30578 m²) are plentiful, but converting that figure into a per-room number requires a second coefficient: gross floor area ÷ number of rooms — the floor area per room (m²/room). That coefficient varies by more than tenfold across hotel formats, and no matter how precisely the cost per tsubo is set, an incorrect floor-area coefficient makes the whole estimate collapse. This article measures the floor area per room for 31 single-use hotel projects drawn from the Ministry of Land, Infrastructure, Transport and Tourism (MLIT) building-plan data, works back to a per-room construction cost, and then sets that against the per-room acquisition prices seven listed hotel REITs have actually paid.
■ Assumptions Behind the Estimate
- Population for floor area per room: building plans registered in MLIT’s “Statistical Survey on Building Construction Starts” with 30 rooms or more — 79 projects in total. Of these, the 39 whose stated use is hotel only were retained. Projects with mixed stated uses such as “office, retail, hotel” or “residential, hotel, retail” were excluded in full, because their gross floor area includes non-hotel floor space.
- Inclusion criteria: both gross floor area and room count registered, and floor area per room falling between 10 and 300 m²/room — 31 projects (6,025 rooms in total). The 8 exclusions comprise 6 with no registered gross floor area (one of which was a duplicate registration of the same project), 1 returning 0.1 m²/room (Minami-Semba, Chuo-ku, Osaka: 13 m² of floor area registered against 223 rooms), and 1 returning 436.7 m²/room (Hinokuchi-cho, Nishi-ku, Nagoya: 43,674 m² against 100 rooms). The latter two appear to reflect an order-of-magnitude entry error or a use-classification mismatch, so they were dropped from the aggregation.
- Cost per tsubo: 2025 actuals for hotel use from MLIT’s “Statistical Survey on Building Construction Starts” — ¥1.952M/tsubo across all structural types, ¥2.405M/tsubo for steel-frame (S), ¥2.026M/tsubo for reinforced concrete (RC), and ¥1.382M/tsubo for timber. Converted at 1 tsubo = 3.30578 m².
- Formula for construction cost per room: floor area per room (m²/room) ÷ 3.30578 × cost per tsubo (¥M/tsubo). This is building construction work only; it excludes land, FF&E (furniture, fixtures and equipment), pre-opening costs, design and supervision fees, and consumption tax.
- Population on the REIT side: the ownership master for the seven hotel-focused J-REITs (snapshot as of 17 August 2026), N=302 properties. The 15 properties held by Kasumigaseki Hotel REIT (霞ヶ関ホテルリート) were excluded in full because a column shift places acquisition price in the room-count field, and one further property missing either acquisition price or room count was also excluded. The base for level comparisons is therefore 286 properties.
- Restriction on the acquisition-year cohorts: the acquisition-date field reflects the actual timing of acquisition for four of the REITs — Invincible Investment (インヴィンシブル投資法人), Hoshino Resorts REIT (星野リゾート・リート), Ichigo Hotel REIT (いちごホテルリート) and Japan Hotel & Residential (日本ホテル&レジデンシャル). For Japan Hotel REIT (ジャパン・ホテル・リート) and Mori Trust REIT (森トラストリート) the same field reflects construction timing, so both were excluded from the cohort analysis. Of the 228 properties held by the four remaining REITs, 7 whose acquisition-date entries do not begin with a four-digit year and 1 missing acquisition price or room count were further excluded, leaving 220 properties for the acquisition-year analysis.
Metric Definitions Used in This Article
- Floor area per room (m²/room): the gross floor area registered in the building plan divided by the number of rooms. It is not the private area of the guestroom itself, but a coefficient that spreads the entire building floor plate — corridors, lobby, bathhouse, kitchen, plant rooms and all other common areas included — across one room.
- Construction cost per room (¥M/room): building construction cost derived by converting the floor area per room into tsubo and multiplying by the cost per tsubo. Excludes land, FF&E and pre-opening costs.
- Acquisition price per room (¥M/room): the property acquisition price disclosed by a REIT divided by its room count. This is a real transaction price that bundles land, building, FF&E and goodwill-equivalent together.
- Data sources: MetroEngines Research & Consulting; MLIT “Statistical Survey on Building Construction Starts”
- — Across 31 single-use hotel projects, the median floor area per room is 35.0 m²/room, with an interquartile range of 18.2–63.2 m² — a 3.5-fold spread. Any premise built on a single coefficient does not hold.
- — Floor area per room is clearly inversely correlated with room count. The 13 projects of 200 rooms or more have a median of 25.7 m², while the 7 high-coefficient projects above 80 m² cluster in small formats with a median of 60 rooms.
- — At ¥1.952M/tsubo, the derived construction cost per room has a median of ¥20.67M — ¥13.24M for limited-service (p25, steel frame) and ¥38.73M for full-service (p75, reinforced concrete).
- — Actual per-room transaction prices at four J-REITs moved from ¥12.71M in 2011–2015 to ¥26.06M from 2021 onward. Matching on room-count band widens the gap to ¥8.65M per room.
- — Whether that gap is read as land value, time value or a specification difference changes the conclusion. Development and acquisition must never be compared on building construction cost alone.
Median Floor Area per Room Is 35.0 m² — the Interquartile Range Spans 18.2 to 63.2 m², a 3.5-Fold Gap
Start with the measured values. Across the 31 single-use hotel projects, the floor area per room has a median of 35.0 m²/room, a first quartile of 18.2 m² and a third quartile of 63.2 m². The minimum is 13.1 m²/room, from a 40-room project in Asakusa, Taito-ku, Tokyo; the maximum is 215.5 m²/room, from a 48-room project in Hannyaji-cho, Nara — a 16-fold spread. The mean of 56.2 m²/room sits well above the median, which tells us the distribution has a long right tail. In other words, setting a single coefficient on the basis of an “average floor area per room” will substantially overstate the limited-service projects that make up the bulk of reality.
One caution is worth noting at the bottom of the distribution. A level of 13.1 m²/room is severely pared back for a figure meant to cover the entire building floor plate including common areas, and comes close to the private area of the guestroom itself. The possibility that the registered gross floor area does not fully capture common areas cannot be ruled out, so the safest reading treats this minimum as an indication of the achievable lower bound rather than a typical value. That said, the 15–19 m² band contains nine limited-service projects across central Tokyo, Sapporo and Funabashi, so the band itself is reproduced across multiple projects.
What the scatter plot shows is a clear inverse relationship between floor area per room and room count. The 13 projects of 200 rooms or more converge on a low median of 25.7 m²/room, and 7 of them fall below 30 m²/room. Conversely, the 7 projects above 80 m²/room cluster in small formats with a median of 60 rooms. Large format equals limited service equals low floor area per room; small format equals resort or high-value-added equals high floor area per room. That divergence in hotel format shows up directly in how the floor plate is used.
Breakdown by Floor-Area Band — the 7 Projects Above 80 m² Cluster at a Median of 60 Rooms
| Floor area per room | Projects | Total rooms | Median m²/room | Median rooms per project | Typical location & format |
|---|---|---|---|---|---|
| Under 20 m² | 10 | 2,050 rooms | 16.2 m² | 206 rooms | Station-front limited-service in central and ordinance-designated cities |
| 20–40 m² | 7 | 1,378 rooms | 25.7 m² | 179 rooms | Mid-scale in suburbs and regional core cities |
| 40–80 m² | 7 | 1,731 rooms | 58.0 m² | 200 rooms | Full-service with large baths and banquet space |
| 80 m² and above | 7 | 866 rooms | 124.9 m² | 60 rooms | Resort and high-value-added small formats |
| All projects | 31 | 6,025 rooms | 35.0 m² | 180 rooms | — |
Project counts divide almost evenly into quarters, but the weight of rooms is heavily skewed. The 10 projects under 20 m² supply 2,050 rooms, while the 7 projects above 80 m² deliver only 866. Counted by projects, the high-coefficient type accounts for 23% of the total; counted by rooms, it is only 14%. This structure is why the market looks different depending on whether the discussion is framed in terms of pipeline “rooms” or pipeline “projects.”
Location Splits the Coefficient — 15 to 18 m² in Tokyo’s 23 Wards, Over 100 m² in Resort Areas
Plotting the 31 projects on a map confirms that the floor-area bands map directly onto geography. All 10 projects located in Tokyo’s 23 wards fall within a 13–46 m² range, and 8 of them are under 20 m². By contrast, projects in tourist destinations such as Atami, Furano, Awaji Island, Urasoe and Shimonoseki all exceed 60 m²/room. Even within the single act of “building a hotel,” the higher the land price, the more the floor plate is concentrated into guestrooms; the lower the land price, the more it is allocated to common areas and additional facilities — an allocation that follows straightforward economic logic. The zoning, floor-area-ratio and land-price constraints that underpin this are set out market by market in Hotel Development Capacity 2026: Zoning, FAR & Land Price in 5 Markets.
| Min — Asakusa, Taito-ku, Tokyo | 13.1 m² / 40 rooms |
| Dogenzaka, Shibuya-ku, Tokyo | 15.6 m² / 231 rooms |
| Higashi-Kujo, Minami-ku, Kyoto | 58.0 m² / 270 rooms |
| Higashi-Kaigan-cho, Atami, Shizuoka | 124.9 m² / 277 rooms |
| Max — Hannyaji-cho, Nara | 215.5 m² / 48 rooms |
Derived Construction Cost per Room — ¥20.67M at the Median, ¥10.75M at p25, ¥37.32M at p75
From here we apply the cost per tsubo to reach a per-room figure. The formula — floor area per room (m²/room) ÷ 3.30578 × cost per tsubo — is simple, but because both variables swing widely, it is more practical to hold the result as a matrix than as a single number.
| Floor area per room | Tsubo/room | Timber ¥1.382M/tsubo | All structures ¥1.952M/tsubo | RC ¥2.026M/tsubo | Steel ¥2.405M/tsubo |
|---|---|---|---|---|---|
| Min 13.1 m² | 3.96 | ¥5.48M | ¥7.74M | ¥8.03M | ¥9.53M |
| p25 18.2 m² | 5.51 | ¥7.61M | ¥10.75M | ¥11.15M | ¥13.24M |
| Median 35.0 m² | 10.59 | ¥14.63M | ¥20.67M | ¥21.45M | ¥25.46M |
| p75 63.2 m² | 19.12 | ¥26.42M | ¥37.32M | ¥38.73M | ¥45.98M |
| Max 215.5 m² | 65.19 | ¥90.09M | ¥127.25M | ¥132.07M | ¥156.78M |
The practical implication is clear. Limited-service (p25 band, steel frame) comes to ¥13.24M per room; a standard project (median, all-structure average) to ¥20.67M per room; and a full-service scheme with a heavy common-area load (p75 band, reinforced concrete) to ¥38.73M per room. Holding those three reference points makes it possible, at first-pass screening, to place immediately how much of total investment building construction alone will absorb. The level of the cost per tsubo itself, and how it compares across construction methods, is a separate question; this article layers the floor-area coefficient on top of that price level.
Actual REIT Transactions per Room — from ¥12.71M in 2011–15 to the ¥26M Range from 2016 Onward
Next, the observed levels on the “buy” side. Across 286 properties held by the seven hotel-focused J-REITs, the median acquisition price divided by room count is ¥23.26M per room. But that figure lumps together acquisitions from the 1980s through to the present, so it needs to be split by year of acquisition.
| Acquisition-year cohort | Properties | Median per room | First quartile | Third quartile |
|---|---|---|---|---|
| 2011–2015 | 83 | ¥12.71M | ¥7.76M | ¥23.90M |
| 2016–2020 | 83 | ¥29.17M | ¥16.06M | ¥40.08M |
| 2021–2026 | 54 | ¥26.06M | ¥15.31M | ¥51.92M |
| 4 REITs, all periods | 220 | ¥20.48M | ¥11.16M | ¥38.87M |
From ¥12.71M per room in 2011–2015 to ¥29.17M per room in 2016–2020, the cohort median rose roughly 2.3-fold. The most recent cohort, 2021–2026, appears slightly lower at ¥26.06M per room on the median, but the third quartile stepped up from ¥40.08M to ¥51.92M — so the accurate reading is not that the level fell, but that the dispersion of acquired properties widened. Indeed, the 54 properties acquired from 2021 onward have a modest median of 137.5 rooms, and isolating only the 18 properties with 99 rooms or fewer lifts the median price per room sharply to ¥54.16M. The recent portfolio picture is one in which a handful of high-priced small formats sit alongside standard 100–199-room limited-service properties (median ¥23.11M per room).
To check the influence of outliers, the cohort aggregation was also re-run excluding properties below ¥3M or above ¥150M per room. The medians were essentially unchanged — ¥12.93M for 2011–2015, ¥29.17M for 2016–2020 and ¥26.06M for 2021–2026. Even with a small number of properties that appear to reflect price allocation within a bulk portfolio acquisition, the median-based comparison holds.
Build vs. Buy — Matching Room-Count Bands Widens the Gap from ¥5.39M to ¥8.65M
Now to the central comparison. Setting the overall medians side by side, building alone costs ¥20.67M per room, while buying land and building together costs ¥26.06M per room — a gap of ¥5.39M per room, or 26%. But this comparison has a trap in it: the building-plan population and the REIT acquisition population are not matched on room scale. So the figures are re-laid by room-count band.
| Room scale | Median m²/room (plans) | Construction cost (all structures) | Construction cost (steel) | REIT acquisition per room | Gap (all-structure basis) |
|---|---|---|---|---|---|
| 99 rooms or fewer | 132.2 m² n=6 | ¥78.07M | ¥96.18M | ¥54.16M n=18 | −¥23.91M |
| 100–199 rooms | 24.5 m² n=12 | ¥14.46M | ¥17.82M | ¥23.11M n=27 | +¥8.65M |
| 200 rooms or more | 25.7 m² n=13 | ¥15.18M | ¥18.71M | ¥24.05M n=9 | +¥8.87M |
| All | 35.0 m² n=31 | ¥20.67M | ¥25.46M | ¥26.06M n=54 | +¥5.39M |
In the bands of 100 rooms and above, the plan-side floor area per room converges at 24–26 m², so building construction cost settles into ¥14.46M–¥15.18M per room, and the gap against actual REIT transactions of ¥23.11M–¥24.05M per room widens to ¥8.65M–¥8.87M per room — wider than in the overall comparison. In the band of 99 rooms or fewer the sign flips. The 6 building plans in that band skew toward resort and high-value-added formats with an extreme floor area per room of 132.2 m², so building work alone reaches ¥78.07M per room, exceeding the ¥54.16M per room the REITs actually paid. For small formats, the result is that building is more expensive than buying — though this is better read as a reflection of currently planned small formats being specified above the small formats REITs already hold, rather than as a market arbitrage. On the cost advantage of acquiring and converting existing stock instead of building new, Corporate Retreat Conversions: 8.27% GOP Yield Across 5 Onsen Areas tests the question against observed conditions in five onsen and highland areas.
Reading the ¥8.65M Gap — Three Scenarios
How should the ¥8.65M per-room gap in the 100–199-room band be interpreted? It is not the kind of figure that permits a definitive answer, so three readings are set out side by side. Each carries a different implication for investment decisions.
A The land-value reading
The most straightforward reading: the ¥8.65M per-room gap broadly corresponds to the land component. At a 100-room scale that is ¥870M; building 2,450 m² of gross floor area (24.5 m² × 100 rooms) at a 600% floor-area ratio implies a site of roughly 408 m², which works out to about ¥7.0M per tsubo. That is on par with the average published land price across all of Tokyo’s 23 wards (¥7.30M per tsubo in 2026) and well short of the levels in the five central wards (ward averages of ¥14.32M–¥33.17M per tsubo). If this reading is correct, a relative advantage for in-house development remains in areas — regional core cities, for instance — where land prices sit well below that mark.
B The time-value and lease-up reading
A substantial part of the gap is compensation for being operational immediately. Single-use hotels take an average of 1.96 years from construction start to completion, on top of which sit design, permitting and the lease-up period. An acquisition generates NOI from the following month; a development generates no cash flow for three to four years. If this reading is correct, the gap is explicable as cost of capital × time, making it a variable that widens or narrows with the interest-rate environment.
C The specification-difference reading
The two sides were never comparable in the first place. Construction cost here covers only building work from the shell, excluding FF&E, fixtures, signage, systems and pre-opening payroll. Even for limited-service hotels it is conventional to budget ¥2M–¥4M per room for FF&E and ¥1M–¥2M for pre-opening costs, which alone could account for around half the gap. If this reading is correct, ¥8.65M is not an arbitrage opportunity but an omission in the estimate, and the point at issue becomes how total investment is set when a development is being assessed.
In practice, it is natural to assume all three are operating at once. What matters comes down to a single point: development and acquisition must not be compared on building construction cost alone. The derived figures in this article — ¥20.67M (overall median) and ¥14.46M (100–199-room band) — cover the building only. Land, FF&E, pre-opening costs and design and supervision fees have to be stacked on top before the number stands on the same ground as a REIT acquisition price.
Sensitivity Analysis — Construction Cost per Room When Floor Area and Cost per Tsubo Move ±10%
The derivation is a product of two variables, so sensitivity compounds multiplicatively. The figures below swing around the base case for the 100–199-room band (24.5 m²/room, ¥1.952M/tsubo all-structure average, ¥14.46M per room).
| Case | Floor area per room | Cost per tsubo | Cost per room | vs. base | Building cost at 100 rooms |
|---|---|---|---|---|---|
| Downside (floor area −10%, cost per tsubo −10%) | 22.1 m² | ¥1.757M | ¥11.71M | −19.0% | ¥1.17bn |
| Floor area −10% only | 22.1 m² | ¥1.952M | ¥13.01M | −10.0% | ¥1.30bn |
| Base case | 24.5 m² | ¥1.952M | ¥14.46M | — | ¥1.45bn |
| Cost per tsubo +10% only | 24.5 m² | ¥2.147M | ¥15.91M | +10.0% | ¥1.59bn |
| Steel frame adopted (¥2.405M/tsubo) | 24.5 m² | ¥2.405M | ¥17.82M | +23.2% | ¥1.78bn |
| Upside (floor area +10%, cost per tsubo +10%) | 27.0 m² | ¥2.147M | ¥17.50M | +21.0% | ¥1.75bn |
At a 100-room scale, the downside case of ¥1.17bn and the upside case of ¥1.75bn differ by close to ¥600M. Switching from the all-structure average to steel frame alone moves the figure +23% (moving from reinforced concrete to steel still adds +19%). Put differently, whether floor area per room and structure can be pinned down early in design very largely determines the precision of every yield calculation that follows. Measured build times are covered in Hotel Build Times: 2.80-Year Median, 1.96 Solo vs 4.00 Mixed-Use.
Two Axes — 25 Combinations of Floor Area × Cost per Tsubo, and the Line Where Building Costs More
The six cases above are only representative swings. Floor area per room and cost per tsubo each move independently, so placing 25 combinations on two axes at once makes it easier to locate a given project. Every row is a floor-area figure measured in this article (p25, the medians by room-count band, the overall median and p75), and every column is a cost per tsubo used in this article (structure-specific actuals and the all-structure average ±10%). No extrapolated levels are included.
| Floor area per room \ cost per tsubo | Timber ¥1.382M | Average −10% ¥1.757M | All structures ¥1.952M | Average +10% ¥2.147M | Steel ¥2.405M |
|---|---|---|---|---|---|
| p25 18.2 m² Bottom of limited-service | 7.61 | 9.67 | 10.75 | 11.82 | 13.24 |
| 100–199-room band 24.5 m² Base case | 10.24 | 13.02 | 14.46 | 15.91 | 17.82 |
| 200-plus-room band 25.7 m² Large format | 10.75 | 13.67 | 15.18 | 16.70 | 18.71 |
| Overall median 35.0 m² Median of the 31 projects | 14.63 | 18.60 | 20.67 | 22.73 | 25.46 |
| p75 63.2 m² Full-service | 26.42 | 33.59 | 37.32 | 41.05 | 45.98 |
Six of the 25 cells fall into red, and all of them sit in rows at or above 35.0 m² of floor area per room. Put the other way round, a project whose floor area per room stays in the 25 m² range will not reach ¥23.11M per room in building construction cost even as the cost per tsubo swings from timber to steel. Read across (variation in cost per tsubo), the base row moves by ¥7.58M; read down (variation in floor area), the column at ¥1.952M/tsubo moves from ¥10.75M to ¥37.32M — a range of ¥26.57M. Uncertainty in construction cost comes far more from floor area per room than from cost per tsubo, which is consistent with this article’s contention that the allocation of floor space settled early in design is the pivot point of the investment decision.
A note on reading the data: building-plan data is compiled on a building-confirmation-application basis. Confirmation applications precede construction start, and even single-use hotels take a median of roughly 2.0 years from start to completion, so counts for future years are structurally undercounted. The N=31 projects here are only those single-use hotel plans registered as of now; counts and room totals are expected to rise as further applications are filed. The figures should be read as a lower bound on the currently confirmed pipeline. Construction cost per room is likewise an estimate covering building construction work only, and any actual investment decision requires a detailed, project-specific feasibility study.
Conclusion
Cost per tsubo is well documented in public data, but the coefficient that translates it into a per-room figure — floor area per room — has rarely circulated as a measured value. Four findings emerge from this analysis.
First, across 31 single-use hotel projects the median floor area per room is 35.0 m²/room, with an interquartile range of 18.2–63.2 m² — a 3.5-fold spread. Second, floor area per room is clearly inversely correlated with room count: projects above 200 rooms cluster in the 20–30 m² band, while the high-coefficient type above 80 m² concentrates in small formats with a median of 60 rooms. Third, derived at ¥1.952M/tsubo, construction cost per room has a median of ¥20.67M, running to ¥13.24M for limited-service (p25, steel frame) and ¥38.73M for full-service (p75, reinforced concrete). Fourth, comparing like with like in the 100–199-room band, building construction cost of ¥14.46M per room sits against actual REIT transactions of ¥23.11M per room — a gap of ¥8.65M per room.
Whether that ¥8.65M is read as the land component, as time value or as an omission in the estimate changes the conclusion about where to place the emphasis — development or acquisition. At the very least, concluding that “building is cheaper” from a comparison of building construction cost alone is premature. FF&E and pre-opening costs have to be stacked on, and the price of land and time made explicit, before the comparison holds. The floor-area coefficient is the tool for getting a numerical grip on that first step.
Related Reading
- Hotel Build Times: 2.80-Year Median, 1.96 Solo vs 4.00 Mixed-Use
- Policy Rate 1.00%: Break-Even ADR Across Japan’s 8 Hotel Markets
- Hotel Development Capacity 2026: Zoning, FAR & Land Price in 5 Markets
- Corporate Retreat Conversions: 8.27% GOP Yield Across 5 Onsen Areas
- Kaihin-Makuhari 1,000-Room ¥30bn Mixed-Use: Breakeven ADR ¥13,200
- Regional Bank-Led Small-Scale Continuous Hotel Funds — Capital Supply vs. Large REIT Acquisitions
References and Sources
■ Data sources
Floor area per room is based on building plans from MLIT’s “Statistical Survey on Building Construction Starts,” taking the 79 projects with 30 rooms or more as the population, narrowing to the 39 whose stated use is hotel only, and then to the 31 projects (6,025 rooms) with both gross floor area and room count registered and a floor area per room between 10 and 300 m²/room. The acquisition-price side draws on the ownership master for the seven hotel-focused J-REITs (snapshot as of 17 August 2026, N=302 properties; 286 properties for level comparisons; 4 REITs and 220 properties for the acquisition-year cohorts). Cost per tsubo is the 2025 hotel-use actual from the same statistical survey. Address geocoding by the Geospatial Information Authority of Japan. Aggregation by MetroEngines Research & Consulting.
■ Limitations and caveats
(1) Building-plan data is compiled on a building-confirmation-application basis, so future years are structurally undercounted. The N=31 projects here represent a lower bound on the currently confirmed pipeline. (2) Construction cost per room is a derived figure covering building construction work only, and excludes land, FF&E, pre-opening costs, design and supervision fees, and consumption tax. REIT acquisition price per room is a real transaction price that bundles all of these together; the two are not figures on the same footing. (3) Gross floor area is the whole building floor plate, not the private area of guestrooms. The minimum of 13.1 m²/room cannot be cleared of the possibility that common areas are thinly recorded, and should be read only as an indication of the lower bound. (4) The acquisition-year cohorts are limited to the four REITs whose acquisition-date field reflects actual acquisition timing, and do not represent the level across all seven. (5) The sensitivity analysis and the two-axis grid apply the derivation formula mechanically; no probability has been assigned to any scenario.
■ Market data
- MetroEngines Research & Consulting — REIT ownership master (snapshot as of 17 August 2026, N=302 properties, of which 286 used in aggregation); aggregation of building-plan data
■ Government statistics and public data
- MLIT “Statistical Survey on Building Construction Starts” — building plans and planned construction cost by structure
- MLIT “Construction Cost Deflator”
- e-Stat “Statistical Survey on Building Construction Starts”
- Geospatial Information Authority of Japan — GSI Maps API (address geocoding)
■ REIT and industry reports
- Japan Hotel REIT Investment Corporation — portfolio list
- Invincible Investment Corporation — portfolio list
- Ichigo Hotel REIT Investment Corporation — portfolio
- Japan Hotel & Residential Investment Corporation — portfolio
- Hoshino Resorts REIT Investment Corporation — portfolio list
- Mori Trust REIT Investment Corporation — portfolio list
- Kasumigaseki Hotel REIT Investment Corporation — portfolio list
- JLL “Japan Hotel Investment Market 2025”
- CBRE “Japan Cap Rate Survey — March 2026”
■ Construction cost benchmarks