

Hotel investment analysis usually starts with a single asset: acquisition price, projected ADR, NOI yield, and a long-term repair plan. Yet there is remarkably little published work that answers, in numbers, the question one level up — how much of what Japan’s lodging industry earns actually goes back into its buildings. This article takes eleven years of capital expenditure and depreciation reported by the lodging industry as a standalone sector in the Ministry of Finance’s Financial Statements Statistics of Corporations by Industry (annual survey), and reads them as a balance sheet for the industry as a whole.
An earlier HotelBank analysis covered capital expenditure at listed hotel REITs, where per-room outlays ran from ¥134,000 to ¥624,000 a year. That was a selected sample — prime assets held by listed REITs. The subject here is far broader: every incorporated business in the lodging industry, including small companies capitalised at under ¥10 million. The distance between the two is itself the point of this article.
Metric Definitions Used in This Article, and the Industry Classification Applied
- Industry classification: We use industry code 139, “Accommodations,” from the Ministry of Finance’s Financial Statements Statistics of Corporations by Industry (annual survey). In that survey, accommodations is tabulated as a standalone sector, separate from food and beverage services, and every headline figure in this article rests on that standalone classification. Where we use the combined “Accommodations, Eating and Drinking Services” aggregate instead, we say so at each point.
- Renewal investment ratio = capital expenditure ÷ total depreciation. A value above 1.0 means the sector invested more in fixed assets that year than the asset value it consumed (calculated by HotelBank).
- Capex-to-sales ratio = capital expenditure ÷ net sales (same basis).
- Tangible fixed asset turnover = net sales ÷ tangible fixed assets (quoted directly as published in the survey).
- Capital expenditure: the survey’s “capital expenditure excluding software.” In accommodations, land accounts for 0.0–3.4% of this depending on the year, so it is effectively investment in buildings, structures and equipment (per the newly acquired fixed asset breakdown in the quarterly survey).
- Room stock: of roughly 168,000 properties tracked nationwide by MetroEngines Research, the 27,162 properties and 1,267,377 rooms whose operation can be confirmed on OTAs (as of August 2026).
- Data sources: Ministry of Finance, Financial Statements Statistics of Corporations by Industry (e-Stat table IDs 0003060791 / 0003060191); Small and Medium Enterprise Agency, Basic Survey on Small and Medium Enterprises (e-Stat 0003286862 / 0003320726); Ministry of Health, Labour and Welfare, Report on Public Health Administration and Services (e-Stat 0004048182); MetroEngines Research & Consulting.
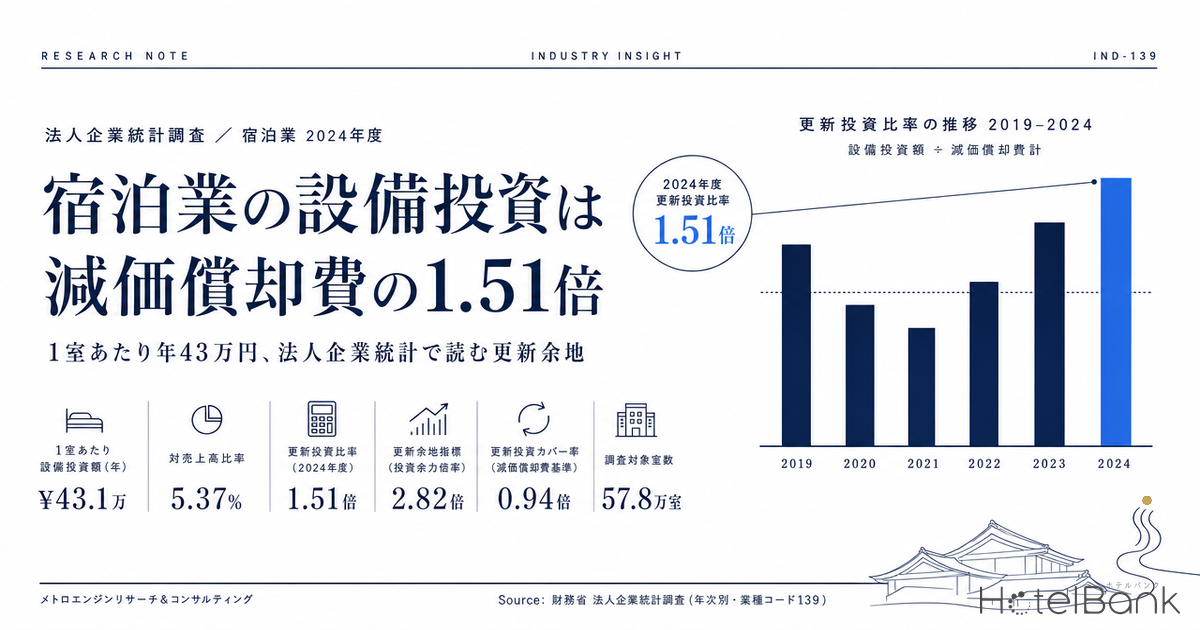
- — A renewal investment ratio of 1.51x — in FY2024 the lodging industry’s ¥546.8 billion of capital expenditure exceeded total depreciation of ¥362.3 billion, beating the 1.25x recorded across all industries.
- — A split by company size — companies capitalised at ¥100 million or more rebounded to 2.82x, while those under ¥100 million sat at 0.94x. Smaller operators are not yet recovering the asset value they consume.
- — ¥310,000–¥430,000 per room per year — the industry average lands in the middle of the range recorded by listed hotel REIT properties (¥134,000–¥624,000).
- — 578,000 rooms waiting — spending ¥400,000 a year on each room opened before 1996 would come to ¥231.1 billion a year, equivalent to 42.3% of FY2024 capital expenditure.
- — 0.99x over the last five years combined — once the pandemic freeze is included, the industry has only just recovered the asset value it consumed.
Executive Summary — a 1.51x Renewal Investment Ratio, Back Above the 1.25x All-Industry Level
The conclusion first. Capital expenditure in the lodging industry reached ¥546.8 billion in FY2024, or 1.51 times the ¥362.3 billion of total depreciation booked that year. That is above the 1.25x recorded across all industries (excluding finance and insurance, all company sizes). Capital expenditure as a share of sales came to 5.37%, well clear of the 3.21% all-industry figure. Measured by how much of its earnings it puts back into its buildings, the lodging industry sits on the high side even in a cross-industry comparison — that is the first fact the corporate statistics deliver.
That 1.51x does, however, contain a rebound from FY2020, when the ratio fell to 0.40x during the pandemic. Cumulatively over five years, ¥1,835.2 billion of capital expenditure against ¥1,860.0 billion of total depreciation gives a ratio of 0.99x. Taken together, FY2020 through FY2024 amounts to putting back roughly the same value the industry consumed, and no more. By the volume of work deferred during closures, there is still a great deal for reinvestment to flow into — that is the straightforward reading.
One more point. Dividing capital expenditure by the room stock whose operation can be confirmed gives ¥431,000 per room per year, which sits squarely in the middle of the range recorded by four listed hotel REITs (¥134,000–¥624,000 per room per year). The industry as a whole is not being outclassed by the prime sample. The gap shows up not in the level but, as the next section shows, between size tiers.
Eleven Years of the Renewal Investment Ratio — Two Independent Survey Designs, One Shape
The Financial Statements Statistics of Corporations by Industry comes in two series: an annual survey covering all company sizes down to those capitalised at under ¥10 million, and a quarterly survey covering companies capitalised at ¥10 million or more. The chart below places the two side by side despite their different populations and survey designs. The levels differ, but the peaks and troughs line up almost exactly. This is not the quirk of a single sample; it is capturing how the industry actually invests.
Three phases stand out. Phase 1 (FY2016–FY2018) was the inbound demand expansion, with the ratio at 1.09x, 1.52x and 1.35x — above 1.0 for three straight years. The capex-to-sales ratio also held high at 5.95%, 6.15% and 5.99%. The capital committed then is operating today as rooms seven to ten years old.
Phase 2 (FY2019–FY2021) ran 0.72x, 0.40x, 0.71x. The 0.40x of FY2020 is the lowest of these eleven years. With sales shrinking to ¥4,161.3 billion, much of the renewal work that requires extended construction periods was pushed back. That deferred work did not disappear; it carried forward as an investment opportunity in later years.
Phase 3 (FY2022–FY2024) ran 1.04x, 1.24x, 1.51x — above 1.0 for three consecutive years, and rising each year. The quarterly survey points the same way at 1.12x, 1.26x and 1.60x. All four quarters of FY2025 (April 2025–March 2026) are already in on the quarterly basis, at 1.26x. That is calmer than the FY2024 spike, but it is roughly level with the 1.27x ten-year median on the same basis — not a return to the low band around 1.0.
In absolute terms the picture is sharper still. Depreciation is remarkably stable in the low ¥300 billions — ¥312.0 billion in FY2019, ¥305.1 billion in FY2020, ¥362.3 billion in FY2024. The value existing buildings consume each year does not pause for demand. Only capital expenditure moves, and it swings 4.5-fold, from ¥121.4 billion (FY2020) to ¥546.8 billion (FY2024).
That asymmetry is what makes asset management hard in this industry. Depreciation is a fixed, near-constant erosion of asset value; capital expenditure flexes with trading performance. Squeeze investment in a downturn and the ratio falls that year, but the erosion continues. The longer the trough, the more total volume accumulates to be put back later.
| Fiscal year | Capital expenditure | Total depreciation | 1. Renewal investment ratio | 2. Capex-to-sales ratio | 3. Tangible fixed asset turnover | Ref: all industries (1) |
|---|---|---|---|---|---|---|
| FY2015 | ¥327.5bn | ¥344.7bn | 0.95x | 4.76% | 1.02x | 1.07x |
| FY2016 | ¥464.4bn | ¥425.0bn | 1.09x | 5.95% | 0.72x | 1.12x |
| FY2017 | ¥534.8bn | ¥351.3bn | 1.52x | 6.15% | 1.46x | 1.19x |
| FY2018 | ¥481.0bn | ¥355.3bn | 1.35x | 5.99% | 1.25x | 1.28x |
| FY2019 | ¥223.4bn | ¥312.0bn | 0.72x | 3.27% | 1.28x | 1.11x |
| FY2020 | ¥121.4bn | ¥305.1bn | 0.40x | 2.92% | 0.68x | 1.06x |
| FY2021 | ¥314.6bn | ¥444.5bn | 0.71x | 6.95% | 0.72x | 1.08x |
| FY2022 | ¥395.0bn | ¥379.7bn | 1.04x | 6.82% | 0.85x | 1.10x |
| FY2023 | ¥457.4bn | ¥368.4bn | 1.24x | 5.74% | 1.42x | 1.18x |
| FY2024 | ¥546.8bn | ¥362.3bn | 1.51x | 5.37% | 1.74x | 1.25x |
The third indicator, tangible fixed asset turnover, is worth adding: from 0.68x in FY2020 to 1.74x in FY2024. Sales generated per yen of tangible fixed assets rose roughly 2.5-fold, with higher rates and recovering occupancy showing up in asset efficiency (allowing for year-to-year movement in the denominator as well). While that efficiency holds, funding for capital expenditure is relatively easier to secure. It is a favourable window for pushing reinvestment forward.
The Split by Company Size — 2.82x Above ¥100 Million in Capital, 0.94x Below
Break the 1.51x industry average down by capital tier and the view changes. In FY2024, companies capitalised at ¥100 million or more posted 2.82x and those under ¥100 million posted 0.94x — a threefold gap inside the same industry.
| Fiscal year | All sizes | Capital ¥100m or more | Capital under ¥100m | Ref: accommodations, eating and drinking services (combined) |
|---|---|---|---|---|
| FY2019 | 0.72x | 0.85x | 0.66x | 0.51x |
| FY2020 | 0.40x | 0.24x | 0.47x | 0.38x |
| FY2021 | 0.71x | 0.49x | 0.78x | 1.05x |
| FY2022 | 1.04x | 1.02x | 1.05x | 0.96x |
| FY2023 | 1.24x | 1.57x | 1.15x | 1.21x |
| FY2024 | 1.51x | 2.82x | 0.94x | 1.17x |
What is interesting is that this ordering is not fixed. In FY2020–FY2021 it was reversed. Companies capitalised at ¥100 million or more cut back to 0.24x and 0.49x, while those under ¥100 million held 0.47x and 0.78x. Larger operators can stop major refurbishments — and when they do, the ratio drops hard. Smaller operators invest mainly in day-to-day maintenance and repair, which is difficult to stop in the first place. The reversal reflects a structural difference in how elastic investment is at each tier.
Then, from FY2023, the larger tier came back at speed. The 2.82x of FY2024 means roughly three times the asset value consumed was put into fixed assets in a single year. Public-area refurbishment, guest room renewals, upgrades to energy-efficient plant — with the demand recovery confirmed, the deferred work started moving. The 0.94x at companies under ¥100 million shows how much room that wave still has to reach. As a destination for industry-wide reinvestment, this tier covers the largest area.
Since FY2016, the lodging industry’s capex-to-sales ratio has run broadly between 5% and 7%, setting aside the pandemic dip (3.27% in FY2019, 2.92% in FY2020). That is well above the roughly 3% seen across all industries — the only year it fell below was FY2020, at 2.92% against 3.01% — and the character of a capital-intensive industry shows plainly in the numbers. If your product is a room, the product ages unless you keep working on the asset. That structure makes the investment burden per yen of sales heavier here than in other industries.
Among smaller operators, the use of that investment is more concentrated still. Looking at capital expenditure by purpose for accommodations (industry sub-group 75) in the Basic Survey on Small and Medium Enterprises, “maintenance, repair and renewal of existing buildings and equipment” accounted for 83.0% in FY2016 — a sharp rise from 34.7% in FY2014 and 47.5% in FY2015. In value terms, the ¥174.5 billion of FY2016 was ten times the ¥17.4 billion of FY2014. Not new openings, not business conversion: keeping the building you already have is where most of the smaller tier’s capital expenditure goes — the same picture emerging from an entirely separate survey design.
The two surveys must not simply be added together: the Financial Statements Statistics of Corporations by Industry (Ministry of Finance) covers incorporated businesses of all sizes, stratified by capital tier, while the Basic Survey on Small and Medium Enterprises (Small and Medium Enterprise Agency) covers SMEs as defined by the Small and Medium-sized Enterprise Basic Act. The populations and survey dates differ, so their capital expenditure figures cannot be summed, and neither can be treated as a breakdown of the other. Here we use the SME survey only as qualitative supporting evidence on what smaller operators spend on.
Converting to a Per-Room Figure — the ¥431,000 Industry Average Sits Mid-Range Against REIT Assets
Now translate these amounts into the unit investors actually use. Dividing FY2024 capital expenditure of ¥546.8 billion by the 1,267,377 rooms (27,162 properties) whose operation MetroEngines Research can confirm gives ¥431,433 per room per year — about ¥430,000.
The denominator you choose changes the answer. Rooms under the “hotel and ryokan business” category of the Hotel Business Act numbered 1,757,557 (end of FY2021, Ministry of Health, Labour and Welfare, Report on Public Health Administration and Services); on that broader denominator the figure falls to ¥311,107 per room per year. Either way, the per-room conversion in this article is approximate. The lodging industry in the corporate statistics includes entities with no guest rooms, while the room stock includes unincorporated, owner-operated inns. We flag up front that numerator and denominator do not cover exactly the same population.
Side by side, the industry average sits right in the middle of the range recorded by REIT-held properties (¥134,000–¥624,000 per room per year). There is no order-of-magnitude break between prime assets held by listed REITs and the industry-wide average. Recalling that the reinvestment multiple (capital expenditure ÷ depreciation) at those REITs ranged from 0.29x to 1.43x, the FY2024 industry average of 1.51x is if anything at the top of that band.
That said, the comparison has some latitude. “Capital expenditure” on the REIT side is a concept confined to work that preserves a building’s asset value, while “capital investment” in the corporate statistics covers acquisition of newly created fixed assets generally. Since land makes up only 0.0–3.4% of the total in this industry, the broad comparison holds — but the industry average of ¥546.8 billion also includes construction investment for new openings. Isolate renewal investment in existing buildings and the per-room level comes in below the figures above. By the same token, the room for reinvestment in existing stock is larger than the headline numbers suggest.
| Category | Subject | Per room per year | Reinvestment multiple |
|---|---|---|---|
| REIT-held properties | Japan Hotel REIT Investment Corporation (8985) | ¥624k | 1.43x |
| REIT-held properties | Invincible Investment Corporation (8963) | ¥564k | 1.00x |
| Industry average | All lodging companies (divided by 1,267,377 active rooms) | ¥431k | 1.51x |
| Industry average | All lodging companies (divided by 1,757,557 Hotel Business Act rooms) | ¥311k | 1.51x |
| REIT-held properties | Ichigo Hotel REIT Investment Corporation (3463) | ¥268k | 1.26x |
| REIT-held properties | Japan Hotel & Residential Investment Corporation (3472) | ¥134k | 0.29x |
Sizing the Renewal Pipeline — 578,000 Rooms Opened Before 1996
The renewal investment ratio is a flow measure. Lay the stock side over it and the scale of what reinvestment is aimed at comes into view.
HotelBank has already measured the depth of ageing stock at the room level in Japan’s pre-1981 hotel stock: 236,000 rooms, 19.1% of all rooms and 226,000 hotel rooms across 32 regional core cities, 42.7% built before 1996. Splitting the 1,233,252 rooms nationwide with a known opening year into vintages gives the following.
Rooms opened before 1996 number 577,871, or 46.9% of those with a known opening year. Rooms from 1980 or earlier alone account for 223,522 (18.1%) still in operation. The 246,147 rooms from 1981–1990 are the largest single block, now 35 to 45 years past opening.
Multiply that by a per-room reinvestment figure and the total renewal pipeline can be sized. Assume the 577,871 rooms opened before 1996 each cycle through ¥400,000 of reinvestment per year — close to the median of the REIT results — and the requirement is ¥231.1 billion a year, equivalent to 42.3% of the industry’s ¥546.8 billion of FY2024 capital expenditure. Maintaining ageing stock alone absorbs something over four-tenths of the industry’s capital expenditure.
Put the other way round, those four-tenths are an investment opportunity whose demand is already locked in. Whether or not lodging demand grows, buildings get older every year. Refurbishment, plant replacement, seismic retrofitting, energy-efficiency work — for the contractors on the receiving end, this is a legible market. So when should an individual property schedule that work? The relationship between years since opening and room rates is measured in Hotels at year 10: measuring renovation timing with the 2016 cohort.
| Tokyo | 54,615 rooms | 35.1% |
| Hokkaido | 46,979 rooms | 57.1% |
| Osaka | 31,530 rooms | 34.7% |
| Nagano | 26,500 rooms | 60.7% |
| Shizuoka | 23,225 rooms | 52.9% |
| Chiba | 21,954 rooms | 53.0% |
| Hyogo | 20,660 rooms | 58.7% |
| Kanagawa | 19,781 rooms | 46.7% |
Sensitivity — Move the Assumptions and Renewal Still Takes 20–90% of Industry Capex
The ¥231.1 billion estimate above rests on two assumptions: ¥400,000 per room per year, applied to the 577,871 rooms opened before 1996. The grid below shows how it moves when those assumptions change.
| Reinvestment per room per year | Opened before 1996 577,871 rooms | Opened before 2001 677,473 rooms | All stock with known opening year 1,233,252 rooms |
|---|---|---|---|
| ¥200k | ¥115.6bn (21.1%) | ¥135.5bn (24.8%) | ¥246.7bn (45.1%) |
| ¥300k | ¥173.4bn (31.7%) | ¥203.2bn (37.2%) | ¥370.0bn (67.7%) |
| ¥400k (base case) | ¥231.1bn (42.3%) | ¥271.0bn (49.6%) | ¥493.3bn (90.2%) |
| ¥500k | ¥288.9bn (52.8%) | ¥338.7bn (61.9%) | ¥616.6bn (112.8%) |
| ¥600k | ¥346.7bn (63.4%) | ¥406.5bn (74.3%) | ¥740.0bn (135.3%) |
Wherever you look in the grid, renewal investment accounts for a large share — 20% to 90% — of the industry’s annual capital expenditure. Applying ¥500,000 or more per room to the entire stock takes it past 100%, which shows that renewing every room every year at that level is not realistic — not that the investment requirement is overstated. In practice the work is smoothed, arriving as a concentrated peak once every five to ten years.
| Scenario | Renewal investment ratio | Basis for the ratio | Annual capital expenditure | Coverage of the ¥231.1bn requirement |
|---|---|---|---|---|
| Pessimistic | 0.40x | FY2020 actual (lowest in the ten years compiled here) | ¥144.9bn | 63% |
| Central (base case) | 1.51x | FY2024 actual (annual survey, all company sizes) | ¥546.8bn | 237% |
| Optimistic | 1.60x | FY2024 on the quarterly survey basis (capital ¥10m or more) | ¥579.7bn | 251% |
Of the three scenarios, only the pessimistic case fails to meet the renewal requirement. The 0.40x of FY2020 came at a moment when investment decisions stopped across the board under the pandemic; sustained at that level, the industry would accumulate a backlog of necessary renewal. Conversely, as long as the ratio stays at normal levels, the industry as a whole is not short of funding for renewal investment. The constraint is not the quantity of capital but which tier that capital reaches.
Translated into investor practice, there are three implications.
1. The industry average is a usable benchmark
The industry average of ¥311,000–¥431,000 per room per year sits mid-range against REIT-held properties. When testing an individual property’s long-term repair plan, placing this industry average alongside REIT disclosures shows where that property stands within the industry.
2. The upside sits in different places by size tier
In FY2024, companies capitalised at ¥100 million or more recovered to 2.82x while those under ¥100 million reached only 0.94x. Considerable room for reinvestment remains among smaller operators. For regional financial institutions, reading the renewal investment ratio into business-viability assessment turns support into something concrete. On how that capital gets structured on the supply side, Regional bank-led small-scale continuous hotel funds follows the specific schemes.
3. Depreciation tells you the investment floor
Depreciation is stable in the low ¥300 billions. That amount is a near-certain annual erosion of asset value and serves as a guide to the annual floor for renewal investment. Building a feasibility case with reinvestment above the depreciation charge makes the funding plan for refurbishment years far less strained.
Conclusion — the Industry’s Balance Sheet Is in a Reinvestment Phase
In the annual survey of the Ministry of Finance’s Financial Statements Statistics of Corporations by Industry, the lodging industry is reported as a standalone sector. There is no need to fall back on the combined “Accommodations, Eating and Drinking Services” figures: capital expenditure and depreciation for the industry alone can be traced across eleven years. That fact alone adds a new yardstick to the hotel investment conversation.
Four things emerge. First, the FY2024 renewal investment ratio of 1.51x is above the 1.25x recorded across all industries. Second, over the last five years including the pandemic the cumulative ratio is 0.99x — barely returning the asset value consumed, meaning deferred investment opportunities have accumulated. Third, the gap between tiers is wide, at 2.82x for companies capitalised at ¥100 million or more against 0.94x below that, so the largest area for reinvestment lies with smaller operators. Fourth, the per-room industry average of ¥311,000–¥431,000 a year sits mid-range against listed REIT-held properties, so the industry as a whole is in no unusual position.
And 577,871 rooms — 46.9% of active stock — opened before 1996. Maintaining that ageing stock at ¥400,000 per room per year implies ¥231.1 billion annually, or 42.3% of the industry’s annual capital expenditure. The total volume that reinvestment is aimed at is already fixed, independent of whether demand rises or falls. It is worth holding the size of that base in mind when thinking about hotel investment.
Frequently Asked Questions
Q. Can “accommodations” be obtained as a standalone sector in the Financial Statements Statistics of Corporations by Industry?
Yes. Both the annual and quarterly surveys of the Ministry of Finance’s Financial Statements Statistics of Corporations by Industry set industry code 139, “Accommodations,” as a standalone classification, so capital expenditure, depreciation, sales and tangible fixed assets can be obtained separately from food and beverage services. Code 156, “Accommodations, Eating and Drinking Services,” is a higher-level classification that includes food and beverage services, and the two do not match. In FY2024 the renewal investment ratio was 1.51x for accommodations alone and 1.17x for the combined classification.
Q. What is the lodging industry’s renewal investment ratio (capex ÷ depreciation)?
It was 1.51x in FY2024 (Ministry of Finance, Financial Statements Statistics of Corporations by Industry (annual survey), accommodations standalone, all company sizes). All industries excluding finance and insurance came to 1.25x that year, so lodging is above it. Over the past ten years, the high was 1.52x in FY2017 and the low was 0.40x in FY2020; over the most recent five years (FY2020–FY2024) the cumulative ratio is 0.99x.
Q. How much capital expenditure per room does the lodging industry make each year?
Dividing FY2024 capital expenditure of ¥546.8 billion by the 1,267,377 rooms whose operation can be confirmed gives ¥431,433 per room per year (about ¥430,000). Dividing by the 1,757,557 hotel and ryokan rooms under the Hotel Business Act (end of FY2021) gives ¥311,107 (about ¥310,000). Both are approximate: the lodging industry in the corporate statistics includes entities with no guest rooms, while the room stock includes unincorporated, owner-operated inns, so numerator and denominator do not cover exactly the same population.
Q. Is the lodging industry’s capex-to-sales ratio high compared with other industries?
It is high. FY2024 came in at 5.37%, above the 3.21% for all industries excluding finance and insurance. Since FY2016 it has run broadly between 5% and 7%, setting aside the pandemic years FY2019 and FY2020 (3.27% and 2.92%), well above the roughly 3% for all industries — the only year it fell below was FY2020. The numbers reflect a capital-intensive industry whose product is the guest room asset itself.
Q. Do investment patterns differ by company size?
In FY2024, companies capitalised at ¥100 million or more posted 2.82x against 0.94x for those under ¥100 million. That relationship reversed in FY2020–FY2021, however (0.24x and 0.49x for the larger tier against 0.47x and 0.78x for the smaller), suggesting that the ratio at larger operators swings widely with the timing of major refurbishments, while smaller operators, focused on routine maintenance and repair, vary far less.
Q. What do smaller lodging businesses spend their capital expenditure on?
Looking at capital expenditure by purpose for accommodations in the Small and Medium Enterprise Agency’s Basic Survey on Small and Medium Enterprises, “maintenance, repair and renewal of existing buildings and equipment” accounted for 83.0% (¥174.5 billion) in FY2016, up from 34.7% in FY2014 and 47.5% in FY2015 — a rising weight on maintenance and renewal. FY2016 is the most recent year for which this table is published.
Related reading
- Japan’s Pre-1981 Hotel Stock: 236k Rooms, 19.1% — Retrofit or Rebuild
- 226k Hotel Rooms in 32 Regional Cities: 42.7% Built Before 1996
- Leasehold Hotel Development: 1.38x Land Price Reach Across 9 Markets
- Hotels at Year 10: The Renovation Gap Is +13.6% Below 100 Rooms
- Regional Bank-Led Small-Scale Continuous Hotel Funds — Capital Supply vs. Large REIT Acquisitions
References and Sources
Data sources
Ministry of Finance, Financial Statements Statistics of Corporations by Industry, annual survey (e-Stat table ID 0003060791; industry codes 139 “Accommodations” and 104 “all industries (excluding finance and insurance),” FY1975–FY2024) and quarterly survey (0003060191, companies capitalised at ¥10 million or more). Small and Medium Enterprise Agency, Basic Survey on Small and Medium Enterprises (0003286862 / 0003320726). Ministry of Health, Labour and Welfare, Report on Public Health Administration and Services (0004048182, as of end-FY2021). Room stock is on MetroEngines Research & Consulting’s OTA-listing confirmed basis (27,162 properties and 1,267,377 rooms, of which 24,683 properties and 1,233,252 rooms have a known opening year, as of August 2026).
Estimation assumptions
Renewal investment ratio = capital expenditure (excluding software) ÷ total depreciation. Annual reinvestment per room is a simple ¥200,000–¥600,000 assumption set with reference to trailing 12-month results at four listed hotel REITs (¥134,000–¥624,000), with ¥400,000 as the base case. The renewal pipeline base is the 577,871 rooms opened before 1996 out of the 1,233,252 rooms with a known opening year. The renewal investment ratios in the scenario table are set within the range of actual results compiled here (low 0.40x in FY2020, high 1.52x in FY2017) and the FY2024 quarterly-survey value of 1.60x.
Limitations and caveats
The corporate statistics are a financial aggregation at the company level and carry no room counts. The per-room figures are an industry average obtained by mechanically dividing aggregate capital expenditure by room stock, and are not a substitute for any individual property’s long-term repair plan. The annual survey (all company sizes) and the quarterly survey (capital of ¥10 million or more) cover different populations, so ratios differ even for the same fiscal year (FY2024: 1.51x vs. 1.60x). The latest publication of the Report on Public Health Administration and Services is end-FY2021, so the reference date of the room stock does not align with the other data. Capital expenditure includes land at 0.0–3.4% depending on the year. This article addresses the industry-wide balance sheet and is not intended for investment decisions or yield assessment on individual properties.
Government statistics (primary data)
- Ministry of Finance, Financial Statements Statistics of Corporations by Industry, time-series data, industries excluding finance and insurance (annual survey, unadjusted) (e-Stat table ID 0003060791; industry codes 139 “Accommodations” and 104 “all industries (excluding finance and insurance)”; size classes: all sizes / ¥100m and above / under ¥100m)
- Ministry of Finance, Financial Statements Statistics of Corporations by Industry, time-series data, industries excluding finance and insurance (quarterly survey, unadjusted) (e-Stat table ID 0003060191, industry code 139 “Accommodations”; used to confirm the land share via the newly acquired fixed asset breakdown)
- Small and Medium Enterprise Agency, Basic Survey on Small and Medium Enterprises, table 5, capital investment by industry sub-group (incorporated enterprises) (e-Stat table ID 0003286862, industry sub-group “Accommodations,” FY2014–FY2016)
- Small and Medium Enterprise Agency, Basic Survey on Small and Medium Enterprises, population of enterprises by industry sub-group (e-Stat table ID 0003320726; number of enterprises and employees in the accommodations population)
- Ministry of Health, Labour and Welfare, Report on Public Health Administration and Services — environmental health: number of hotel and ryokan establishments and rooms, and simple lodging and boarding house establishments (e-Stat table ID 0004048182, end-FY2021, nationwide)
- Ministry of Health, Labour and Welfare, Report on Public Health Administration and Services — survey outline
- Ministry of Finance, Financial Statements Statistics of Corporations by Industry — survey outline and coverage
Market data
- MetroEngines Research & Consulting — domestic room stock (OTA-listing confirmed basis; 27,162 properties and 1,267,377 rooms, of which 24,683 properties and 1,233,252 rooms have a known opening year, as of August 2026), room counts by prefecture and by opening-year vintage
Prior HotelBank analysis (cited)
- “Hotel capital expenditure of ¥134,000–¥624,000 per room per year — major repairs read from the disclosures of five listed hotel REITs” (compiled from the financial summaries, asset management reports and timely disclosures of five listed hotel REITs. This article quotes only the per-room annual reinvestment and reinvestment multiples and does not recalculate them.)
- Japan’s Pre-1981 Hotel Stock: 236k Rooms, 19.1% — Retrofit or Rebuild
- 226k Hotel Rooms in 32 Regional Cities: 42.7% Built Before 1996