

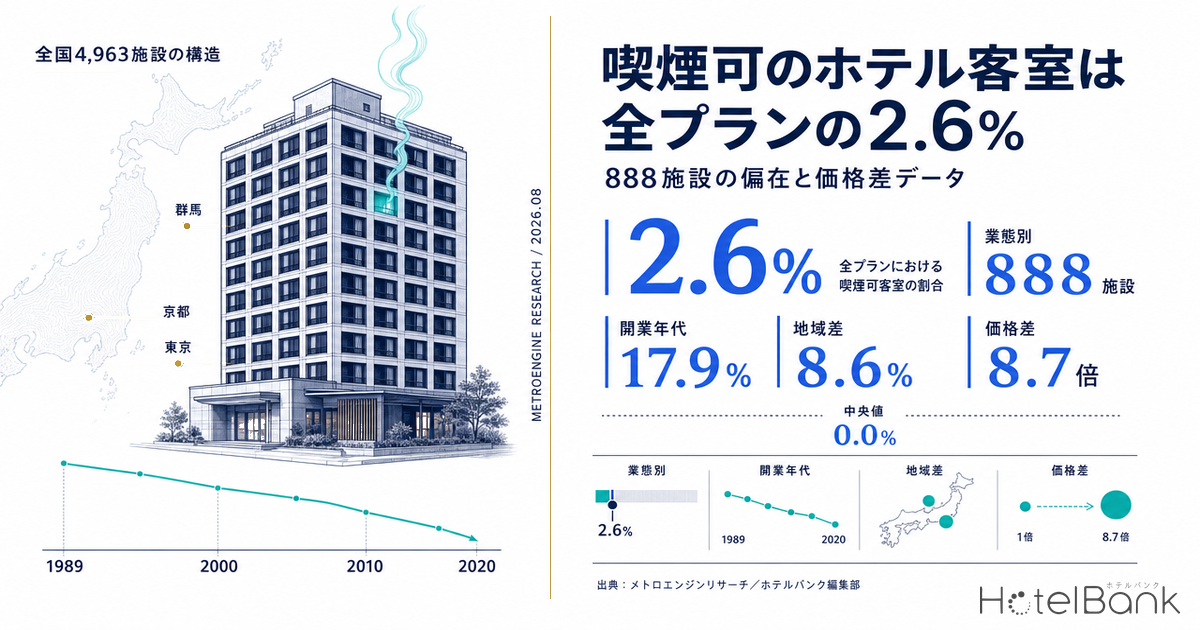
When hotel rooms are sorted into non-smoking and smoking, where does Japan’s lodging inventory actually sit today? Aggregating every accommodation plan MetroEngines Research could confirm as listed nationwide as of August 2026, smoking-permitted plans account for 2.6% of the total, and only 888 properties offer them at all. This article breaks down which property types, which regions and which opening vintages that 2.6% survives in, then goes one step further and tests whether smoking and non-smoking rooms inside the same property are actually priced differently.
Metric Definitions and Methodology Used in This Article
- Scope: Accommodation plans confirmed as listed on or after August 1, 2026, aggregated by smoking classification (smoking / non-smoking / unclassified). Non-smoking: 369,250 plans across 4,951 properties. Smoking: 9,831 plans across 888 properties. Unclassified: 2,559 plans across 244 properties.
- Treatment of unclassified plans: The 2,559 plans (244 properties) whose smoking status cannot be determined are excluded from all share calculations. The resulting denominator is 379,081 plans and 4,963 properties. Only 3 properties list unclassified plans exclusively, so the impact on the property-level population is limited.
- Listed price: Per-room rate for two guests in one room, tax included. This differs from the actual transacted price.
- Important note: These figures are based on plans listed for sale on OTAs and similar channels, not on the actual non-smoking/smoking composition of every room each property holds. Room types that are not listed are excluded from the counts.
- Data source: MetroEngines Research
- — Smoking-permitted plans number 9,831 (2.59%) out of the 379,081 classifiable plans. Yet 888 of 4,963 properties (17.9%) list at least one, producing a two-tier structure in which many properties hold a small amount each.
- — 82.2% of the 888 properties holding smoking inventory are business or city hotels. Ryokan account for 5.9% and resort hotels 8.1%, and the concentration by property type holds on both a property basis and a plan basis.
- — Among business hotels, 55.9% of those opened in 2000–2009 hold smoking inventory, against 8.6% of those opened in 2020 or later. Smoking rooms are inventory that new supply barely creates.
- — Holding property type constant at business hotels, the regional gap persists: 55.0% in Gunma against 6.3% in Kyoto, a 8.7x spread. How scarce this inventory is depends entirely on the region.
- — Matching 7,296 within-property pairs that differ only in smoking classification, the price gap has a median of 0.0%, with 44.5% falling inside ±1%. Scarce as it is, this inventory is not priced differently.
National Share — 2.6% of Plans, but 17.9% of Properties
Start with the overall picture. Nationwide, 379,081 plans can be classified by smoking status, and 9,831 of them permit smoking — a share of 2.59%. Shift to a property basis and the view changes. A total of 888 properties list at least one smoking-permitted plan, which is 17.9% of the 4,963 classifiable properties. In other words, roughly one property in six holds smoking inventory, but even at those properties it makes up only a sliver of what they sell.
That two-tier structure suggests smoking rooms are being run as a deliberately narrowed allocation rather than as a facility on its way out. Among the 888 properties that hold smoking inventory, 206 keep smoking plans below 5% of their listings and 159 keep them at 5–10% — together 41.1% of the group. At the other end, 97 properties devote 35% or more of their listings to smoking inventory, so policy varies widely from property to property.
| Smoking plans as a share of listed plans | Properties | Share |
|---|---|---|
| Under 5% | 206 | 23.2% |
| 5-10% | 159 | 17.9% |
| 10-20% | 236 | 26.6% |
| 20-35% | 190 | 21.4% |
| 35% or more | 97 | 10.9% |
Covers the 888 properties listing smoking-permitted plans. Source: MetroEngines Research; compiled by the HotelBank Editorial Team
Viewed through the lens of scarcity, that figure is the starting point. Inventory that exists in only one out of every forty listed plans nationwide still draws a steady stream of specific requests on the demand side. What follows traces where that scarce allocation has survived.
By Property Type — 82% of Smoking Inventory Sits in Business and City Hotels
Cut by property type and the concentration is unmistakable. Among business hotels, 590 of 1,633 properties (36.1%) hold smoking inventory, and on a plan basis they reach 5.78%, the highest of any type. City hotels follow at 140 of 451 properties (31.0%). Together those 730 properties represent 82.2% of the 888 that hold smoking inventory. By plan count, 8,047 plans belong to those two types, or 81.9% of all 9,831 smoking plans. The hypothesis that this inventory concentrates in business hotels holds up on both a property basis and a plan basis.
By contrast, only 87 of 1,471 ryokan (5.9%) and 45 of 554 resort hotels (8.1%) hold any. On a plan basis, ryokan fall below one percent at 0.94%. Room stock built mainly around Japanese-style rooms, along with the spread of an operating model that places a shared smoking area inside the building and keeps every guest room non-smoking, likely explains much of this.
Source: MetroEngines Research; compiled by the HotelBank Editorial Team
| Property type | Properties listed | With smoking inventory | Property share | Smoking plans | Plan share |
|---|---|---|---|---|---|
| Business hotels | 1,633 | 590 | 36.1% | 6,280 | 5.78% |
| City hotels | 451 | 140 | 31.0% | 1,767 | 2.79% |
| Deluxe hotels | 55 | 10 | 18.2% | 181 | 2.08% |
| Resort hotels | 554 | 45 | 8.1% | 419 | 0.65% |
| Ryokan | 1,471 | 87 | 5.9% | 1,068 | 0.94% |
Top five property types shown. Only plans whose smoking status can be classified are counted. Source: MetroEngines Research; compiled by the HotelBank Editorial Team
This concentration is not a matter of property size. Comparing average room counts among business hotels alone, the 590 with smoking inventory average 147 rooms and the 1,042 that are non-smoking only average 152 — essentially the same. Large versus small is not what separates them.
By Opening Vintage — Down to 8.6% Among Business Hotels Opened Since 2020
So what does? Cut by opening vintage and a clear gradient appears. Splitting the 1,608 business hotels with a known opening year by decade, 193 of 345 properties opened in 2000–2009 (55.9%) hold smoking inventory, against 124 of 430 opened in 2010–2019 (28.8%) and 32 of 370 opened in 2020 or later (8.6%). Set against the 55.2% for properties opened in the 1990s, that is less than a sixth of the level.
Covers 1,608 business hotels with a known opening year. Source: MetroEngines Research; compiled by the HotelBank Editorial Team
The numbers show room design at newly built hotels shifting to a non-smoking default around the full enforcement of the revised Health Promotion Act in April 2020. Put the other way, smoking rooms are inventory that new supply barely creates. If existing stock converts to non-smoking with each renovation, the total will keep thinning. Structurally, the supply-side read is that scarcity intensifies over time. Renovation timing as the moment room specifications get switched is examined from another angle in Hotels at Year 10: The Renovation Gap Is +13.6% Below 100 Rooms.
By Region — An 8.7x Gap That Survives Even Within One Property Type
Looking at the share of properties permitting smoking by prefecture, the naive expectation of low in the cities and high in the regions does not hold as stated. On an all-property-type basis, the highest shares are Miyazaki at 43.5%, Kochi at 40.5%, Aomori at 37.8%, Toyama at 34.1% and Ibaraki at 32.1%. The lowest are Okinawa at 4.5%, Kyoto at 4.9%, Yamanashi at 7.9%, Kumamoto at 8.6% and Nara at 8.8%. Tokyo sits in the middle at 14.9%.
| Rank | Prefecture | Properties listed | With smoking inventory | Share |
|---|---|---|---|---|
| 1 | Miyazaki | 46 | 20 | 43.5% |
| 2 | Kochi | 37 | 15 | 40.5% |
| 3 | Aomori | 45 | 17 | 37.8% |
| 4 | Toyama | 44 | 15 | 34.1% |
| 5 | Ibaraki | 81 | 26 | 32.1% |
| 6 | Akita | 47 | 15 | 31.9% |
| 7 | Saitama | 47 | 14 | 29.8% |
| 8 | Aichi | 136 | 39 | 28.7% |
| 9 | Kagoshima | 82 | 23 | 28.0% |
| 10 | Kagawa | 48 | 13 | 27.1% |
| 11 | Fukuoka | 122 | 29 | 23.8% |
| 12 | Hokkaido | 300 | 70 | 23.3% |
| 13 | Chiba | 138 | 32 | 23.2% |
| 14 | Wakayama | 52 | 12 | 23.1% |
| 15 | Hiroshima | 81 | 18 | 22.2% |
| 16 | Shiga | 41 | 9 | 22.0% |
| 17 | Tokushima | 28 | 6 | 21.4% |
| 18 | Ehime | 52 | 11 | 21.2% |
| 19 | Miyagi | 86 | 18 | 20.9% |
| 20 | Okayama | 48 | 10 | 20.8% |
| 21 | Iwate | 69 | 14 | 20.3% |
| 22 | Osaka | 209 | 41 | 19.6% |
| 23 | Kanagawa | 194 | 38 | 19.6% |
| 24 | Nagasaki | 72 | 14 | 19.4% |
| 25 | Yamaguchi | 73 | 14 | 19.2% |
| 26 | Gifu | 94 | 17 | 18.1% |
| 27 | Gunma | 124 | 22 | 17.7% |
| 28 | Hyogo | 176 | 31 | 17.6% |
| 29 | Mie | 115 | 20 | 17.4% |
| 30 | Ishikawa | 85 | 14 | 16.5% |
| 31 | Yamagata | 76 | 12 | 15.8% |
| 32 | Tokyo | 335 | 50 | 14.9% |
| 33 | Saga | 47 | 7 | 14.9% |
| 34 | Fukui | 47 | 7 | 14.9% |
| 35 | Tochigi | 134 | 19 | 14.2% |
| 36 | Shizuoka | 305 | 43 | 14.1% |
| 37 | Niigata | 135 | 18 | 13.3% |
| 38 | Fukushima | 101 | 13 | 12.9% |
| 39 | Oita | 128 | 14 | 10.9% |
| 40 | Tottori | 46 | 5 | 10.9% |
| 41 | Nagano | 234 | 25 | 10.7% |
| 42 | Shimane | 48 | 5 | 10.4% |
| 43 | Nara | 34 | 3 | 8.8% |
| 44 | Kumamoto | 70 | 6 | 8.6% |
| 45 | Yamanashi | 89 | 7 | 7.9% |
| 46 | Kyoto | 162 | 8 | 4.9% |
| 47 | Okinawa | 200 | 9 | 4.5% |
All property types. Only properties listing plans whose smoking status can be classified are counted (N=4,963 properties). Source: MetroEngines Research; compiled by the HotelBank Editorial Team
Property-type mix is mixed into these figures. Kyoto and Okinawa skew heavily toward ryokan and resort hotels, while Miyazaki and Aomori skew toward business hotels. Re-running the comparison with property type held constant at business hotels — across the 27 prefectures with at least 20 listed properties — the regional gap actually widens.
Covers the 27 prefectures with at least 20 listed business hotels. Source: MetroEngines Research; compiled by the HotelBank Editorial Team
Gunma clears half at 11 of 20 properties (55.0%), as do Kagoshima at 18 of 33 (54.5%) and Ibaraki at 21 of 40 (52.5%). At the other end, Kyoto sits at 4 of 64 (6.3%), Tokyo at 35 of 241 (14.5%) and Okinawa at 7 of 35 (20.0%). Gunma and Kyoto are 8.7x apart. Kanagawa’s high 45.5% reinforces the read that this is not a simple urban-versus-regional split, but a matter of whether a location sits in a major-city core and how much domestic business travel demand makes up the guest base.
This distribution doubles as a map of the options available to guests looking for a smoking room. Securing one in Kyoto or central Tokyo is structurally harder than in Gunma or Ibaraki. How scarce this inventory is differs completely by region.
Pricing — Across 7,296 Same-Property Pairs, the Median Gap Is 0.0%
If the inventory is scarce, it would be no surprise to see that reflected in price. To test it, we extracted within-property combinations where plan content, room type, bed type and occupancy all match and only the smoking classification differs, then compared their listed prices. A total of 7,296 pairs across 813 properties met the conditions. The comparison uses average listed prices per room for two guests, tax included, for check-in dates from August 16 through November 30, 2026.
The result was unambiguous. The price gap between smoking and non-smoking rooms has a median of 0.0% and a mean of −0.61%. Of the 7,296 pairs, 44.5% (3,247 pairs) fall inside ±1% — effectively identical pricing. The direction of the gap is close to symmetric as well: the smoking room is higher in 2,129 pairs, the two are near-identical in 2,556, and the non-smoking room is higher in 2,611. Neither a systematic premium nor a systematic discount is observable.
Matched within-property pairs, N=7,296 (813 properties). Compared on average listed price (two guests, one room, per room, tax included). Source: MetroEngines Research; compiled by the HotelBank Editorial Team
| Property type | Pairs | Smoking, avg. listed price | Non-smoking, avg. listed price | Median price gap |
|---|---|---|---|---|
| Business hotels | 4,896 | ¥19,211 | ¥19,405 | 0.00% |
| City hotels | 1,360 | ¥25,649 | ¥26,042 | 0.00% |
| Ryokan | 556 | ¥47,108 | ¥48,457 | -0.15% |
| Resort hotels | 318 | ¥37,382 | ¥38,594 | -1.74% |
| Deluxe hotels | 97 | ¥63,614 | ¥62,648 | +0.25% |
Top five property types shown (7,227 pairs, or 99.1% of all 7,296). The median price gap is the median of the per-pair ratio (smoking − non-smoking) ÷ non-smoking. Source: MetroEngines Research; compiled by the HotelBank Editorial Team
Business hotels, with the largest pair count at 4,896, come in at a median of 0.00%, as do city hotels at 1,360 pairs. Average listed prices at business hotels sit almost level, at ¥19,200 for smoking rooms and ¥19,400 for non-smoking. Only resort hotels show smoking rooms slightly lower, at a median of −1.74%, but with just 318 pairs the base is small and the figure should be read with a margin.
There is a revenue opportunity here. Inventory that makes up only 2.6% of listed plans is being sold at exactly the same price as the remaining 97.4%. Guests who filter specifically for smoking-permitted rooms face limited alternatives, which suggests their price elasticity is comparatively low. There is ample room to test a graduated differential — starting small, for instance by applying a difference of a few hundred yen only on dates when smoking rooms are requested most. The reverse design also works: positioning non-smoking rooms explicitly as the higher tier for guests who prefer them. Whichever direction a property leans, the present state is one of no differential at all, and the option of setting one remains entirely unused.
A note on listed prices for future dates: The price comparison in this section covers check-in dates from August 16 to November 30, 2026, and is based on selling prices listed at the time of the survey. Because plans are added and prices adjusted as the check-in date approaches, the levels compared here may shift.
The Regulatory Baseline — Where Guest Rooms Sit Under the Revised Health Promotion Act
Reading the supply structure above requires getting the regulatory baseline right. Under the revised Health Promotion Act, fully enforced from April 2020, hotels and ryokan are classified as facilities used by large numbers of people, placing them in Category II, where indoor areas are non-smoking in principle. Common areas such as lobbies, banquet halls, restaurants and corridors are in principle off-limits to smoking, and smoking is permitted only inside a dedicated smoking room that meets the required standards.
Guest rooms at lodging facilities, however, are treated as equivalent to places used for residence and therefore fall outside the scope of the regulation. Whether to permit smoking in a guest room is not prohibited by law; it is left to each property’s operating judgment. The fact that smoking rooms still exist at 888 properties as of 2026 is the result of choices made on the basis of that exemption. Conversely, because common areas remain non-smoking in principle, even properties that hold smoking rooms design their in-house circulation around a non-smoking default.
That guest-room exemption carries real weight on the supply side. The shift to non-smoking was never uniformly mandated by law; it advanced property by property, according to renovation timing and judgments about the guest base. That is precisely why such wide variation by opening vintage and by region remains.
Demand-Side Context — A Widening Inbound Market and International Smoking-Rate Gaps
The demand side deserves attention too. According to Japan National Tourism Organization (JNTO) estimates, inbound visitors to Japan reached a record 42,683,600 in 2025. By country and region, South Korea led with 9,459,600, followed by China with 9,096,300 and Taiwan with 6,763,400.
Smoking rates differ internationally. WHO estimates (2022, age-standardized tobacco smoking prevalence among those aged 15 and over) put adult smoking prevalence at 18.5% in Japan, against 23.1% in China, 19.6% in South Korea and 15.6% in the United States. South Korea and China, the two largest sources of inbound visitors, both exceed Japan, meaning arrivals from markets with higher smoking rates than Japan account for more than 40% of the total.
A caveat is in order, though: a gap in smoking rates does not translate directly into a gap in demand for smoking rooms. Choosing accommodation while travelling involves several factors at once — who is travelling together, the purpose of the stay, the price band. What can be said is that for the 888 properties holding smoking rooms, an audience this inventory can be marketed to explicitly exists beyond domestic demand as well. Stating smoking status clearly in multilingual room-amenity listings is a low-cost measure for turning a limited allocation into confirmed requests. On the regional distribution of inbound demand, Only 6 of 47 Prefectures Peak in Autumn: Japan’s Inbound Share Map is also worth consulting.
Heated-Tobacco-Only Rooms — 1,101 Plans Classified as Non-Smoking
One further area where the supply side is moving is the treatment of heated tobacco. The revised Health Promotion Act permits Category II facilities to install a dedicated heated-tobacco smoking room that meets the required standards, and use of such a room may include eating and drinking (which is not permitted in a smoking room dedicated to conventional cigarettes). People under the age of 20 may not be admitted to either a dedicated smoking room or a dedicated heated-tobacco smoking room.
Across listed accommodation plans, 1,184 plans at 98 properties include a heated-tobacco designation in the room name or plan name. What is notable is that 1,101 of them are classified as non-smoking. Only 74 fall under the smoking classification and 9 are unclassified. Most, in other words, are listed as an intermediate design: a non-smoking room in which heated tobacco alone is permitted.
That is instructive on the supply side. Maintaining smoking rooms for conventional cigarettes carries costs in interior finishes, ventilation and cleaning, plus the risk of residual odour reaching the next guest. The heated-tobacco-only middle path is designed to hold down those costs while still absorbing part of smoker demand. At 1,184 plans across 98 properties, the scale is still small — just 2.0% of the 4,963 properties nationwide. Read the other way, this middle category is a space where supply has barely been filled, leaving room to design an option that converts room stock to non-smoking without giving up smoker demand entirely.
Conclusion — Thinning Inventory, Widening Regional Gaps, and Pricing Left Untouched
Here is a summary of what this analysis established.
| Finding | Data |
|---|---|
| National share | Smoking-permitted plans are 2.59% of listed plans (9,831/379,081). On a property basis, 17.9% (888/4,963) |
| Property-type concentration | 82.2% of the 888 properties holding smoking inventory are business or city hotels. Ryokan 5.9%, resorts 8.1% |
| Vintage gap | Among business hotels, 55.9% of 2000s vintages hold smoking inventory versus 8.6% of those opened in 2020 or later |
| Regional gap | On a business-hotel basis, Gunma at 55.0% against Kyoto at 6.3% — an 8.7x spread |
| Pricing | Across 7,296 within-property pairs, the median price gap is 0.0%, with 44.5% inside ±1% |
| Heated tobacco | Plans carrying a heated-tobacco designation number 1,184 at 98 properties; 1,101 of them are classified non-smoking |
Source: MetroEngines Research; compiled by the HotelBank Editorial Team
Supply is barely created by new openings and thins with each renovation of existing stock. The regional gap remains 8.7x wide even with property type held constant, so how scarce this inventory is differs completely by area. And yet no price differential exists. This is not a question of whether smoking or non-smoking is preferable; the fact itself — that inventory with a supply structure this asymmetric continues to be handled at a single price — is what remains untested.
For the 888 properties holding smoking inventory, testing a price for it as scarce allocation and adding a heated-tobacco-only middle tier are both actionable moves. For properties that operate non-smoking only, positioning a fully non-smoking building as an explicit value proposition works as a design. From either position, the place to start is comparing your own listing mix against the distribution nearby. On price structure within a region, Intra-Prefecture ADR Gaps 2026: Median 2.74x, Okinawa Widest at 5.86x is worth reading alongside this.
Related Reading
- Only 6 of 47 Prefectures Peak in Autumn: Japan’s Inbound Share Map
- Intra-Prefecture ADR Gaps 2026: Median 2.74x, Okinawa Widest at 5.86x
- Shizuoka’s 67 New 2026 Hotels: 1,089 Rooms, 64% One-Room Villas
- Chuseok Sep 24-27: Only Fukuoka, Saga, Kyoto Hold After Silver Week
- Hotels at Year 10: The Renovation Gap Is +13.6% Below 100 Rooms
References and Sources
- MetroEngines Research — accommodation plans aggregated by smoking classification (plans confirmed as listed on or after August 1, 2026; N=379,081 plans / 4,963 properties), and matched within-property pair price comparison (N=7,296 pairs)
- Ministry of Health, Labour and Welfare, Outline of the Act Partially Amending the Health Promotion Act (Japanese)
- Ministry of Health, Labour and Welfare, materials related to the Q&A on enforcement of the revised Health Promotion Act (Japanese)
- City of Sendai, Measures to Prevent Second-Hand Smoke (on the revised Health Promotion Act) (Japanese)
- City of Kashiwa, Outline of Second-Hand Smoke Prevention Measures Under the Health Promotion Act (requirements for dedicated heated-tobacco smoking rooms) (Japanese)
- Japan National Tourism Organization (JNTO), Foreign Visitors to Japan (December 2025 estimates)
- WHO, Global report on trends in prevalence of tobacco use 2000–2024 — country-level tobacco smoking prevalence (aged 15+, age-standardized, 2022 estimates)