

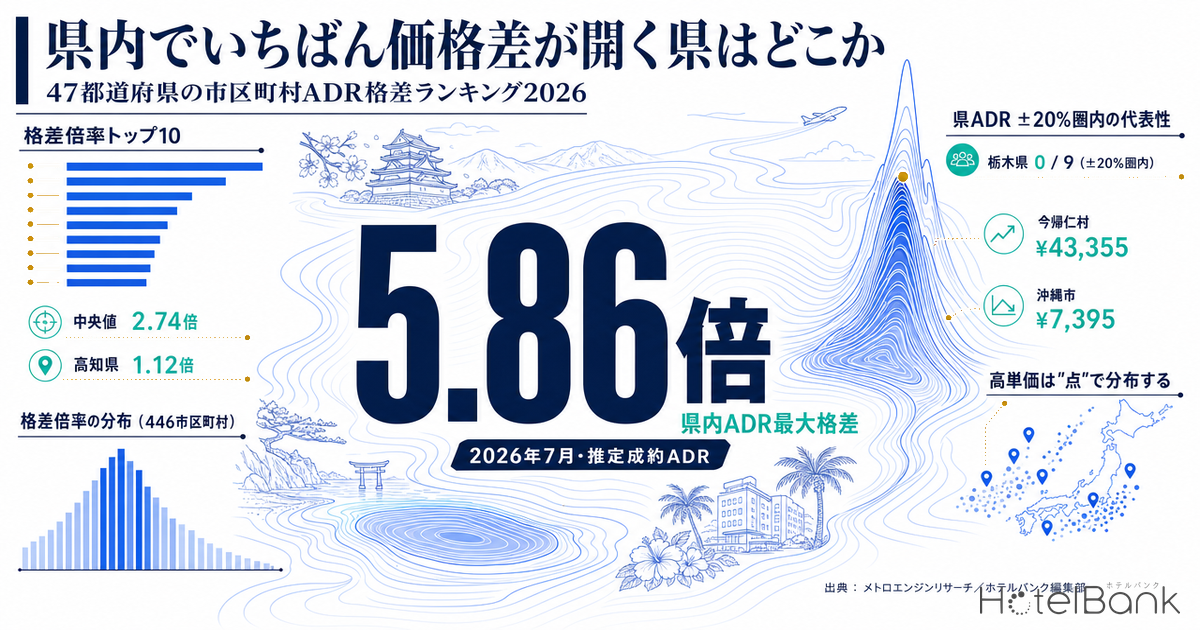
Prefecture-level hotel rates are the granularity most often used in industry reports and government statistics alike. But within a single prefecture, a resort inn and a business hotel in the prefectural capital are not selling in the same price band. Aggregating MetroEngines Research estimated transacted ADR (July 2026, a settled month) at the municipality level and computing, for each of the 47 prefectures, the multiple between its highest and lowest municipality, the spread ranged from 1.12x to 5.86x — a difference of more than five times between prefectures. This article examines, across all 47 prefectures side by side, where a prefectural average represents its market and where it does not.
Metric Definitions Used in This Article
- ADR (average daily rate): an estimated transacted rate (tax-exclusive equivalent) derived by applying category-specific adjustment coefficients to the lowest publicly listed plan level each property publishes on OTAs and similar channels (two guests per room, per-room rate, tax-inclusive). Cross-checked against property-level actuals disclosed by listed hotel REITs (April–May 2026, 184 property-months in total), the median error is 7.5%. These are estimates only and differ from each property’s actual transacted prices and accounting figures. Municipality-level and prefecture-level ADR is the median of the properties covered (the level of a typical property in that area).
- Property categories covered: estimated transacted ADR covers the five categories for which accuracy validation is complete — business hotels, city hotels, resort hotels, ryokan and capsule hotels. Pensions, minshuku, guesthouses and similar are excluded. The “listed price (average across all plans)” held in the same data platform covers all categories and therefore has a different scope; this article does not mix the two and uses estimated transacted ADR only.
- Intra-prefecture gap multiple: the estimated transacted ADR of the highest municipality in the prefecture ÷ that of the lowest municipality.
- Month covered: July 2026 (the latest month for which estimated transacted ADR is on a settled basis).
- Data source: MetroEngines Research
- — Median 2.74x — the intra-prefecture ADR gap multiple across all 47 prefectures (highest municipality ÷ lowest municipality). The widest is Okinawa at 5.86x, the narrowest Kochi at 1.12x.
- — Tochigi and Saga: zero — not a single municipality falls within ±20% of the prefectural ADR; the prefectural average sits in the valley between the high-rate band and the business-demand band.
- — Multiple and representativeness are different things — Osaka is in the top 10 at 3.78x, yet 9 of its 12 municipalities (75%) sit within ±20%. Only the two extremes are spread apart.
- — Threshold dependence comes from the extremes — raising the inclusion threshold from 5 to 20 properties narrows highest ÷ lowest from 3.26x to 2.10x, while P75 ÷ P25 moves only from 1.54x to 1.39x.
- — Correlation coefficient 0.52 — the number of qualifying municipalities and the multiple move together. The low multiples in prefectures with only 2–4 qualifying municipalities mainly reflect a small sample, not homogeneity.
Lined Up Across All 47 Prefectures, the “Standard” Intra-Prefecture Gap Is 2.7x
Because municipalities with few properties introduce noise, we excluded any municipality with fewer than 10 properties in the estimated transacted ADR calculation. A total of 446 municipalities nationwide met this threshold, covering 13,682 property-records. All 47 prefectures retained at least two municipalities, and 45 prefectures retained four or more.
Grouping these 446 municipalities by prefecture and taking the ratio of the highest to the lowest value, the median came to 2.74x. By quartile, the bottom 25% sit at or below 2.07x and the top 25% at or above 3.53x. In other words, “roughly a threefold gap between the most and least expensive area within a prefecture” is the standard picture of the Japanese hotel market. The dispersion around that standard is wide, however: three prefectures exceed 5x and ten fall below 2x, so a fair number of prefectures sit at either end. An analysis capturing the same two-pole structure from a different angle — municipality price range — is covered in Japan Intra-Prefecture ADR Gaps Reach 5.2x: 368 Municipalities Ranked (the month covered and the extraction threshold differ, so the level of the multiples is not directly comparable).
Source: MetroEngines Research; compiled by the HotelBank Editorial Team
The 10 Prefectures with the Widest Internal Gaps — Resort Clusters Lift the Rate Ceiling
The highest multiples were Okinawa at 5.86x, Chiba at 5.32x, Yamagata at 5.22x, Hyogo at 4.54x and Kyoto at 4.34x. What they share is a dual structure: resort and onsen destinations that are high-priced even by national standards, coexisting in the same prefecture with urban areas driven by business demand.
| Rank | Prefecture | Gap multiple | Highest municipality | Lowest municipality | Prefectural ADR | Municipalities covered |
|---|---|---|---|---|---|---|
| 1 | Okinawa | 5.86x | Nakijin Village ¥43,355 (N=21) | Okinawa City ¥7,395 (N=18) | ¥13,722 | 10 |
| 2 | Chiba | 5.32x | Kyonan Town ¥33,783 (N=10) | Ichihara City ¥6,354 (N=22) | ¥9,305 | 14 |
| 3 | Yamagata | 5.22x | Obanazawa City ¥35,057 (N=11) | Sakata City ¥6,710 (N=15) | ¥8,936 | 10 |
| 4 | Hyogo | 4.54x | Kobe Kita Ward ¥24,904 (N=41) | Asago City ¥5,480 (N=13) | ¥12,027 | 14 |
| 5 | Kyoto | 4.34x | Kyoto Ukyo Ward ¥25,666 (N=15) | Fukuchiyama City ¥5,917 (N=10) | ¥12,161 | 10 |
| 6 | Hiroshima | 4.08x | Hatsukaichi City ¥22,856 (N=34) | Mihara City ¥5,596 (N=18) | ¥8,562 | 9 |
| 7 | Kumamoto | 4.08x | Minamioguni Town ¥25,937 (N=47) | Yatsushiro City ¥6,350 (N=20) | ¥9,205 | 15 |
| 8 | Nagano | 4.02x | Karuizawa Town ¥24,726 (N=50) | Ina City ¥6,152 (N=14) | ¥11,052 | 22 |
| 9 | Osaka | 3.78x | Osaka Konohana Ward ¥17,932 (N=13) | Osaka Nishinari Ward ¥4,745 (N=32) | ¥8,761 | 12 |
| 10 | Hokkaido | 3.63x | Furano City ¥24,458 (N=13) | Muroran City ¥6,733 (N=15) | ¥12,156 | 23 |
Municipalities covered = the number of municipalities with 10 or more properties in the estimated transacted ADR calculation. Source: MetroEngines Research; compiled by the HotelBank Editorial Team
Source: MetroEngines Research; compiled by the HotelBank Editorial Team
In Okinawa, which tops the list, Nakijin Village stands at ¥43,400 — the highest level of any municipality in the country — while Okinawa City sits at just ¥7,400. The prefectural ADR is ¥13,700, but only three of the prefecture’s 10 qualifying municipalities are anywhere near that figure. A resort band running through Onna Village at ¥30,400, Chatan Town at ¥18,800 and Motobu Town at ¥18,200, and an urban band of Naha City at ¥10,100 and Okinawa City at ¥7,400, form entirely separate markets inside the same prefecture. Within Okinawa itself, that hierarchy divides further between the main island, Miyako and Ishigaki.
Source: MetroEngines Research; compiled by the HotelBank Editorial Team
Second-placed Chiba combines a resort band along the inner and outer Boso coasts with a business/airport band around Narita, Makuhari and the bay. Against Kyonan Town at ¥33,800, Kamogawa City at ¥23,500 and Katsuura City at ¥22,200 on the southern Boso side sit Narita City at ¥7,400 and Ichihara City at ¥6,400 — a wide spread on either side of the ¥9,300 prefectural ADR. In third-placed Yamagata, the outlier value of Obanazawa City at ¥35,100 pushed the multiple up. The onsen district within that city does not have a large number of properties, but a high-rate sales mix built around two-meal plans sets the prefecture’s ceiling. Given that the prefecture’s second-highest municipality, Nan’yo City, stands at ¥11,500, Yamagata’s gap is a single-point concentration rather than a high-rate area with real breadth — a different character from Okinawa or Chiba.
Hyogo and Kyoto are prefectures whose structure only becomes visible when designated cities are broken out by ward. In Hyogo, Kobe Kita Ward at ¥24,900 (which includes Arima Onsen) leads a broad high-rate band alongside Sumoto City at ¥24,400, Kami Town at ¥20,700 and Minamiawaji City at ¥20,700, while Himeji City at ¥6,900 and Asago City at ¥5,500 set the floor. In Kyoto, Kyoto Ukyo Ward at ¥25,700 was the highest, well above the central wards of Shimogyo at ¥11,800 and Nakagyo at ¥12,400. Even within the single municipality of Kyoto City, wards differ by more than a factor of two. For the same ward-level breakdown applied to Tokyo, see Tokyo Business Hotel ADR 12-Month Trend: 30% Central vs Outer Ward Gap.
Some Prefectures Have No Municipality Near Their Own Average — The Tochigi Case
Separately from the gap multiple, to measure how well a prefectural average represents reality we counted, for each prefecture, how many municipalities fall within ±20% of the prefectural ADR. The lower this share, the less the prefectural average describes any market inside the prefecture.
The most extreme case was Tochigi. The prefectural ADR is ¥9,600, but lining up the estimated transacted ADR of its nine qualifying municipalities produces a clean split — a resort band of Nasu Town at ¥17,900, Nikko City at ¥15,200 and Nasushiobara City at ¥12,500, and a business band of Utsunomiya City at ¥6,800, Sano City at ¥6,800, Oyama City at ¥6,300, Tochigi City at ¥6,000, Ashikaga City at ¥5,800 and Moka City at ¥5,700 — with not a single municipality in the ¥7,700–¥11,600 range (±20% of the prefectural ADR). The prefectural average falls squarely in the valley between the high and low sides.
Source: MetroEngines Research; compiled by the HotelBank Editorial Team
| Prefecture | Prefectural ADR | Municipalities within ±20% | Share | Gap multiple |
|---|---|---|---|---|
| Tochigi | ¥9,629 | 0 / 9 | 0% | 3.13x |
| Saga | ¥11,365 | 0 / 4 | 0% | 2.23x |
| Mie | ¥10,663 | 1 / 10 | 10% | 2.74x |
| Fukuoka | ¥10,873 | 1 / 8 | 12% | 2.74x |
| Hyogo | ¥12,027 | 2 / 14 | 14% | 4.54x |
| Gunma | ¥10,860 | 2 / 13 | 15% | 3.26x |
| Shizuoka | ¥12,687 | 4 / 23 | 17% | 3.58x |
| Kanagawa | ¥12,784 | 3 / 12 | 25% | 3.10x |
Number and share of municipalities within ±20% of the prefectural ADR (bottom 8 prefectures). Source: MetroEngines Research; compiled by the HotelBank Editorial Team
Saga is likewise 0 of 4, with its prefectural ADR of ¥11,400 wedged between an onsen band represented by Ureshino City at ¥18,700 and a business band represented by Saga City at ¥8,400. Mie follows at 1 of 10, Fukuoka at 1 of 8 and Hyogo at 2 of 14 — all prefectures where resort/onsen and business demand are clearly separated. Conversely, the highest shares within ±20% of the prefectural ADR are Kochi at 2 of 2, Shiga at 6 of 7, Aomori at 5 of 6, Miyazaki at 5 of 6 and Ibaraki at 8 of 10. In these prefectures, treating the prefectural average as a representative market figure is unlikely to be badly wrong.
| Prefecture | Prefectural ADR | Municipalities within ±20% | Share | Gap multiple |
|---|---|---|---|---|
| Kochi | ¥7,551 | 2 / 2 | 100% | 1.12x |
| Shiga | ¥8,122 | 6 / 7 | 86% | 1.49x |
| Aomori | ¥7,713 | 5 / 6 | 83% | 1.48x |
| Miyazaki | ¥6,498 | 5 / 6 | 83% | 2.98x |
| Ibaraki | ¥6,746 | 8 / 10 | 80% | 2.68x |
| Osaka | ¥8,761 | 9 / 12 | 75% | 3.78x |
Share of municipalities within ±20% of the prefectural ADR (top 6 prefectures). Source: MetroEngines Research; compiled by the HotelBank Editorial Team
What is interesting is that Osaka, despite ranking high with a gap multiple of 3.78x, has a within-±20% share of 75% (9 of 12). Its two extremes — Osaka Konohana Ward at ¥17,900 and Nishinari Ward at ¥4,700 — are indeed far apart, but the 10 areas in between cluster close to the prefectural ADR of ¥8,800. Judging from the multiple alone that “the prefectural average is unusable” would be premature; this case shows that the shape of the distribution has to be examined as well.
Prefectures with Narrow Gaps — Homogeneous Distribution, or Simply a Small Sample?
The 10 lowest multiples are Kochi at 1.12x, Aomori at 1.48x, Shiga at 1.49x, Tokushima at 1.50x, Ehime at 1.75x and Shimane at 1.77x. This needs careful interpretation, however. Because the multiple is computed from two extreme values — the highest and the lowest municipality in the prefecture — the fewer municipalities that survive the inclusion threshold, the lower the chance of drawing either tail, and the structurally smaller the multiple becomes.
In fact, the correlation coefficient between the number of qualifying municipalities and the gap multiple was 0.52. Among the low-multiple prefectures, Kochi has 2 qualifying municipalities and Nara likewise 2, while Wakayama, Tokushima, Saga and Saitama each cleared the threshold in only 4. For these prefectures it is not possible to read the result as “price bands within the prefecture are homogeneous.” By contrast, Aomori (6), Shiga (7), Shimane (7) and Ehime (5) came in below 2x while retaining a reasonable number of municipalities, and there the distribution itself can be read as narrow.
Source: MetroEngines Research; compiled by the HotelBank Editorial Team
| Rank | Prefecture | Gap multiple | Highest municipality | Lowest municipality | Prefectural ADR | Municipalities covered |
|---|---|---|---|---|---|---|
| 38 | Nara | 1.97x | Tenkawa Village ¥19,684 | Nara City ¥10,002 | ¥10,395 | 2 |
| 39 | Yamanashi | 1.96x | Fujikawaguchiko Town ¥15,388 | Kofu City ¥7,842 | ¥10,720 | 7 |
| 40 | Wakayama | 1.87x | Shirahama Town ¥14,703 | Wakayama City ¥7,883 | ¥9,218 | 4 |
| 41 | Yamaguchi | 1.87x | Hagi City ¥10,510 | Shunan City ¥5,615 | ¥7,190 | 7 |
| 42 | Shimane | 1.77x | Matsue City ¥11,243 | Hamada City ¥6,355 | ¥9,498 | 7 |
| 43 | Ehime | 1.75x | Matsuyama City ¥8,814 | Shikokuchuo City ¥5,047 | ¥6,702 | 5 |
| 44 | Tokushima | 1.50x | Miyoshi City ¥7,970 | Anan City ¥5,308 | ¥6,346 | 4 |
| 45 | Shiga | 1.49x | Nagahama City ¥10,086 | Takashima City ¥6,786 | ¥8,122 | 7 |
| 46 | Aomori | 1.48x | Aomori City ¥9,684 | Hirosaki City ¥6,551 | ¥7,713 | 6 |
| 47 | Kochi | 1.12x | Kochi City ¥7,230 | Shimanto City ¥6,448 | ¥7,551 | 2 |
Bottom 10 prefectures by gap multiple. Note that prefectures with few qualifying municipalities produce structurally smaller multiples. Source: MetroEngines Research; compiled by the HotelBank Editorial Team
Loosening the inclusion threshold from 10 properties to 5 raises the number of qualifying municipalities from 446 to 711 and lifts the median gap multiple from 2.74x to 3.26x. Chiba moved sharply from 5.32x to 7.44x, Nagasaki from 2.87x to 4.94x and Saitama from 2.44x to 4.47x. The looser the threshold, the more small high-rate areas enter the aggregation and the more the multiple inflates. Conversely, prefectures whose multiple barely moves when the threshold changes — Okinawa, Hyogo, Kyoto, Kumamoto and Nagano — can be taken as having a gap that exists as market structure rather than as an accident of a handful of properties.
On the Map — High-Rate Areas Are Points, Not Zones
Plotting the 446 municipalities on a map, colour-coded by estimated transacted ADR level, the dark shades above ¥20,000 appear as isolated pockets: northern Okinawa main island, southern Boso, inland Yamagata, the northern side of Rokko and Awaji, western Kyoto, the Aso area, Miyajima, Karuizawa and Furano. Within the area of a prefecture, high rates exist as points rather than as a continuous band.
Circle positions are representative points derived from the distribution of properties within each municipality. Source: MetroEngines Research; compiled by the HotelBank Editorial Team
This point-like character is what makes prefectural averages difficult to work with in practice. High-rate areas generally have few properties and account for a small share of rooms within the prefecture. Their rate level nonetheless reaches two to three times the prefectural average, so when a prefecture’s year-on-year ADR moves, the prefectural figure alone cannot separate whether the change came from the business band or the resort band.
When Practitioners Should Drop to Area Level
It is possible to draw a reasonably clear line between situations where a prefectural average works and situations that require going down to the municipality.
Where the prefectural average is sufficient.When comparing all 47 prefectures side by side to get a rough sense of ranking, or when reading the overall direction of a market in prefectures with a high within-±20% share (Kochi, Shiga, Aomori, Miyazaki, Ibaraki and the like), prefecture level is enough. The same applies when linking to government statistics: since the Japan Tourism Agency’s Overnight Travel Statistics Survey is published by prefecture, aligning at prefectural granularity makes reconciliation easier.
Where it is necessary to go down to the municipality.First, defining a competitive set. There is no point in a property in Tochigi measuring its position against a “prefectural average of ¥9,600.” For a property in Nasu Town the relevant benchmark is the ¥17,900 level; for one in Utsunomiya City it is ¥6,800. Second, initial screening for investment and development. Judging a project’s viability on prefectural ADR alone systematically biases the result — understating the resort band and overstating the business band. Third, interpreting year-on-year change. When a prefectural ADR rises, only an area breakdown reveals which layer drove it. Fourth, designing for demand periods. Peak days of the week and booking lead times differ between the resort band and the business band, so a prefecture-level seasonality curve ends up being a blend of the two.
The wider a prefecture’s internal gap, the more this distinction matters.In Okinawa, Chiba, Yamagata, Hyogo, Kyoto, Hiroshima, Kumamoto and Nagano — all above 4x in this aggregation — deliberately reducing the occasions on which the prefectural average is used on its own, and splitting the view into even just two segments, “resort band” and “business band,” changes the precision of decisions considerably.
How the Multiple Moves When the Threshold Changes — Three Thresholds and a 5×5 Sensitivity Test
The multiples in the main text use a threshold of 10 or more properties in the calculation. That threshold is an analytical choice, and changing it changes the result. Here we rebuild the same July 2026 estimated transacted ADR along two axes — the threshold and how the extremes are taken — to check how far the multiple depends on the threshold.No new forecasts or extrapolations are made. This simply recomputes the same metric on a different aggregation population.
| Minimum-property threshold | Municipalities covered | Properties covered | Median multiple | Prefectures above 5x | Prefectures below 2x | Prefectures with fewer than 2 qualifying municipalities |
|---|---|---|---|---|---|---|
| 5 or more properties (loose) | 711 | 15,445 | 3.26x | 3 | 6 | 0 |
| 10 or more properties (main-text threshold) | 446 | 13,682 | 2.74x | 3 | 10 | 0 |
| 20 or more properties (strict) | 224 | 10,632 | 2.10x | 0 | 17 | 6 |
Source: MetroEngines Research; compiled by the HotelBank Editorial Team
The stricter the threshold, the narrower the multiple. Restricting to 20 or more properties drops the median to 2.10x and eliminates the prefectures above 5x entirely, from three to none. At the same time, however, qualifying municipalities fall from 711 to 224, and six prefectures are left with fewer than two municipalities to compare. Tightening the threshold is not “raising precision” — it means excluding small high-rate areas from the analysis.
| Minimum-property threshold | Highest ÷ lowest | P90÷P10 | P75÷P25 | Highest ÷ median | Median ÷ lowest |
|---|---|---|---|---|---|
| 5 or more properties | 3.26x | 2.15x | 1.54x | 2.02x | 1.47x |
| 10 or more properties (main-text threshold) | 2.74x | 2.07x | 1.43x | 1.78x | 1.48x |
| 15 or more properties | 2.39x | 1.99x | 1.41x | 1.48x | 1.48x |
| 20 or more properties | 2.10x | 1.75x | 1.39x | 1.31x | 1.31x |
| 30 or more properties | 1.92x | 1.65x | 1.30x | 1.28x | 1.33x |
Each cell is the median of the multiples computed for each of the 47 prefectures. P90÷P10 and P75÷P25 cut the municipality ADRs within each prefecture at those percentiles. Source: MetroEngines Research; compiled by the HotelBank Editorial Team
Viewed along these two axes, the dependence on the threshold turns out to derive almost entirely from how the extremes are taken. Highest ÷ lowest moves 1.34 points, from 3.26x to 1.92x, whereas P75 ÷ P25 — which trims both tails — moves only 0.23 points, from 1.54x to 1.30x. This confirms that the property noted in the main text, that fewer qualifying municipalities produce structurally smaller multiples, reflects a change in the probability of drawing extreme values rather than a change in the distribution as a whole.
A second finding is an asymmetry between the upper and lower halves. At the main-text threshold (10 or more properties), highest ÷ median is 1.78x while median ÷ lowest is 1.48x — the intra-prefecture gap opens up more on the upper side than the lower. What pulls the prefectural average away from its municipalities is the outlying high-rate band rather than a collapse in the low-rate band, showing that the main text’s observation — resort clusters lift the rate ceiling — holds at the level of the national median as well.
Summary
Aggregating July 2026 estimated transacted ADR across 446 municipalities, the multiple between the highest and lowest area within a prefecture had a median of 2.74x, a maximum of 5.86x in Okinawa and a minimum of 1.12x in Kochi. Prefectures with large multiples share a common structure: a high-rate resort and onsen cluster coexisting with urban business demand inside the same prefecture.
There are also real cases in which the prefectural average represents no market within the prefecture at all. In Tochigi and Saga, not one municipality fell within ±20% of the prefectural ADR — the average lands in the valley between the high and low sides. Conversely, prefectures such as Osaka have a large multiple but a distribution clustered around the centre, so multiple and representativeness do not necessarily coincide.
At the same time, reading a prefecture with a small multiple as a “homogeneous market” is risky. The correlation coefficient between the number of qualifying municipalities and the multiple is 0.52, and prefectures with only 2–4 qualifying municipalities produce structurally smaller multiples. The low multiples in Kochi, Nara, Wakayama, Tokushima, Saga and Saitama most likely reflect a small sample rather than a homogeneous market. The prefectural average is best handled on the premise that being convenient and being accurate are two different things.
Note on the data:The estimated transacted ADR in this article is derived from prices published on OTAs and similar channels using category-specific adjustment coefficients. Cross-checking against property-level disclosures by listed hotel REITs (April–May 2026, 184 property-months in total) confirms a median error of 7.5%, but the figures differ from the actual transacted rates of individual municipalities and individual properties. Municipality coverage is also limited to areas with 10 or more properties in the estimated transacted ADR calculation; areas below that are not included in this article’s gap-multiple computation. Multiples under a looser threshold of 5 or more properties are also shown in the main text.
Related Reading
- Kagawa’s 16 Municipalities: 9.4x ADR Gap and Four Autumn Price Tiers
- Kanagawa Hotel Market 2026: Four Tiers and a ¥15,400 Autumn ADR Gap
- Chiba Settled ADR: H1 2026 Beats Last Year, July Turns -8.2%
- Why Taito Ward Has Tokyo’s Most Hotels: 403 Properties, Mid-Tier ADR
- Japan Intra-Prefecture ADR Gaps Reach 5.2x: 368 Municipalities Ranked
- Tokyo Business Hotel ADR 12-Month Trend: 30% Central vs Outer Ward Gap
References and Sources
■ Data sources
Estimated transacted ADR computed from OTA published prices collected by MetroEngines Research (July 2026, a settled month). 446 municipality-level areas (13,682 property-records in total) and 47 prefecture-level areas. Categories covered are the five for which accuracy validation is complete: business hotels, city hotels, resort hotels, ryokan and capsule hotels. The intra-prefecture gap multiples, the ±20% determinations and the sensitivity test are all computed from the same dataset.
■ Calculation assumptions
Intra-prefecture gap multiple = the estimated transacted ADR of the highest municipality in the prefecture ÷ that of the lowest. Municipalities are limited to areas with 10 or more properties in the estimated transacted ADR calculation (results at thresholds of 5 and 20 properties are shown alongside in the sensitivity test in the main text). The ±20% count is the number of municipalities falling between 0.8x and 1.2x of the prefectural ADR. The sensitivity-test percentiles (P90/P75/median/P25/P10) cut the municipality ADRs within each prefecture by linear interpolation, and include no forecasting or extrapolation.
■ Limitations and caveats
Estimated transacted ADR is an estimate; cross-checking against property-level disclosures by listed hotel REITs (April–May 2026, 184 property-months in total) gives a median error of 7.5%. It differs from the actual transacted rates of individual municipalities and properties. Because the multiple is computed from two extreme values, prefectures with fewer qualifying municipalities produce structurally smaller multiples (correlation coefficient between count and multiple: 0.52). Designated cities are aggregated by administrative ward, not as citywide values. This is a single-month cross-section (July 2026) and does not reflect seasonality.
■ Market data
- MetroEngines Research — Estimated transacted ADR (July 2026; 446 municipality-level areas covering 13,682 property-records; 47 prefecture-level areas)
■ Government statistics
- Japan Tourism Agency, “Overnight Travel Statistics Survey (May 2026 second preliminary figures; June 2026 first preliminary figures)”
- Japan Tourism Agency, “Overnight Travel Statistics Survey (April 2026 second preliminary figures; May 2026 first preliminary figures and 2025 annual figures (final))”
■ Further reading