

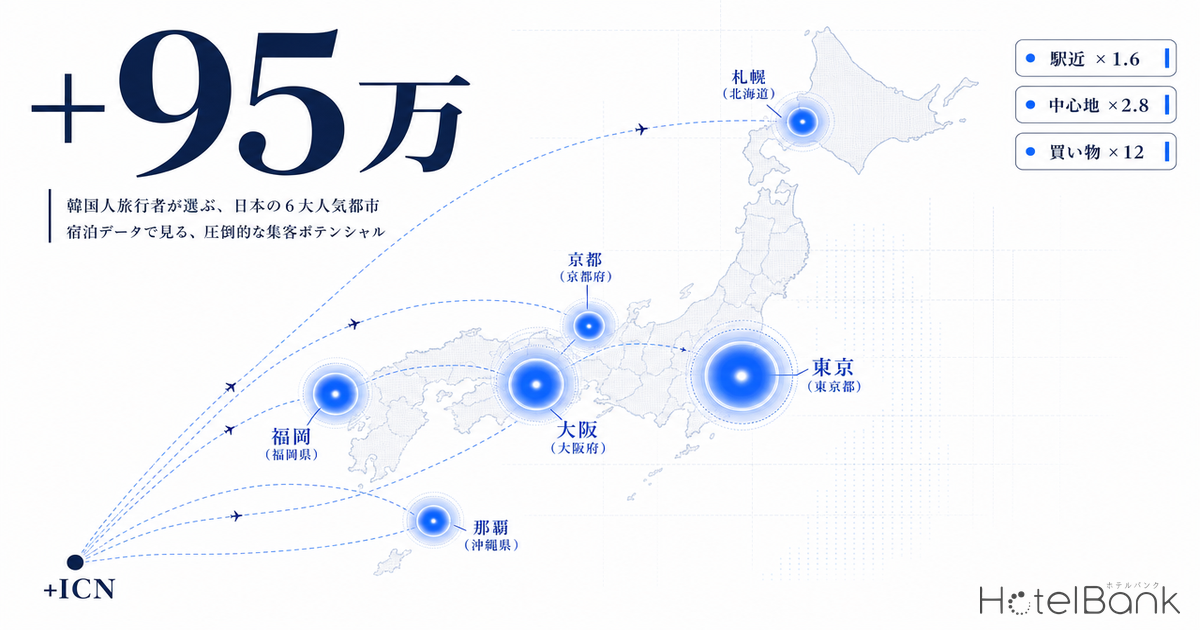
In May 2026, inbound visitors from South Korea reached a record high of 951,300, up +15.2% year-on-year — the highest single-month figure ever, per the Japan Tourism Agency / JNTO preliminary release. But the growth in headcount is not the only signal worth watching. Increased air capacity on Incheon–Kansai and Gimpo–Kansai, earlier vacation windows among university-age travelers, and a shift into what analysts are calling a “routinization phase” of Japan travel are all unfolding simultaneously. In this analysis, we take 28,000 Korean-language guest reviews aggregated by MetroEngines Research (2024–2026) and run them through fine-grained NLP tag analysis to visualize which hotels Korean guests are picking, and why — compared side-by-side with Japanese-language reviewer evaluation axes to surface the overindex gap.
Metric Definitions Used in This Article
- ADR (Average Daily Rate): Average of published OTA listing prices. Differs from actual booked rate (cross-checked against REIT disclosures, listed ADR runs +25–30% above transacted ADR). Rate per room for double occupancy (tax inclusive), averaged across all plans (room-only through half-board).
- Tag mention rate: Share of guest reviews in which any of 79 fine-grained tags (food / room / service / location / bath / facility / price / amenity / occasion) is mentioned. This is a mention-frequency metric, not a star score.
- Overindex (KR ÷ JA): Korean-guest mention rate divided by Japanese-guest mention rate. 1.0 = parity, 2.0 = Korean guests mention it 2× as often, 12.0 = 12× as often. Surfaces evaluation axes that are distinctively Korean.
- Data source: MetroEngines Research (NLP analysis, tag aggregation from guest reviews, compiled by HotelBank Editorial Team)
- — Inbound visitors from Korea hit an all-time-high 951,000 in May 2026 (+15.2% YoY). Korean-language reviews concentrate in three regions: Hokkaido, Tokyo, and Fukuoka.
- — In Tokyo, Osaka, and Fukuoka, “Shopping Location” overindexes at ×12 or more. Retail access has become a primary driver of hotel choice.
- — Kyoto stands out with a “Japanese Breakfast” overindex of ×15.58. Serving washoku breakfast has crystallized as a Korean-facing differentiation lever.
- — Hokkaido shows “general Location” ×26.5 and “Friendly Service” ×14.1. Abstract, resort-flavored praise dominates.
- — Absolute mention rates on language-support tags stay in the low single-digit % range — language support has become a necessary condition, no longer a differentiator.
Where the 951K Cluster — 6 Areas Where Korean Guests Concentrate
Of the 951,000 Korean visitors in May 2026, lodging data points to six areas absorbing the bulk of demand: Tokyo, Osaka, Fukuoka, Hokkaido, Okinawa, and Kyoto. Across the ~27,000 hotels MetroEngines Research tracks with confirmed occupancy, aggregating the sample of Korean-language reviews over the trailing 24 months by region yields Hokkaido (N=7,547), Tokyo (N=6,464), and Fukuoka (N=5,836) at the top. Fukuoka’s parity with Tokyo reflects its within-2-hour flight proximity from Busan and Seoul.
May 2026 ADR (Average Daily Rate) is also being pushed up in each area. Kyoto is +24.7% YoY (¥47,300), Hokkaido +10.7% (¥30,400), and Okinawa +9.1% (¥28,100) — the more Korean-concentrated the area, the sharper the price move. Tokyo, by contrast, is only +4.7%: headcount growth alone doesn’t guarantee per-room upside, and the ability to lift ADR varies significantly by region. For a companion read on what’s driving Kyoto / Hokkaido / Okinawa ADR upward, our analysis of long-staying Singaporean demand adds a stereoscopic view: Singapore Inbound Summer 2026 — 7–8-Night Stays and High-ADR Condominium Demand Lifting Kyoto / Hokkaido / Okinawa.
Source: MetroEngines Research, compiled by HotelBank Editorial Team (Korean-language reviews N=28,005, trailing 24-month aggregation)
The Overindex View — What Korean Guests Weigh Differently
Calculating the “overindex” as Korean-guest mention rate divided by Japanese-guest mention rate makes it possible to see, in three dimensions, what repeat-phase Korean visitors are prioritizing when they book a hotel. Taking Tokyo as an example, the location-family tag “Central Access” runs at 20.95% mention rate among Korean guests versus 7.52% among Japanese guests — an overindex of ×2.79. “Tourist-Attraction Access” comes in at ×2.50, and “Shopping Location” exceeds ×12. Meanwhile, “Station Proximity,” “Room Cleanliness,” and “Staff Politeness” — which Japanese guests weight comparably — show mention rates in near-parity, and can be classified as “shared evaluation axes.”
Source: MetroEngines Research NLP analysis, compiled by HotelBank Editorial Team (Tokyo: Korean N=6,464, Japanese N=197,169, trailing 24-month aggregation)
What stands out for Kyoto is that “Japanese Breakfast” hits an overindex of ×15.58. For Japanese guests, washoku breakfast is a default and rarely surfaces in reviews — but for Korean guests, “does this hotel serve a proper Japanese breakfast?” has become a differentiating criterion. Conversely, Osaka’s “Executive Lounge” runs ×12.44 and Hokkaido’s “general Location” hits ×26.48 — meaning the highest-overindex axes shift meaningfully by region. This tells us Korean guests are switching evaluation frames based on the “visit purpose × area” combination.
Area-by-Area Map of Korean-Specific Evaluation Axes
For each of the six areas, we extracted the fine-grained tags with the highest Korean-guest overindex and summarized them in the table below. While location- and central-access-family indexes run high across the board, the region-specific signatures — Kyoto’s “Japanese Breakfast,” Osaka’s “Lounge,” Hokkaido’s “Friendly Service,” Okinawa’s “Room Datedness (negative)” — split clearly.
| Area | Korean-guest N | May 2026 ADR YoY | Top Overindex Tags |
|---|---|---|---|
| Tokyo | 6,464 | +4.7% | Shopping Location ×12.2 / Onsen Bath ×11.7 / Central ×2.79 |
| Osaka | 4,259 | +6.2% | Executive Lounge ×12.4 / Shopping Location ×11.9 / Central ×3.10 |
| Kyoto | 1,578 | +24.7% | Japanese Breakfast ×15.6 / Bed Comfort ×12.3 / Central ×2.33 / Onsen Bath ×2.16 |
| Hokkaido | 7,547 | +10.7% | General Location ×26.5 / Friendly Service ×14.1 / Central ×1.61 |
| Okinawa | 2,321 | +9.1% | Room Datedness ×12.9 (neg.) / Tourist Attraction ×1.57 / Breakfast Buffet ×1.31 |
| Fukuoka | 5,836 | +7.1% | Shopping Location ×12.1 / Bed Comfort ×11.0 / Breakfast Value ×9.98 / Central ×2.64 |
Source: MetroEngines Research NLP analysis, compiled by HotelBank Editorial Team
The fact that Tokyo, Osaka, and Fukuoka all show “Shopping Location” at ~×12 overindex suggests that repeat-phase Korean guests are increasingly baking “retail access” — rather than “sightseeing access” — into their hotel selection logic. Meanwhile, Hokkaido’s “general Location” overindex of ×26.5 reflects Korean travel patterns that span multiple areas (Niseko, Otaru, etc.), where the “location is good” praise is abstract and cross-area rather than site-specific.
English / Multilingual Support Tag Overindex — How Repeat Korean Guests Rate Language Capability
The hypothesis “Korean guests pick hotels based on Korean-language support” is only partially borne out by the data. On the staff-English-support tag overindex, the top-ranked properties are hotels near Narita and Kansai international airports (Narita Tobu Hotel Airport, Hotel Nikko Narita) and mid-range city hotels in central Tokyo (Hotel Sunroute Plaza Shinjuku, the Kyo-machiya inn Sakura Urushi-tei). On the staff_multilingual (multilingual support) tag, Tokyu Stay Fukuoka Tenjin stands out — showing that in Fukuoka, a short-haul repeat market, “multilingual” beats “just able to communicate the basics” as the evaluated attribute.
Note, however, that the absolute mention rates for staff_english and staff_multilingual tags themselves stay in the low single-digit % range. Korean guests rarely reference “language support” directly in reviews — the evaluation is folded implicitly into general tags like “Location,” “Central Access,” and “Staff Politeness.” In other words, language support has become a necessary condition, no longer a differentiator. For a deeper dive on how popular Tokyo hotels score across languages, see: Tokyo Popular Hotels — Language-by-Language Review Score Gap Analysis.
Source: MetroEngines Research NLP analysis, compiled by HotelBank Editorial Team (top tags across 4 languages, Tokyo, trailing 24-month aggregation)
Placing tag mention rates for the four language groups in Tokyo side by side, the English-speaking and Korean guest evaluation axes track quite closely (weighting Central, Tourist Attraction, and Room Size). Traditional-Chinese speakers (Taiwan / Hong Kong) mirror the Korean pattern with “Shopping Location” also at ~×12 overindex — surfacing a common pattern: “East Asian kanji-sphere guests optimize for retail flow; English-speakers optimize for sightseeing flow.” Only Japanese guests give relatively more weight to “quality for the price.”
Operator-Side Whitespace Opportunities
The data surfaces three operational upsides for capturing the repeat Korean traveler segment.
1. Make the shopping route explicit (Tokyo, Osaka, Fukuoka) — Move “N-minute walk to the main shopping street” ahead of “N-minute walk to the tourist attraction” on hotel-direct and OTA property descriptions. The ×12 overindex means the demand is measurably there; even wording tweaks in plan names and descriptions could unlock upside.
2. Amplify Kyoto’s Japanese-breakfast plans — Kyoto’s washoku-breakfast overindex of ×15.58 signals that “the hotel serves a Japanese breakfast” is itself a differentiation asset for Korean guests. Adding multilingual signaling elements (“Japanese Breakfast,” “Wa no Asa” / Japanese-morning branding) to plan names is worth testing.
3. Lean into Friendly Service in Hokkaido and Okinawa — Hokkaido’s staff_friendly overindex of ×14.10 and Okinawa’s staff_courteous overindex of ×1.53 show that “approachable, warm service” registers cleanly with Korean guests in resort settings. Branding “polite” and “friendly” as separate evaluation axes — rather than collapsing them — is likely effective.
About the data in this article: Based on NLP tag analysis of approximately 28,005 Korean-language guest reviews (trailing 24 months, six-area aggregation). Korean guest hotel selection operates in a two-layer structure — “unmentioned but necessary” attributes and “actively mentioned differentiators” — and this article visualizes the overindex distribution of the latter. Occupancy and transacted-price data are not included; operational improvements rest on the hotel side’s own strategic judgment.
Related Reading
- Tokyo Popular Hotels — Language-by-Language Review Score Gap Analysis: How Japanese and Inbound Evaluation Axes Diverge
- Singapore Inbound Summer 2026 — 7–8-Night Stays and High-ADR Condominium Demand Lifting Kyoto / Hokkaido / Okinawa
- Hotel Dining for Anniversaries — Tokyo / Osaka / Nagoya Luxury Hotel Restaurant Review Ranking
References and Sources
■ Market Data
- MetroEngines Research — Guest review NLP analysis (Korean N=28,005 / Japanese N=691,561 / English & Traditional-Chinese N=large samples, trailing 24-month aggregation, compiled by HotelBank Editorial Team)
- MetroEngines Research — OTA published-price data (six-area May 2026 ADR aggregation)
■ Government Statistics / Public Data
- JNTO “Inbound Visitor Statistics (May 2026 Preliminary)” — Korean visitors 951,300, +15.2% YoY, all-time high
- JNTO Korea Market Information
■ Industry Reports
- [Chart] Inbound Visitors to Japan in May 2026 Down 3.6% YoY — 2nd Consecutive Month of Decline, but 19 Markets Post All-Time-High Monthly Records (Travel Voice)
- May 2025 Inbound Visitor Count Exceeded 3.6 Million Even in the Off-Peak — Korea Cumulative Breaks 4 Million (Yamatogokoro.jp)
- 2025 Inbound Annual Trends and 2026 Forecast (Aun Consulting) — “Routinization of Japan travel” for Korea and Taiwan; “premiumization” for Western markets