

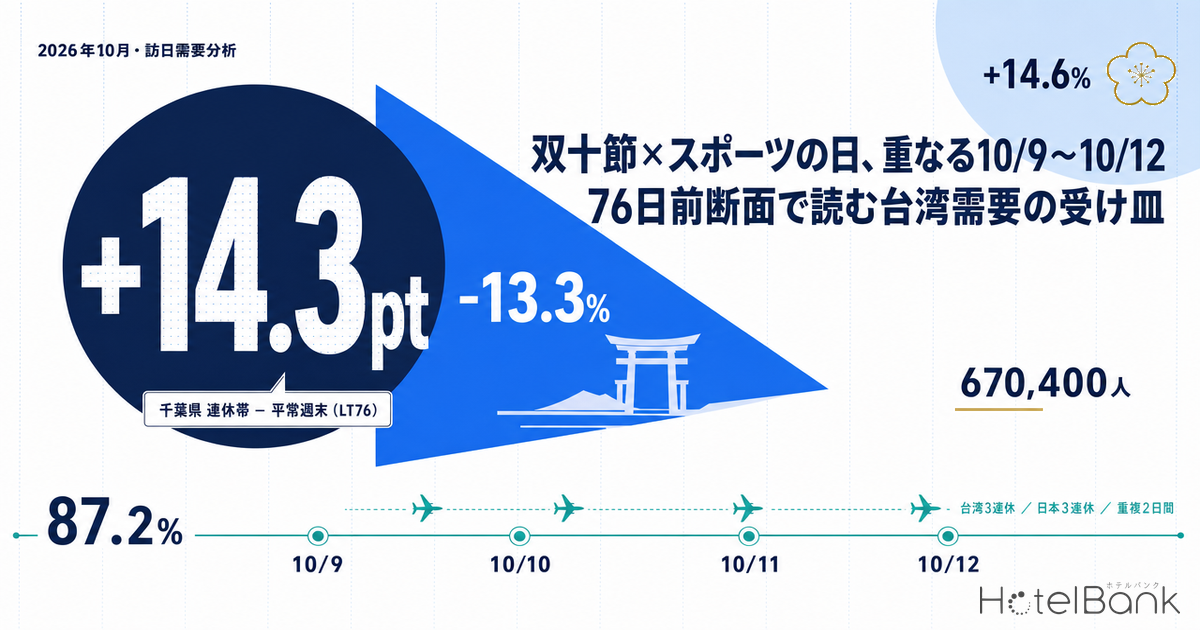
Taiwan’s National Day (Double Ten Festival) falls on Saturday, October 10 in 2026. According to the official 2026 government office calendar published by Taiwan’s Directorate-General of Personnel Administration, because October 10 lands on a Saturday, Friday October 9 becomes a compensatory holiday, giving Taiwan a three-day weekend from Friday October 9 to Sunday October 11. Japan, meanwhile, observes Sports Day on the second Monday of October — October 12 — producing a three-day weekend from Saturday October 10 to Monday October 12. The two countries’ holidays overlap on October 10 and 11, and across the full window October 9-12 forms a four-day band of concentrated demand.
According to Japan National Tourism Organization (JNTO) estimates, 670,400 visitors arrived from Taiwan in June 2026, up 14.6% year on year and a record high for the month of June. That growth came even as total inbound arrivals fell to 3,148,600, down 6.8% year on year and below the prior year for a third consecutive month. This article examines how much capacity each area has prepared for the October holiday window, reading it from two angles: inventory absorption compared at a matched lead time, and the evaluation criteria that surface in guest reviews written by Taiwanese visitors.
Metric Definitions Used in This Article
- OCC (Occupancy Rate): The share of rooms sold against total rooms in the area (an estimate based on OTA-listed inventory). It is derived from how listed inventory is absorbed on OTAs and differs from each property’s actual occupancy. Used only as a prefecture-level macro aggregate.
- LT (Lead Time): Days remaining until check-in. LT0 = same day. Whenever different check-in dates are compared, the comparison is always made at the same LT cross-section (i.e. the same number of days out).
- Listed Price: The average of prices listed on OTAs for the given check-in date. Per-room rate for double occupancy (tax included), averaged across all plans (room-only through meal-inclusive). It differs from the price actually transacted.
- ADR (Average Daily Rate): An estimated settled rate (tax-exclusive equivalent) calculated by applying category-specific adjustment coefficients to the lowest plan level each property publishes on OTAs (per-room rate for double occupancy, tax included). Cross-checked against property-level results disclosed by listed hotel REITs, the median error is roughly 7%. It is an estimate and differs from each property’s actual transacted prices and accounting figures. Area-level ADR is the median across the covered properties.
- Observed Properties: The number of properties for which inventory could be observed at each LT cross-section. Because it varies by cross-section, this article states it alongside every data point.
- Data Source: MetroEngines Research
- — October 9-12: Taiwan’s National Day break (Oct 9-11) and Japan’s Sports Day break (Oct 10-12) overlap on October 10 and 11, stretching the band of concentrated demand to four days.
- — +14.3pt: Niigata’s estimated occupancy of 87.2% for October 10 exceeds the 72.9% of the normal weekend of October 17 — the widest gap among the 12 areas (for stays on October 10, 2026, measured 76 days out). Shizuoka (+11.5pt) and Kanagawa (+9.4pt) follow.
- — +0.2pt/-2.3pt: Tokyo and Osaka show almost no gap between the holiday window and a normal weekend; the larger the urban market, the more room remains in both inventory and price.
- — 34〜42%: In Traditional Chinese reviews, the mention rate for “proximity to the station and transport convenience” runs 11-19pt above Japanese-language reviews. What capacity requires: clarity of location, room space, and a price that feels justified.
- — Friday, October 9: On the one day only Taiwan is on holiday, occupancy sits below Saturday the 10th across all 12 areas and listed prices are lower — leaving the widest room to design pre-night and multi-night stays.
October 2026: Taiwanese and Japanese Holidays Overlap for Two Days
Start with the calendar. On the Taiwanese side, because National Day (October 10) falls on a Saturday, Friday October 9 becomes a compensatory holiday, producing a three-day break from the 9th to the 11th. On the Japanese side, Sports Day falls on Monday October 12, producing a three-day break from the 10th to the 12th. The two countries’ holidays coincide exactly on Saturday October 10 and Sunday October 11, with one Taiwan-only holiday (Friday, October 9) extending before it and one Japan-only holiday (Monday, October 12) extending after it.
| Date | Day | Taiwan | Japan | Overlap |
|---|---|---|---|---|
| October 9 | Fri | Holiday (National Day compensatory) | Weekday | Taiwan only |
| October 10 | Sat | National Day | Holiday (Saturday) | ◎ Overlap |
| October 11 | Sun | Holiday | Holiday | ◎ Overlap |
| October 12 | Mon | Weekday | Sports Day | Japan only |
Source: Compiled by the HotelBank Editorial Team from the Directorate-General of Personnel Administration’s 2026 government office calendar and the Cabinet Office’s “National Holidays” notice
What this structure implies is that the demand peak is not a simple “Saturday-Sunday” but stretches across four days, from Friday (Oct 9) to Monday (Oct 12). Friday October 9 in particular is an ordinary weekday for Japan while being the first day of the break for Taiwan. It is an easy day for travelers from Taiwan to arrive on a Friday flight and spend the weekend in Japan. Overseas demand loads onto a day of the week that does not compete head-on with Japanese domestic demand — this asymmetry is the starting point for reading the whole window.
A +14.6% Tailwind from Taiwan, and Where October Rates Stand
JNTO estimates put June 2026 inbound arrivals at 3,148,600, down 6.8% year on year. With arrivals from China at 340,700 (-57.3%) dragging the total down, Taiwan grew 14.6% year on year to 670,400 — a record high for June. South Korea at 787,100 (+7.8%) and Hong Kong at 214,300 (+28.5%) also grew, so within the Greater China and short-haul East Asian markets, Taiwan and Hong Kong are clearly on an upward trend. First-half arrivals totaled 21,084,800, down 2.0% year on year. With China’s slowdown continuing, Taiwan is functioning as one of the steadier pillars of inbound demand.
So where do rates stand on the receiving end of that tailwind? Comparing estimated settled ADR for October 2026 with the same month a year earlier, the picture splits sharply by area.
Source: Compiled by the HotelBank Editorial Team from MetroEngines Research
| Area | Oct 2025 ADR | Oct 2026 ADR | YoY | N (Oct 2026) |
|---|---|---|---|---|
| Fukuoka | ¥11,200 | ¥14,700 | +30.6% | 447 properties |
| Hokkaido | ¥9,700 | ¥12,600 | +29.9% | 846 properties |
| Chiba | ¥9,500 | ¥12,200 | +29.0% | 369 properties |
| Tokyo | ¥15,600 | ¥18,800 | +20.0% | 1,046 properties |
| Okinawa | ¥10,900 | ¥12,600 | +16.0% | 495 properties |
| Kyoto | ¥19,200 | ¥21,500 | +11.6% | 543 properties |
| Shizuoka | ¥12,600 | ¥13,500 | +7.0% | 774 properties |
| Osaka | ¥13,400 | ¥11,600 | -13.3% | 612 properties |
Source: Compiled by the HotelBank Editorial Team from MetroEngines Research (October 2025 is on a completed-month basis; October 2026 is an estimate based on listed levels as of the survey date)
Fukuoka, Hokkaido and Chiba have lifted their levels sharply by 29-31%, while Osaka is the only one of the eight areas to decline, down 13.3% year on year. October 2025 fell within the Expo 2025 Osaka, Kansai period, when rate levels were exceptionally high, so this reads as the payback phase. Turned around, that makes Osaka this October the area with the widest room to absorb demand on price. For travelers from Taiwan, Kansai International Airport is a gateway with a dense direct-flight network, and settled rates make it easier for stays to lengthen or for the city to serve as a base for wider touring.
Matching Lead Times: The Gap Between the Holiday Window and a Normal Weekend
From here we look at how inventory is being absorbed. The method of comparison requires care. When comparing two different check-in dates, lining up data observed on the same day makes October 10 look further along simply because it is closer in time. That mixes the holiday effect with the passage of time. This article therefore uses cross-sections matched on LT (lead time) — that is, both are compared at the point 76 days before check-in. LT76 for October 10 corresponds to observations on July 26; LT76 for October 17 corresponds to August 2. The same approach of matching lead times to compare a special date against a normal weekend was used in Awaodori 2026: 98.8% Sold 45 Days Out — 39.4pt Over Normal Weekends, where a 39.4pt gap was confirmed at the 45-days-out fixed point.
Source: Compiled by the HotelBank Editorial Team from MetroEngines Research
The results split clearly by area. Niigata’s estimated occupancy for October 10 is 87.2% (for stays on October 10, 2026, measured 76 days out), 14.3pt above the 72.9% of October 17, a normal weekend. Shizuoka (+11.5pt) and Kanagawa (+9.4pt) follow. Tokyo, by contrast, shows almost no gap at +0.2pt, while Osaka (-2.3pt) and Aichi (-5.4pt) are actually further along on the normal weekend. A three-day weekend does not tighten inventory uniformly across the country — an obvious fact, but one the numbers confirm.
Source: Compiled by the HotelBank Editorial Team from MetroEngines Research
Laid out across the 12 areas, the cross-sections look as follows. All are like-for-like comparisons matched at LT76, with the number of observed properties stated alongside.
| Area | Total rooms | Oct 9 (Fri) | Oct 10 (Sat) | Oct 11 (Sun) | Oct 17 (Sat) | 10/10−10/17 | Oct 10 listed price | Observed Properties |
|---|---|---|---|---|---|---|---|---|
| Niigata | 24,266 rooms | 68.0% | 87.2% | 83.7% | 72.9% | +14.3pt | ¥33,500 | 339〜408 |
| Shizuoka | 47,865 rooms | 65.5% | 78.6% | 71.4% | 67.1% | +11.5pt | ¥43,500 | 883〜1064 |
| Kanagawa | 48,389 rooms | 64.5% | 75.3% | 68.1% | 65.9% | +9.4pt | ¥51,300 | 483〜592 |
| Kyoto | 53,357 rooms | 76.8% | 82.2% | 77.4% | 78.0% | +4.2pt | ¥54,900 | 812〜891 |
| Saitama | 17,297 rooms | 68.0% | 76.0% | 70.3% | 72.4% | +3.6pt | ¥25,200 | 146〜200 |
| Okinawa | 52,936 rooms | 73.7% | 76.0% | 71.9% | 73.4% | +2.6pt | ¥34,400 | 887〜1024 |
| Hokkaido | 93,418 rooms | 71.1% | 76.2% | 70.9% | 73.9% | +2.3pt | ¥30,900 | 979〜1173 |
| Tokyo | 181,911 rooms | 68.4% | 72.8% | 71.6% | 72.6% | +0.2pt | ¥45,300 | 1006〜1225 |
| Nagano | 37,360 rooms | 69.4% | 75.4% | 71.0% | 76.0% | -0.6pt | ¥36,400 | 921〜1057 |
| Hyogo | 35,063 rooms | 70.7% | 73.0% | 70.2% | 73.9% | -0.9pt | ¥41,600 | 613〜700 |
| Osaka | 110,659 rooms | 65.4% | 68.3% | 66.2% | 70.6% | -2.3pt | ¥28,200 | 511〜677 |
| Aichi | 54,137 rooms | 70.3% | 74.2% | 71.9% | 79.6% | -5.4pt | ¥29,300 | 398〜463 |
Source: Compiled by the HotelBank Editorial Team from MetroEngines Research (all at the 76-days-before-check-in cross-section; observed properties shown as the min-max across the four dates)
What matters here is that the number of observed properties moves from cross-section to cross-section. Niigata, for example, ranges from 339 to 408 properties and Osaka from 511 to 677. Because thin cross-sections make figures volatile, this article uses estimated occupancy as its primary metric and avoids the more variable sell-out measures. Occupancy values themselves are nearly identical across the three cross-sections from LT78 to LT76 (Kyoto, October 10: 82.3% → 82.0% → 82.2%), so bias from the choice of cross-section is judged to be small.
Friday, October 9: The One Day Only Taiwan Is on Holiday
Lining up the four days of the window reveals a second structure. Occupancy on Friday October 9 sits below Saturday October 10 in all 12 areas. The widest gap is Niigata at 19.2pt, followed by Shizuoka at 13.1pt and Kanagawa at 10.8pt. Because Japanese domestic leisure demand concentrates on Saturday, inventory remains on Friday — in itself an entirely ordinary day-of-week structure.
Source: Compiled by the HotelBank Editorial Team from MetroEngines Research
In 2026, however, that Friday happens to be the first day of Taiwan’s break. It is a day on which overseas demand alone may rise on a weekday when Japanese domestic demand is thin. Listed prices tell the same story: October 9 sits well below October 10. Kyoto is ¥39,500 against ¥54,900 on the 10th, Kanagawa ¥35,500 against ¥51,300, and Niigata ¥22,700 against ¥33,500. On Friday, both inventory and price still leave room to move。
This can also be read as room to design for pre-night demand. For a property that starts receiving domestic guests from Saturday October 10, the preceding Friday the 9th is normally a day when both rate and occupancy drop. If arrivals on the first day of Taiwan’s break land on that day, product design around two- or three-night stays that include the Friday, or stay proposals anchored on a Friday check-in, may work well. Multi-night stays lower the acquisition cost per night while aligning naturally with departure dates set around Sunday return flights.
What Guests from Taiwan Write About Their Stays
A second axis for gauging strength as a destination is what people who actually stayed chose to praise. The HotelBank Editorial Team aggregated guest reviews from the past 24 months and broke them down by the language they were written in to compare mention patterns. Note that a review’s language is the language it was written in, not the nationality of the person who wrote it. Please read the following as descriptive tendencies that appear frequently in reviews written in Traditional Chinese.
Source: HotelBank Editorial Team analysis (NLP analysis of guest reviews over the past 24 months; Traditional Chinese N=53,526 / Japanese N=968,166)
The clearest tendency is the sheer weight of mentions of location and transport convenience. The share of comments touching on “proximity to the station and transport convenience” reaches 41.6% in Tokyo, 41.1% in Kyoto, 35.1% in Osaka and 34.6% in Kanagawa among Traditional Chinese reviews — 11-19pt above Japanese-language reviews for the same areas (Tokyo 25.9%, Kyoto 22.6%, Osaka 24.3%, Kanagawa 18.4%). Mentions of “close to the city center or entertainment district” follow the same pattern: in Tokyo, 25.7% in Traditional Chinese against 6.6% in Japanese, a gap of 19.1pt.
| Area | Station proximity / transport | Proximity to city center | Room spaciousness | Traditional Chinese N | |||
|---|---|---|---|---|---|---|---|
| Trad. Chinese | Japanese | Trad. Chinese | Japanese | Trad. Chinese | Japanese | ||
| Tokyo | 41.6% | 25.9% | 25.7% | 6.6% | 16.6% | 9.0% | 15,908 |
| Kyoto | 41.1% | 22.6% | 23.1% | 6.7% | 19.6% | 11.4% | 5,022 |
| Osaka | 35.1% | 24.3% | 26.3% | 6.9% | 18.4% | 10.4% | 8,913 |
| Kanagawa | 34.6% | 18.4% | 16.6% | 4.8% | 20.3% | 10.7% | 2,123 |
| Hokkaido | 26.8% | 14.3% | 16.6% | 5.3% | 18.7% | 10.9% | 9,950 |
| Niigata | 29.9% | 14.9% | 10.5% | — | 15.6% | 9.0% | 918 |
| Shizuoka | 22.3% | 9.5% | 10.0% | — | 21.8% | 10.4% | 1,416 |
| Okinawa | 21.5% | 8.4% | 22.7% | 8.9% | 22.9% | 12.5% | 9,276 |
Source: HotelBank Editorial Team analysis (past 24 months; mention rates by language written. “—” indicates the item did not rank in the top 25 for Japanese-language reviews). Figures are mention frequencies, not evaluation scores
Mentions of room spaciousness likewise appear 1.7-2.1 times as often in Traditional Chinese reviews as in Japanese ones across the board: Okinawa 22.9% (Japanese 12.5%), Shizuoka 21.8% (10.4%), Kanagawa 20.3% (10.7%). Rather than the absolute floor area of the room, this likely reflects that “spaciousness” is simply the vocabulary more readily chosen when describing satisfaction. The same holds for value for money: Traditional Chinese reviews run 3-5pt above Japanese ones, at 18.7% in Shizuoka, 17.3% in Niigata and 16.7% in Osaka.
The picture of what capacity means here is clear: properties with unambiguous access from the station and city center, a degree of space in the rooms, and a price that feels justified — that combination is the one guests from the Traditional Chinese-speaking world tend to rate highly. Put the other way, stating information in multiple languages — the route from the station, travel time to the city center, room floor area — translates directly into appeal at the consideration stage. How far evaluation criteria differ by language is also examined at the property level in Tokyo Hotel Review Gap by Language: How Japanese vs Inbound Guests Differ.
Where Capacity Still Remains
Overlaying the two axes covered so far — inventory headroom during the holiday window, and fit with the criteria that surface in Traditional Chinese reviews — brings each area’s position into focus.
Source: Compiled by the HotelBank Editorial Team from MetroEngines Research
Tokyo and Osaka show almost no difference in inventory absorption between the holiday window and a normal weekend. At 76 days before check-in, Tokyo stands at 72.8% occupancy (for stays on October 10, 2026) and Osaka at 68.3%, both on the lower side among the 12 areas. They are also large in scale, at 181,911 rooms in Tokyo and 110,659 in Osaka. At the same time, these two are top-tier in mention rates for station proximity and city-center access in Traditional Chinese reviews. In other words, they hold the elements travelers from Taiwan value most while still having inventory to spare. As noted above, Osaka’s rate levels have also settled from a year earlier, leaving wide room to absorb demand on both price and inventory.
Hokkaido and Okinawa show a mild holiday effect of around +2 to +3pt, with occupancy near 76% (for stays on October 10, 2026, measured 76 days out). In Hokkaido, Traditional Chinese reviews mention “breakfast buffet” at 12.2% (Japanese 8.9%), “onsen / large public bath” at 14.1% (11.2%) and “room view” at 13.1% (6.9%) — food, hot springs and scenery all discussed more often than in Japanese reviews. October in Hokkaido is the season for autumn foliage and food, and product messaging for this period overlaps readily with what interests the Traditional Chinese-speaking market. Okinawa is distinguished by items such as “room spaciousness” at 22.9% and “parking” at 10.1%, giving it a strong affinity with stay-based demand that assumes a rental car.
Kanagawa sits on the tightening side at +9.4pt during the holiday window, but its October 17 occupancy of 65.9% (for stays on October 17, 2026, measured 76 days out) is the lowest of the 12 areas, so room remains outside the window itself. Adjacent to Tokyo and well placed to catch circulation from the capital, it also scores high at 34.6% for station-proximity mentions in Traditional Chinese reviews. Fukuoka, meanwhile, which has a dense direct-flight network from Taiwan, shows the largest October increase in estimated settled ADR among the eight areas at +30.6% year on year — a phase in which the depth of demand is beginning to show up in rates.
By contrast, Niigata and Shizuoka tighten sharply during the window, at +14.3pt and +11.5pt respectively. Niigata’s October 10 occupancy of 87.2% (for stays on October 10, 2026, measured 76 days out) is the highest of the 12 areas. These areas are structured so that domestic leisure demand concentrates heavily on the holiday itself, which leaves more room to build around the days on either side of the peak — Friday October 9 above all. Niigata’s October 9 occupancy is 68.0% (for stays on October 9, 2026, measured 76 days out) and its listed price ¥22,700, well down from ¥33,500 on the 10th. As the first day of Taiwan’s break, it is an easy slot to exploit precisely because it does not compete with Japanese domestic weekend demand.
Conclusion: Design the Four Days as a Single Band
October 9-12, 2026 is a somewhat unusual four-day stretch: Taiwanese and Japanese holidays overlap for two days, with one single-country holiday extending on either side. At the 76-days-before-check-in cross-section, the holiday effect varies widely by area. Niigata, Shizuoka and Kanagawa show clear gaps of +9 to +14pt against a normal weekend, while Tokyo is at +0.2pt and Osaka at -2.3pt — the larger the urban market, the smaller the gap.
That spread is itself the distribution of available capacity. The elements travelers from Taiwan tend to rate — clear access from the station and city center, room to move in the guestroom, a price that feels justified — are held most fully by Tokyo and Osaka, and both still have headroom in inventory and price. Osaka in particular has settled to -13.3% year on year in estimated settled ADR for October 2026, widening its capacity to absorb demand on price as well.
And within the four days, Friday October 9 is the one that leaves the most room. Occupancy sits below Saturday the 10th in all 12 areas and listed prices are distinctly lower. This thin day for Japanese domestic demand coincides with the first day of Taiwan’s break. Multi-night structures anchored on a Friday check-in, messaging around stays that include the Friday, multilingual information on routes and access — the structure favors moves of this kind. Whether the holiday is designed as “a single band from Friday to Monday” rather than “a Saturday-Sunday peak” looks likely to be what separates outcomes across these four days.
⚠ Note on data for future dates: The dates covered in this article, October 9-17, 2026, are all check-in dates that had not yet arrived at the time of writing. Estimated occupancy, listed prices and estimated settled ADR are all estimates based on inventory and selling prices listed on OTAs as of the survey date, and they shift as new plans are added and prices adjusted closer to check-in. Note also that the number of properties for which inventory can be observed varies by day at each LT cross-section, so figures move more readily where observation is thin. This article states the number of observed properties at every data point.
Related Reading
- 1,291 Hotels, 31,024 Rooms Above ¥100,000: Japan’s Luxury Map
- Where Luxury Travelers Stay: Japan’s ¥1T Market by Prefecture 2026
- Japan’s Vegetarian Inbound Map: Koyasan 4.9x Average, 654 Reviews
- Nagano Late-Summer Booking Curve 2026: Ryokan -11.8pt at 45 Days Out
- Fukuoka Hotel Supply 2026-2028: ~1,000 Rooms/Year in Hakata & Tenjin
- Taiwan Tops Inbound Spending: Q1 2026 ¥2.3T Shift and Hotel ADR Sensitivity
- Tokyo Hotel Review Gap by Language: How Japanese vs Inbound Guests Differ
- Awaodori 2026: 98.8% Sold 45 Days Out — 39.4pt Over Normal Weekends
- Singapore Inbound 2026 Summer — 7-8 Night Stays Drive Kyoto/Hokkaido/Okinawa ADR
References and Sources
■ Data sources
Daily observation of room inventory and selling prices listed on OTAs, by check-in date and lead time; NLP analysis of guest reviews by language written (past 24 months); and monthly aggregation of estimated settled ADR by prefecture. All compiled by MetroEngines Research / the HotelBank Editorial Team.
■ Calculation assumptions
All comparisons between the holiday window and a normal weekend are matched at the same 76-days-before-check-in (LT76) cross-section. Estimated occupancy is the absorption rate of OTA-listed inventory; listed price is the all-plan average for double occupancy (tax included); estimated settled ADR is the median of estimates derived by applying category-specific adjustment coefficients. The scope is a prefecture-level macro aggregate (all categories, double occupancy) and differs from property-level actual occupancy and actual transacted rates.
■ Limitations and caveats
October 9-17, 2026 are check-in dates that had not yet arrived at the time of writing, and values will shift with future inventory additions and price adjustments. Because the number of properties for which inventory can be observed varies by day at each LT cross-section, observed property counts are stated at every data point. A review’s language is the language it was written in and does not correspond to the writer’s nationality. Mention rates are frequencies of description, not evaluation scores.
■ Calendars and holidays
- Directorate-General of Personnel Administration, Executive Yuan — “2026 (ROC Year 115) Government Office Calendar” (designates October 9 as a compensatory holiday because National Day, October 10, falls on a Saturday)
- Cabinet Office of Japan — “National Holidays” (Sports Day = the second Monday of October)
■ Government statistics and public data
- Japan National Tourism Organization (JNTO) — “Foreign Visitors to Japan (June 2026 estimate)” (total 3,148,600, -6.8% year on year; first-half cumulative 21,084,800)
- JNTO — “Foreign Visitors to Japan (total): monthly trends by market” (Taiwan 670,400, +14.6%; South Korea 787,100, +7.8%; Hong Kong 214,300, +28.5%; China 340,700, -57.3%)
■ Market data
- MetroEngines Research — inventory absorption trends by check-in date (occupancy, listed price) and estimated settled ADR by prefecture (October 2025 / October 2026)
- HotelBank Editorial Team analysis — NLP analysis of guest reviews by language written (past 24 months; Traditional Chinese N=53,526 / Japanese N=968,166)