

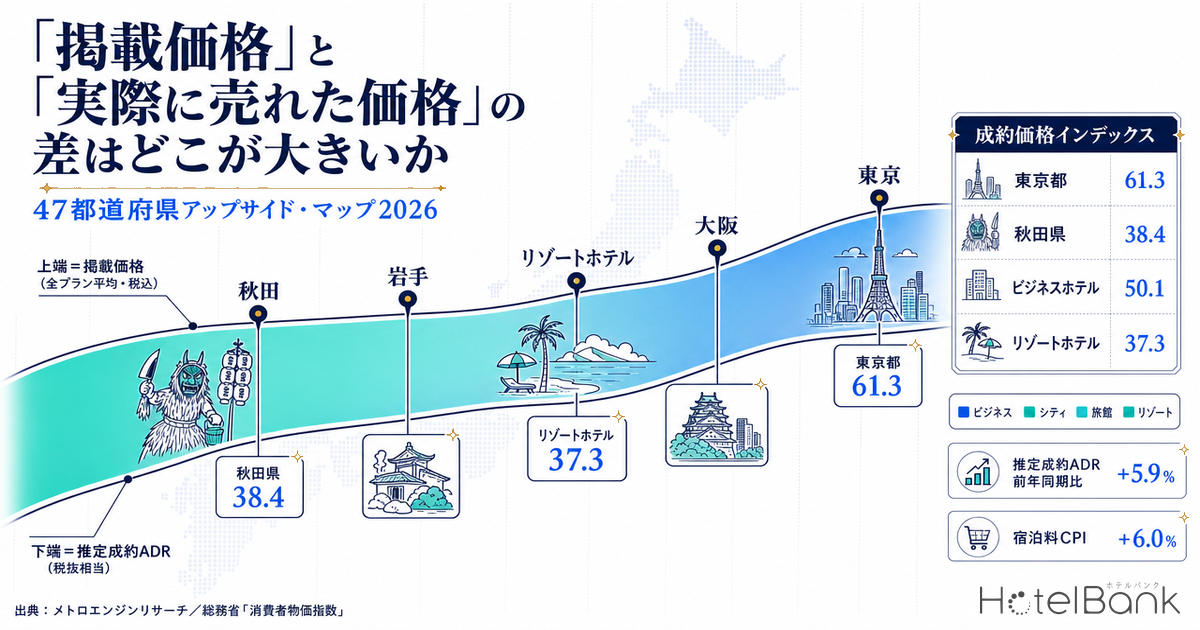
When we talk about hotel prices, we unconsciously mix two different numbers. One is the price that sits “on the shelf” on booking sites; the other is the price rooms actually sold at. Even when both describe the same market, they never converge — they stay a fixed distance apart. And that distance varies dramatically by prefecture and by hotel category. This article maps that distance — the pricing upside — across 46 prefectures by comparing listed prices with estimated settled rates over the past 12 months (July 2025 to June 2026).
Metric Definitions Used in This Article
- ADR (average daily rate): the estimated settled rate (tax-exclusive equivalent), calculated by applying category-specific correction coefficients to each property’s lowest publicly listed plan rate (double occupancy, per-room, tax-inclusive). Cross-checked against property-level results disclosed by listed hotel REITs (91 properties, most recent 3 months), the median error is approximately 7%. These are estimates and differ from each property’s actual settled prices or accounting figures. Area-level ADR is the median of the properties covered (the level of a typical property in that area). This is the figure referred to as “estimated settled ADR” throughout, and it is the article’s official ADR definition.
- Listed price (all-plan average): the listed prices of all plans — from room-only to meal-inclusive — averaged daily per property, then taken as the area median and averaged monthly (double occupancy, per-room, tax-inclusive). Because unsold high-priced plans stay listed, this figure structurally runs above the settled level. This article does not call it ADR.
- Settled Price Index: estimated settled ADR ÷ listed price × 100. The lower the value, the thicker the upper end of the listed price range and the further below it actual bookings are settling.
- Occupancy rate (estimated, based on inventory listed on booking sites): the share of sold rooms against total rooms in the area. It is an estimate based on the depletion of inventory offered on booking sites, and differs from each property’s actual overall occupancy.
- Data sources: MetroEngines Research / Statistics Bureau of Japan, Consumer Price Index
- — The Settled Price Index (estimated settled ADR ÷ listed price × 100) ranges across 46 prefectures from Tokyo 61.3 down to Akita 38.4 — a 23-point spread. Read it as a relative measure across markets, not as an absolute level.
- — More than half of that spread is explained by category mix. Business hotels sit at 50.1, against city hotels 43.4, ryokan 40.4 and resort hotels 37.3.
- — Even after holding category mix constant, a 13.9-point regional gap remains (Kyoto 53.1 vs Kagoshima 39.2) — a layer rooted in location-specific demand structure.
- — Correlation with occupancy is a limited 0.37. Within categories it falls to 0.16–0.28, and for resort hotels the sign flips to −0.22 — occupancy alone cannot explain the gap.
- — Estimated settled ADR’s year-on-year +5.9% is nearly identical to the +6.0% in the accommodation CPI. The median index moved 44.95 → 44.97 — flat — showing the gap is structurally fixed.
The Price on the Shelf and the Price That Sold Are Two Different Things
First, the two numbers differ in character. The listed price is the average of every plan a property has posted on booking sites on a given day. A cheap room-only plan, a premium two-meal plan and a special suite package all carry equal weight. And because plans that fail to sell stay listed longest, the average is naturally pulled upward.
The estimated settled ADR, by contrast, applies category-specific correction coefficients to each property’s lowest listed plan rate to estimate the per-room rate rooms most likely sold at. Cross-checked against property-level actual ADR disclosed by listed hotel REITs, the median error stays around 7%. If the listed price is the average of the price tags on the shelf, the estimated settled ADR is closer to an estimate of what went through the register.
The ratio between the two is what this article calls the Settled Price Index. On a 12-month average across 46 prefectures, it has a median of 45.0 and a range from 38.4 to 61.3. What matters here is that the absolute level of the index must not be read as a discount rate. The listed price is tax-inclusive and averaged across all plans; the estimated settled ADR is tax-exclusive equivalent and anchored on the lowest plan. A structural definitional gap is baked in from the start. What should be read is not the level but the relative differences between areas and between categories.
And an area with a low index — a wide gap — is by no means an area selling cheap. Quite the opposite: it means that higher-priced plans are already prepared on the listing side, yet bookings still cluster below them. The goods are on the upper shelf, but hands are not yet reaching them. That means the headroom in price-band design remains fully intact — a thick revenue opportunity to be captured as demand matures.
The 46-Prefecture Map — a 23-Point Spread from Tokyo 61.3 to Akita 38.4
One premise needs to be stated up front. When comparing listed prices with estimated settled ADR at prefecture level, the comparison breaks down if the two cover different property sets. Estimated settled ADR is calculated only for verified categories (business hotel, city hotel, resort hotel, ryokan and capsule), so using an all-category listed price as the denominator would distort the index in prefectures with a high share of pensions and minshuku. This article therefore takes listed price and estimated settled ADR for each of the four categories — business hotel, city hotel, resort hotel and ryokan — and weights them by property count. Only Hyogo, where all four categories lacked a full 12 months of data, is excluded from the ranking (46 prefectures covered).
Source: compiled by the HotelBank Editorial Team from MetroEngines Research (12-month average, July 2025–June 2026, 46 prefectures)
The result is clear. The high-index prefectures — where listing and settlement sit close together — are Tokyo 61.3, Osaka 58.3, Kyoto 57.1 and Fukuoka 55.0, all among Japan’s largest concentrations of lodging demand. The low-index prefectures, where the gap is thickest, are regional: Akita 38.4, Iwate 38.6, Tottori 40.5 and Fukushima 41.0. The 23-point spread between top and bottom is too wide to lump together as a single “Japanese hotel market.”
| Rank | Prefecture | Index | Listed price | Est. settled ADR | Properties |
|---|---|---|---|---|---|
| 1 | Tokyo | 61.3 | ¥25,324 | ¥15,519 | 1,088 |
| 2 | Osaka | 58.3 | ¥19,982 | ¥11,375 | 634 |
| 3 | Kyoto | 57.1 | ¥34,674 | ¥18,688 | 586 |
| 4 | Fukuoka | 55.0 | ¥22,855 | ¥12,084 | 462 |
| 5 | Saitama | 51.6 | ¥18,843 | ¥9,279 | 213 |
| 6 | Hiroshima | 51.0 | ¥21,603 | ¥10,746 | 297 |
| 7 | Kanagawa | 50.9 | ¥34,563 | ¥16,639 | 563 |
| 8 | Aichi | 49.1 | ¥21,537 | ¥10,150 | 502 |
| 9 | Okinawa | 48.9 | ¥28,354 | ¥13,154 | 490 |
| 10 | Nara | 48.4 | ¥30,666 | ¥14,595 | 134 |
Source: compiled by the HotelBank Editorial Team from MetroEngines Research (listed price: double occupancy, tax-inclusive; estimated settled ADR: tax-exclusive equivalent)
| Rank | Prefecture | Index | Listed price | Est. settled ADR | Properties |
|---|---|---|---|---|---|
| 37 | Nagasaki | 42.7 | ¥24,390 | ¥9,560 | 254 |
| 38 | Shimane | 42.6 | ¥31,074 | ¥12,894 | 171 |
| 39 | Wakayama | 42.3 | ¥28,413 | ¥11,490 | 220 |
| 40 | Tokushima | 42.1 | ¥17,808 | ¥6,894 | 141 |
| 41 | Yamagata | 41.7 | ¥28,352 | ¥11,556 | 290 |
| 42 | Kagoshima | 41.4 | ¥22,680 | ¥8,532 | 316 |
| 43 | Fukushima | 41.0 | ¥23,232 | ¥9,166 | 438 |
| 44 | Tottori | 40.5 | ¥28,049 | ¥10,475 | 148 |
| 45 | Iwate | 38.6 | ¥22,220 | ¥8,128 | 252 |
| 46 | Akita | 38.4 | ¥24,454 | ¥8,792 | 170 |
Source: compiled by the HotelBank Editorial Team from MetroEngines Research (listed price: double occupancy, tax-inclusive; estimated settled ADR: tax-exclusive equivalent)
Look inside the bottom group and an interesting pattern emerges. Shimane’s listed price of ¥31,100 is among the highest in the country, yet its estimated settled ADR stops at ¥12,900. Yamagata shows ¥28,400 listed against ¥11,600 settled; Wakayama ¥28,400 against ¥11,500. These are not cheap markets at all. The high-priced plans are already on the shelf — demand simply has not risen to meet them. Compared with top-ranked Tokyo (¥25,300 listed, ¥15,500 settled), listed levels are in fact higher in regional onsen and resort destinations.
Category Mix Is the Biggest Driver — Business 50.1, Resort 37.3
Why is the gap thicker in regional Japan? The single largest explanatory variable is category mix. Aggregating all 47 prefectures for each of the four categories, the index lines up cleanly.
Source: compiled by the HotelBank Editorial Team from MetroEngines Research (median of prefecture-level values, July 2025–June 2026)
| Category | Listed price | Est. settled ADR | Index | Properties |
|---|---|---|---|---|
| Business hotel | ¥14,514 | ¥7,276 | 50.1 | 7,362 |
| City hotel | ¥22,078 | ¥9,584 | 43.4 | 1,094 |
| Ryokan | ¥34,084 | ¥13,778 | 40.4 | 6,402 |
| Resort hotel | ¥41,083 | ¥15,308 | 37.3 | 1,543 |
Source: compiled by the HotelBank Editorial Team from MetroEngines Research (property counts are totals across 47 prefectures)
Business hotels index at 50.1 against resort hotels at 37.3, with ryokan at 40.4 and city hotels at 43.4. Business hotels have simple plan structures — mostly room-only, with a narrow price band — so the listed average sits close to the settled level. Resort hotels and ryokan, by contrast, permanently display premium plans such as two-meal packages, special kaiseki menus and rooms with private open-air baths. That lifts the listed average, while actual bookings tend to concentrate in the standard plan band. This structure is exactly what the “upper shelf” is — and it is also where the headroom sits.
Regional variation within categories is also wide. Among business hotels, Kyoto 63.7, Tokyo 62.6 and Osaka 60.8 lead, while Fukushima 46.5, Shimane 46.8 and Iwate 46.8 trail. For city hotels, Okinawa 65.9, Tokyo 64.1 and Kyoto 60.5 lead, against Saga 37.1, Niigata 38.0 and Akita 38.8. Ehime tops resort hotels at 47.6, with Ibaraki 23.2, Tottori 28.9 and Saitama 30.9 at the bottom. For ryokan, Nara 47.5, Kanagawa 47.4 and Hiroshima 46.5 lead, against Miyazaki 30.5, Akita 30.5 and Tokushima 30.9. How prices diverge by prefecture even within the same category is traced from the year-on-year angle in Japan Hotel ADR Polarization 2026: 57.6pt Prefecture×Category Gap.
A 14-Point Regional Gap Survives Even After Equalizing Category Mix
So can regional variation be explained entirely by category mix? To test that, we computed an index that cancels out mix differences — a simple, unweighted average of the four category indices. Reordered on this mix-adjusted index, the leaders are Kyoto 53.1, Tokyo 52.7, Okinawa 52.6, Hiroshima 49.5 and Osaka 49.4; the laggards are Kagoshima 39.2, Tottori 39.4, Ibaraki 39.5, Iwate 39.9 and Tokushima 40.0.
Rankings shift considerably against the weighted version. Chiba, 11th on property-count weighting, sinks to mid-table once mix is equalized, while Okinawa climbs to 3rd. Indeed, the correlation between business-hotel share and the index is a high 0.59 on the weighted version but falls to 0.22 on the mix-adjusted one. More than half of a prefecture’s position in the ranking is determined by which categories it has, and how many.
Even so, a 13.9-point gap remains between Kyoto 53.1 and Kagoshima 39.2 after equalizing mix. This is likely driven by area-specific differences in demand density, seasonal amplitude and channel composition that category mix cannot explain. Pricing upside therefore has two layers — a category-derived layer and a location-derived one — and the latter varies in thickness by area even for operators running the same category.
The Higher the Occupancy, the Closer Listing and Settlement Get
As a candidate for explaining the location-derived layer, consider supply-demand tightness. We calculated June 2026 occupancy (estimated, based on listed inventory) for 187 prefecture×category pairs and matched each against its Settled Price Index. The chart below splits those pairs into occupancy quartiles.
Source: compiled by the HotelBank Editorial Team from MetroEngines Research (187 prefecture×category pairs; occupancy is a June 2026 estimate)
The lowest-occupancy quartile Q1 (74.8% average) indexes at 39.7; the highest, Q4 (90.1% average), at 48.2. The 8.5-point difference points in the direction the hypothesis predicts: the higher the occupancy, the more listed prices track the market. But the correlation coefficient is 0.37 — hardly a strong relationship. Within categories it is weaker still: 0.16 for business hotels, 0.28 for city hotels, 0.27 for ryokan, and −0.22 for resort hotels, where the sign reverses.
This result deserves to be taken at face value. High occupancy explains only part of the narrowing. An area with high occupancy but a thick gap is capturing demand yet still failing to reach the upper price band — the room for pricing design there is particularly large. Conversely, an area with a high index despite moderate occupancy has likely already established pricing operations aligned with real market levels.
Occupancy Quartile × Category Cross-Table — the Quartile Gap Is Really a Mix Effect
Is the quartile gap in the previous section (8.5 points, from 39.7 in Q1 to 48.2 in Q4) an effect of occupancy itself, or simply a reflection of which categories populate each quartile? To separate the two, we rearranged the same 187 pairs on two axes — occupancy quartile across, category down — and took the median index of each cell.
| Category | Q1 (low occupancy) | Q2 | Q3 | Q4 (high occupancy) |
|---|---|---|---|---|
| Business hotel | 49.0 (3 pairs) | 51.2 (10 pairs) | 50.6 (17 pairs) | 51.1 (17 pairs) |
| City hotel | 44.9 (4 pairs) | 45.6 (13 pairs) | 44.7 (10 pairs) | 48.2 (20 pairs) |
| Ryokan | 39.0 (21 pairs) | 44.6 (11 pairs) | 38.2 (9 pairs) | 40.5 (5 pairs) |
| Resort hotel | 37.4 (18 pairs) | 38.8 (13 pairs) | 38.8 (11 pairs) | 37.7 (5 pairs) |
Source: compiled by the HotelBank Editorial Team from MetroEngines Research (187 prefecture×category pairs; occupancy is a June 2026 estimate; index is the 12-month average for July 2025–June 2026)
There are two things to read here. First, reading across within a category, movement between quartiles is small. Business hotels run from 49.0 in Q1 to 51.1 in Q4; resort hotels from 37.4 to 37.7. Higher occupancy barely moves the index. The within-category correlation falling to 0.16–0.28, and the sign flipping for resorts, is the flip side of this horizontal flatness.
Second, the distribution of the cells themselves is skewed. The lowest quartile Q1 (46 pairs) is roughly 85% ryokan (21 pairs) and resort hotels (18 pairs); the highest, Q4 (47 pairs), is about 79% city hotels (20 pairs) and business hotels (17 pairs). The 8.5-point quartile difference is therefore mostly not a causal effect of occupancy narrowing the gap, but a reflection of composition — ryokan and resorts clustering in the low-occupancy band, business and city hotels in the high one. Occupancy on its own is best treated as an almost ineffective explanatory variable for the gap.
The operational implication is clear. The expectation that “the distance between listing and settlement will close naturally once occupancy rises” is not supported, at least at prefecture×category granularity. What closes the distance is not the rise in occupancy itself, but how plan structure and price bands are redesigned.
Estimated Settled ADR Tracks the Official Accommodation Price Index Closely
At this point it is worth validating the estimated settled ADR itself against external official statistics. The chart below places the accommodation component of the Statistics Bureau’s Consumer Price Index (national, 2020 base) alongside the year-on-year changes in this article’s estimated settled ADR and listed price.
Source: compiled by the HotelBank Editorial Team from MetroEngines Research and the Statistics Bureau of Japan, Consumer Price Index (2020 base)
On a 12-month average, estimated settled ADR rose +5.9% year on year against +6.0% for the accommodation CPI — an almost exact match. Listed price growth, meanwhile, stopped at +4.8%. Monthly swings are wide — estimated settled ADR spiked +17.3% in December 2025 and reversed to −7.6% in June 2026 — but the full-year level aligns well with official statistics.
That alignment suggests two things. One is confirmation that estimated settled ADR captures real price movement. The other is that listed price growth actually trailed growth in the settled level. The gap did not widen because the listing side ran ahead with price increases; it was already that wide to begin with. Where the funding for those increases comes from is explored from the cost side in Labor Cost Pass-Through ADR Surge: Decoding Japan’s 2026 Hotel Pricing via OCC-ADR Divergence.
A Year Changes Nothing — the Gap Is Structurally Fixed
The year-on-year comparison bears this out. Using the same four-category weighted method, we computed the index for July 2024–June 2025 and compared it with the most recent 12 months.
Source: compiled by the HotelBank Editorial Team from MetroEngines Research (46 prefectures, 12-month averages; the dashed line marks parity with the prior year)
The median index across the 46 prefectures moved from 44.95 to 44.97 — essentially flat. Twenty-six prefectures rose and 20 fell, a near-balanced distribution. On the scatter plot the points cluster tightly around the 45-degree line, with no significant outliers. The largest gain was Aomori at +2.6 points and the largest decline Miyazaki at −1.5 points; every move is small.
That so little changes in a year means the gap is not the product of economic cycles or temporary demand waves, but is rooted in structure — each area’s category mix, plan design and channel operations. Read the other way, it also means there is room to move if the structure is addressed. How premium plans are exposed, how finely price bands are cut, staged pricing by lead time — the swing from such measures is greatest in the lowest-index areas. (For how finely prices are actually being cut in practice, see RM Tools & Price Dispersion: Tokyo/Osaka ADR Volatility by Hotel Type.)
Reference: How to Read Data for Future Dates
For reference, the same aggregation can be run for July–November 2026, dates that have not yet reached check-in. But estimated settled ADR for future dates rests on a different calculation basis than for settled past months: it depends on a snapshot of prices listed on booking sites at the time of survey. On that basis the index comes out at 45.6–48.8, above the level of the past 12 months. This does not mean supply-demand conditions improved; it means that the calculation basis differs, so the two cannot be compared directly. The main analysis in this article is therefore confined entirely to the settled past 12 months, and figures for future dates are kept to this single paragraph as reference values.
Summary — How to Read the Upside Map
To summarize the findings. First, the Settled Price Index — the distance between listed price and estimated settled ADR — spans 23 points across 46 prefectures, from 38.4 to 61.3. Second, more than half of that spread is explained by category mix, with a large index gap between categories themselves: business hotels 50.1 against resort hotels 37.3. Third, a 13.9-point regional gap survives even after equalizing category mix, derived from location-specific demand structure. Fourth, the correlation with occupancy is a limited 0.37 — supply-demand tightness alone cannot explain the gap. Fifth, estimated settled ADR’s +5.9% year-on-year change closely matches the +6.0% accommodation CPI, confirming the metric’s validity. Sixth, the median index is essentially flat versus the prior year, showing the gap is structurally stable.
How should this map be used? For a property operating in a low-index area, the index is not a signal that rooms are being sold cheap. It is a signal that bookings have not yet reached the premium plans already on offer. The high-priced inventory is on the shelf. What remains is to set the conditions under which guests reach for it — presentation, timing and the granularity of price steps. High-index areas are markets that have largely finished that work; in low-index areas the same work remains, in full, as a revenue opportunity.
In high-index areas — Tokyo, Osaka, Kyoto, Fukuoka — the distance between listing and settlement has already narrowed. Upside there shifts away from redesigning price bands toward sharpening operational precision to capture demand peaks more finely. Headroom exists in both, but where it sits changes shape with market maturity.
⚠ Note on data for future dates: the main analysis in this article is confined to the settled period of July 2025–June 2026. Figures for July 2026 onward, referenced only for context, are estimates based on prices publicly listed on booking sites at the time of survey and will shift as check-in dates approach. Because the calculation basis differs from that of past months, they are not suitable for direct comparison.
Related Reading
- Japan Hotel ADR Polarization 2026: 57.6pt Prefecture×Category Gap
- Labor Cost Pass-Through ADR Surge: Decoding Japan’s 2026 Hotel Pricing via OCC-ADR Divergence
- RM Tools & Price Dispersion: Tokyo/Osaka ADR Volatility by Hotel Type
References and Sources
- MetroEngines Research — listed prices and estimated settled ADR for 46 prefectures × 4 categories (monthly, July 2024–June 2026; estimated settled ADR covers 16,483–17,066 properties nationwide)
- MetroEngines Research — occupancy rate (estimated, based on listed inventory; June 2026; 187 prefecture×category pairs)
- Statistics Bureau of Japan, Consumer Price Index (2020 base), accommodation charges, national (e-Stat table ID: 0003427113)
- Japan Tourism Agency, Survey on Overnight Travel Statistics — the national room occupancy rate stood at 60.6% as of May 2026 (first preliminary figures). Note that from the January 2026 edition the stratification basis changed from employee count to room count.
- Japan National Tourism Organization (JNTO), Foreign Visitors to Japan (May 2026 estimate)
■ Data sources
Listed prices and estimated settled ADR come from MetroEngines Research monthly aggregations (47 prefectures × 4 categories, July 2024–June 2026). Occupancy is an estimate based on listed inventory (June 2026, 187 prefecture×category pairs). The price-index cross-check uses the Statistics Bureau of Japan’s Consumer Price Index (2020 base), accommodation charges, national.
■ Calculation assumptions
Settled Price Index = estimated settled ADR ÷ listed price × 100. Prefecture values are calculated per category for business hotels, city hotels, resort hotels and ryokan, then weighted by property count. Hyogo, which lacked 12 months of data across all four categories, is excluded from the ranking (46 prefectures covered). National category values are the medians of prefecture-level values. The mix-adjusted index is the simple, unweighted average of the same four category indices. The analysis is confined to the settled past 12 months (July 2025–June 2026); future dates are treated as reference values only.
■ Limitations and caveats
Estimated settled ADR is an estimate and differs from each property’s actual settled prices or accounting figures (median error of approximately 7% when cross-checked against property-level results disclosed by listed hotel REITs). The listed price is tax-inclusive and averaged across all plans, while estimated settled ADR is a tax-exclusive equivalent anchored on the lowest plan, so the absolute level of the index cannot be read as a discount rate. Occupancy is estimated from the depletion of listed inventory and differs from each property’s actual overall occupancy. Correlation does not imply causation, and much of the difference across occupancy quartiles derives from skewed category composition. Note that prefecture-category cells with few properties (fewer than 10) show greater volatility in the median.