

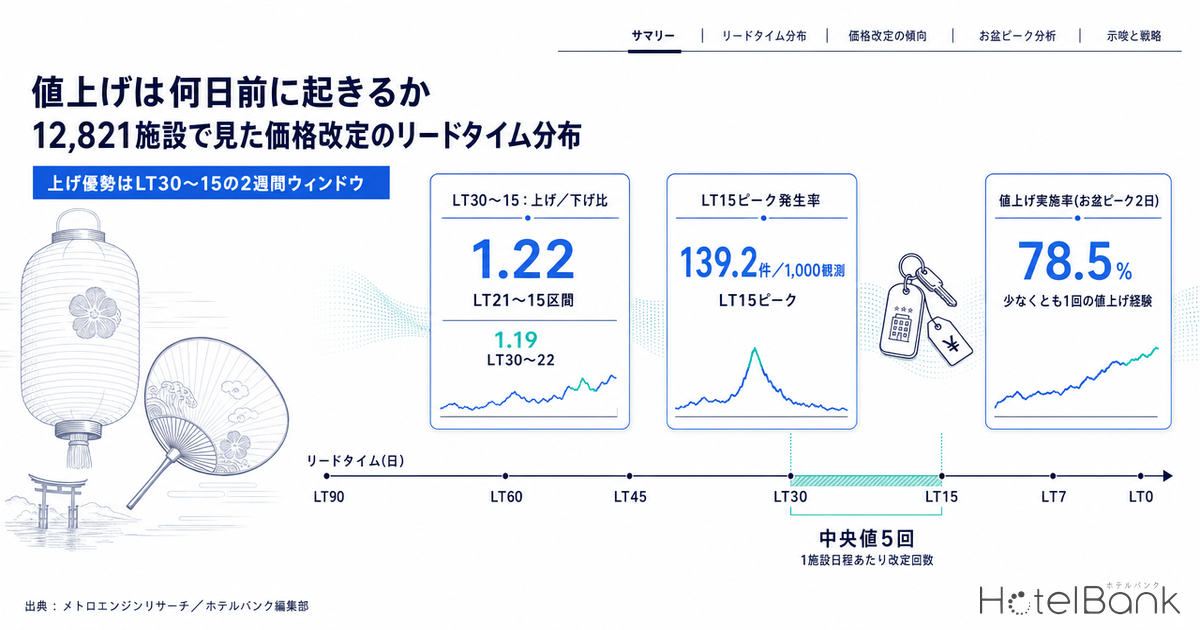
A rate increase is decided less by “how much” than by “when.” How many days before check-in a hotel moves its rate for a peak-demand date, and whether that move is up or down — these two choices can significantly change final revenue even when the same inventory is sold. This article extracts price-revision events by lead time from the daily listed-price history of individual properties for two 2026 Obon peak dates (Thursday, August 13 and Friday, August 14) and the first two days of Silver Week (Saturday, September 19 and Sunday, September 20), and quantifies the distribution of their timing and direction. The sample covers 12,821 hotels / 24,510 hotel-dates for Obon and 9,818 hotels / 17,064 hotel-dates for Silver Week.
Metric Definitions Used in This Article
- LT (lead time): Days remaining until the check-in date. LT0 = day of check-in, LT90 = 90 days out. This article uses only observations within LT90.
- Listed price: The price of the lowest-priced plan each property publishes on OTAs and similar channels (double occupancy, per-room rate, tax included). It is a daily-observed value and is a different metric from the actual transacted price (estimated settled ADR). This article is an analysis of listed prices and does not discuss the level of transacted prices.
- Price-revision event: An instance in which the listed price on a given observation day changed by ±3% or more from the immediately preceding observed value. A positive rate of change is counted as an increase, a negative one as a decrease. Days on which no listing could be confirmed (carry-over of the prior day’s value) are excluded from the revision test.
- Incidence rate: The number of revision events per 1,000 observations, with hotel × observation-day as the denominator. Because the number of observation days differs by lead-time band, comparisons use this incidence rate rather than raw counts.
- Inventory sell-through rate: 1 − (rooms remaining at the final observation ÷ maximum rooms remaining during the observation period). It expresses, on a room-count basis, how far the inventory published on OTAs and similar channels has been consumed.
- Data source: MetroEngines Research
- — Increases outnumber decreases in only one two-week window, LT30–15. The increase/decrease ratio is 1.19 at LT30–22 and 1.22 at LT21–15, then flips to 0.70 at LT7–0.
- — Increases do not build smoothly; they cluster at the LT60, 45, 30 and 15 milestones. The median lead time of a property’s first increase is LT58, with 14.9% packed into the five days from LT59 to LT55 alone.
- — Differences in revision frequency show up by hotel category (Deluxe Hotels 5.77 times vs. Ryokan 2.27 times), while differences in speed show up by area (median first increase: Tokyo LT59 vs. Tochigi and Gunma LT48).
- — Among mid-sized properties, sell-through was 83.3% for early movers, 83.9% for mid-cycle movers and 81.0% for late movers — virtually no difference — while only the no-increase group sat at 58.8%. What mattered in the distribution was not timing but whether a revision happened at all.
- — The sample is 12,821 hotels / 24,510 hotel-dates for Obon and 9,818 hotels / 17,064 hotel-dates for Silver Week. This is an analysis of prices listed on OTAs and similar channels, and does not discuss the level of transacted prices.
The Premise in One Paragraph — Not “How Often” but “When”
The sheer frequency with which peak-date rates are moved is already fairly high. In the sample for the two Obon peak dates used here, only 13.8% of hotel-dates saw no price-revision event at all between LT90 and the eve of check-in, while 78.5% experienced at least one increase and 79.7% at least one decrease. The median number of revisions per hotel-date is five. It is fair to say the “volume” of revisions is already standard equipment in this market.
If so, what separates properties is not volume but placement. Below, we decompose those 165,303 revision events by the lead time at which they occurred and by direction (up or down).
Increases Outnumber Decreases in Only One Two-Week Window: LT30–15
The first chart tracks, for the two Obon peak dates, the incidence rate of increases and of decreases (events per 1,000 observations) in one-day steps from LT87 to three days before check-in. Because the earliest observations include initial listing volatility, the display begins at LT87.
Three structural features stand out. First, the incidence of increases rises monotonically as the lead time shortens. It runs at 19.0 events per 1,000 observations in the LT90–61 band and reaches 84.9 at LT7–0, roughly 4.5 times higher. The further out the date, the more prices are left untouched; the closer it gets, the more hands are on the rate.
Second, the incidence of decreases also jumps in the final stretch, and it climbs more steeply than increases do — from 24.8 at LT90–61 to 121.5 at LT7–0, about 4.9 times, outpacing the growth in increases. How wide those last-minute cuts run in absolute price terms differs considerably from one area to another, but that price-level dimension is outside the scope of this article, which looks only at the frequency and direction of revisions.
Third, the crossing of these two lines is the central finding of this article. The ratio of increase events to decrease events stays below 1 at 0.77 for LT90–61, 0.96 for LT60–46 and 0.88 for LT45–31, but exceeds 1 at 1.19 for LT30–22 and 1.22 for LT21–15. It then falls back below 1 to 0.82 at LT14–8 and 0.70 at LT7–0. In other words, the market as a whole sees increases outnumber decreases only within a narrow window of just over two weeks — from roughly one month to two weeks before check-in.
| Band | Increase incidence | Decrease incidence | Increase/decrease ratio | Median increase size | Observations |
|---|---|---|---|---|---|
| LT90-61 | 19.0 | 24.8 | 0.77 | +8.3% | 635,004 |
| LT60-46 | 33.7 | 35.0 | 0.96 | +7.2% | 355,075 |
| LT45-31 | 36.9 | 41.9 | 0.88 | +8.6% | 324,625 |
| LT30-22 | 62.6 | 52.4 | 1.19 | +8.2% | 198,413 |
| LT21-15 | 69.9 | 57.5 | 1.22 | +9.1% | 147,456 |
| LT14-8 | 77.8 | 94.7 | 0.82 | +10.1% | 141,930 |
| LT7-0 | 84.9 | 121.5 | 0.70 | +11.4% | 103,880 |
The “size” of revisions is tilted as well. The median increase per event runs +8.3% at LT90–61, +9.1% at LT21–15 and +11.4% at LT7–0 — larger the closer to check-in. Fewer moves, but each one steps in deeper.
Movement Comes in Steps, Not a Curve — Clustering at LT60, 45, 30 and 15
Look closely at the one-day-step chart and increases do not build smoothly; they form sharp peaks on particular days. For the two Obon peak dates, the incidence of increases far exceeded surrounding levels at four points: LT60–58, LT46–45, LT31–30 and LT16–14. The highest is LT15, at 139.2 events per 1,000 observations — two to three times the ordinary level around it.
Picking just one observation per property — the lead time at which its first increase occurred — makes the same stepping even clearer. Among the 19,248 hotel-dates where an increase was observed, the median lead time of the first increase is LT58, with 14.9% concentrated in the five days from LT59 to LT55 alone.
The 60-, 45-, 30- and 14-day marks coincide with milestones widely used across the industry as sales deadlines for early-bird discount plans. At properties whose lowest-priced plan is an early-bird rate, the “displayed lowest price” jumps the day after that plan closes, and under this article’s definition that is recorded as an increase event. It is quite likely this mechanism contributes to the stepping. That said, the data here carries no plan-level breakdown, so not all of the stepping can be attributed to early-bird cut-offs. It is equally plausible that rate revisions tied to inventory consumption, or switches between promotional periods, are placed at the same milestones — so we stop short of asserting anything beyond “this is what it looks like.”
What matters in practice is less the cause than the fact that market-wide increases are synchronized on specific days. If everyone raises rates at the same milestone, relative pricing against competitors does not change. Conversely, moving ahead of the milestone or deliberately holding through it is itself a decision.
Hotel Category Determines “How Often,” Area Determines “How Early”
By hotel category, there is a clear gap in revision frequency. Increases per hotel-date run 5.77 for Deluxe Hotels, 4.67 for City Hotels, 3.69 for Resort Hotels and 3.62 for Business Hotels, against just 2.27 for Ryokan — the lowest. The share of properties raising rates at least once likewise runs 93.7% for Deluxe Hotels and 89.8% for City Hotels, against 71.4% for Ryokan.
On the other hand, Ryokan post the largest increase per event (median +10.3%). The contrast is between hotel-type properties that move in small increments and Ryokan that move rarely but in bigger steps. Given the scale difference — a median of 22 rooms for Ryokan against 150 for City Hotels — and the product characteristics of Ryokan, where two meals are standard and the inventory unit is large, it is natural to read this difference as one of design philosophy rather than operational skill.
| Category | Hotels | Median rooms | Share raising rates | Median LT of first increase | Increases | Decreases | Median increase size |
|---|---|---|---|---|---|---|---|
| Business Hotel | 5,728 | 105 rooms | 82.5% | LT58 | 3.62 | 4.09 | +8.0% |
| Ryokan | 3,274 | 22 rooms | 71.4% | LT47 | 2.27 | 2.49 | +10.3% |
| Resort Hotel | 1,118 | 55 rooms | 85.0% | LT59 | 3.69 | 3.63 | +9.8% |
| City Hotel | 966 | 150 rooms | 89.8% | LT59 | 4.67 | 4.74 | +9.2% |
| Deluxe Hotel | 143 | 164 rooms | 93.7% | LT65 | 5.77 | 5.07 | +8.5% |
Looking at the timing mix, differences between categories are not as large as those in frequency. The share of increase events occurring at LT46 or earlier (more than a month and a half out) spans just 6.5 points, from 34.7% for Deluxe Hotels to 30.5% for Business Hotels and 28.2% for Ryokan. Where the gap really opens up is by area.
| Area | Hotels | Share raising rates | Median LT of first increase | Early LT46 and earlier |
Mid LT45–22 |
Late LT21 and later |
Median increase size |
|---|---|---|---|---|---|---|---|
| Tokyo | 1,114 | 87.8% | LT59 | 33.1% | 31.5% | 35.4% | +7.5% |
| Hokkaido | 782 | 78.0% | LT59 | 35.8% | 30.9% | 33.3% | +8.6% |
| Osaka | 608 | 89.1% | LT59 | 32.7% | 29.9% | 37.4% | +8.3% |
| Kyoto | 588 | 85.3% | LT59 | 33.1% | 28.9% | 37.9% | +9.7% |
| Shizuoka | 587 | 80.0% | LT53 | 26.0% | 29.5% | 44.4% | +9.1% |
| Okinawa | 566 | 84.7% | LT59 | 33.8% | 30.9% | 35.3% | +9.7% |
| Nagano | 531 | 69.5% | LT55 | 30.8% | 32.5% | 36.6% | +9.5% |
| Kanagawa | 445 | 81.1% | LT58 | 27.6% | 28.9% | 43.5% | +8.3% |
| Fukuoka | 425 | 81.7% | LT59 | 30.6% | 33.4% | 36.0% | +8.3% |
| Aichi | 403 | 79.8% | LT58 | 30.0% | 28.2% | 41.8% | +8.0% |
| Hyogo | 367 | 70.9% | LT55 | 26.9% | 30.9% | 42.1% | +9.1% |
| Chiba | 339 | 83.1% | LT58 | 30.8% | 31.4% | 37.8% | +8.8% |
| Tochigi | 315 | 76.6% | LT48 | 25.8% | 33.0% | 41.1% | +9.1% |
| Gunma | 284 | 75.9% | LT48 | 25.7% | 30.7% | 43.6% | +9.1% |
The median lead time of the first increase is uniformly LT59 across wide-catchment destinations such as Tokyo, Osaka, Kyoto, Okinawa, Fukuoka and Hokkaido, while Tochigi and Gunma sit at LT48 and Shizuoka at LT53 — roughly two weeks later. The share of increase events falling in the late window (LT21 and later) likewise puts Shizuoka at 44.4%, Gunma at 43.6% and Kanagawa at 43.5% near the top, a gap of around 10 points from Tokyo at 35.4% and Hokkaido at 33.3%.
These prefectures host hot-spring and leisure destinations with heavy short-haul demand from the Greater Tokyo area, where bookings themselves tend to come in late. If bookings arrive late, the contours of demand also become visible late. It is reasonable to read area-level differences in revision timing less as fast or slow operations than as a reflection of the time distribution of bookings coming into that area.
Did Early Movers and Late Movers Differ in Inventory Sell-Through?
From here we look at the relationship between revision timing and final inventory sell-through. The sample is limited to properties among the two Obon peak dates whose inventory published on OTAs and similar channels reached 30% or more of total rooms (15,769 hotel-dates / 8,439 hotels), because at properties with an extremely small published allocation, changes in rooms remaining do not represent how full the property actually is. The distribution of allocation ratios is examined in detail in a separate article.
There is also a correlation between the timing of increases and property size: the earlier the first increase, the more large properties in the group, while the group with no observed increase skews small. To keep size effects from mixing with timing effects, the results below are restricted to the mid-size band of 30–99 rooms (the four groups’ median room counts are closely aligned at 47–52 rooms).
| Group (LT of first increase) | Hotel-dates | Median rooms | Sell-through rate median |
Zero rooms observed | LT at zero rooms median |
|---|---|---|---|---|---|
| Early (LT46 and earlier) | 2,639 | 52 rooms | 83.3% | 24.8% | LT24 |
| Mid (LT45–22) | 1,027 | 49 rooms | 83.9% | 30.9% | LT22 |
| Late (LT21 and later) | 698 | 50 rooms | 81.0% | 26.2% | LT18 |
| No increase observed | 782 | 47 rooms | 58.8% | 18.2% | LT28 |
The result came out somewhat differently from prior intuition. Across the three groups — early, mid and late — the median sell-through rate spans just 2.9 points, from 81.0% to 83.9%. Only the group where no increase was ever observed falls well below, at 58.8%. In this sample, then, what was linked to inventory sell-through was not “when they raised” but “whether they raised at all.” An analysis that splits sell-through progress on the same Obon peak dates into front-loaded and late-surge patterns is covered in Tokyo Aug 14: 434 Hotels, Front-Loaded 10.8% vs Late-Surge 9.4%.
The median lead time at which rooms remaining reached zero shows a gentle ordering: LT24 for the early group, LT22 for the mid group and LT18 for the late group — the later the increase, the later inventory runs out. Even so, this is a gap of only about six days, hardly decisive.
On the direction of causation. What is shown here is correlation, not causation. If anything, the causal arrow is more likely to run the other way: not “they sold because they raised early,” but “they could raise because bookings had already accumulated early.” Observations of listed prices and rooms remaining alone cannot separate the two. Likewise, the low sell-through of the no-increase group can just as readily be explained not by the failure to move price itself but by demand having been thin in the first place. The figures in this section cannot be used as evidence that “raising prices sells rooms.”
Silver Week in Progress — Tilting to the Upside at the Same Lead Times
Silver Week 2026 runs five consecutive days from Saturday, September 19 through Wednesday, September 23 (a public holiday) — the first five-day run in September in 11 years. As of the time of writing (August 11), the opening day of September 19 is still 39 days out, too early to draw conclusions about inventory or sell-outs. What follows is an interim read on booking progress that looks only at the direction of price revisions.
To make the comparison fair, we limit the sample to identical properties observable for both Obon and Silver Week, and align on the LT90–40 window where both are fully observed. Within that window, Obon covers 8,810 hotels / 17,098 hotel-dates and Silver Week 9,339 hotels / 16,349 hotel-dates.
In the LT90–40 window, Obon’s increase incidence is 27.1 per 1,000 observations against 33.2 for decreases, an increase/decrease ratio of 0.82 — decrease-dominant. Silver Week in the same window runs 37.3 for increases and 28.8 for decreases, a ratio of 1.29, tilting to the upside. The share of hotel-dates raising rates at least once is likewise 65.3% for Silver Week against 57.0% for Obon, 8.3 points higher.
That said, this concerns the direction of listed-price revisions, not proof that bookings are actually coming in heavily. Nothing more can be said at this point than that properties have entered the five-day holiday run with an assertive rate design. September 19 is still at LT39, and as the previous section showed, the band where market-wide increases outnumber decreases is LT30–15. Whether Silver Week prices genuinely move up, or turn to last-minute cuts instead, will require observations from late August into early September.
Practical Implications — Blend Into the Milestone, or Step Off It
From the distributions above, four points can be carried into rate design. Each should be read not as “you should do this” but as “here is where a choice exists.”
1. LT30–15 is one of the few periods when the whole market swings to the upside. In this band increases outnumber decreases (ratio 1.19–1.22), and each increase carries real weight at +8.2% to +9.1%. When everyone around you is raising, holding steady functions as a relative price cut. Put the other way, the design question starts with how to build, by LT45, enough booking momentum to raise with confidence in this band.
2. Once inside LT14, the market becomes two-directional, with increases and decreases intensifying at the same time. At LT7–0, increase incidence of 84.9 is clearly outweighed by decreases at 121.5. Yet the size of increases peaks here at +11.4%, the largest of any band. Properties clearing leftover inventory and properties selling scarce inventory dear coexist on the same day. It is worth judging, by LT14, which side your property is on.
3. The 60-, 45-, 30- and 14-day marks are milestones where the market moves in sync. Raise on those days alongside everyone else and relative pricing against competitors does not shift. If you want to take a relative position, there is room to choose deliberately — move a few days ahead of the milestone, or hold through it and absorb demand. In particular, if your lowest-priced plan is set to an early-bird cut-off date, it is worth checking whether a price jump occurs automatically the following day and whether that level is the one you intended.
4. The habit of moving at all appears to matter more than small differences in timing. Among mid-size properties, sell-through ran 83.3% for the early group, 83.9% for the mid group and 81.0% for the late group — essentially flat — while only the no-increase group sat apart at 58.8%. Although the direction of causation cannot be pinned down, the distribution suggests that “having the capability to move once demand becomes visible” shows up as a far larger difference than “finding the optimal timing.” Building in one early first revision per date has room to work in the direction of widening revenue opportunity.
Peak-date rates are not something to settle far in advance; they are repositioned in stages while watching how bookings come in. The distributions in this article show where that repositioning is concentrated across the market as a whole. Overlaying your own revision timing on this distribution should reveal in which bands you move with the market and in which bands you move differently.
⚠ Analytical caveats: This article is based on a daily-observed history of listed prices for the lowest-priced plans published on OTAs and similar channels, and differs from actual transacted prices and transacted unit rates. Changes in listed prices include apparent movements caused by turnover in the plan lineup (the addition or termination of lower-priced plans). Observations for the two Obon peak dates (Aug 13 and Aug 14) run to 2–3 days before check-in, while those for the first two Silver Week days (Sep 19 and Sep 20) run to 39–40 days out; the latter is still in progress and will change. In addition, incidence rates by lead time are normalized with hotel × observation-day as the denominator, but estimates become less stable in bands with fewer observation days.
Related Reading
- Median 39.2% of Rooms Online — Allocation Across 12,941 Hotels
- Osaka Obon 2026 Booking Curve: Aug 14 at 74.9%, Aug 16 Stuck at 64.1%
- Yamanashi Obon: Ryokan Gain Only +1.1pt, Business Hotels +7.9pt
- Japan Autumn 2026 Hotel Price Range: 3.3x CV Gap Across 47 Prefectures
- Fiscal Half-End Weekday Demand? 5 Business Cities Show No Lift
- Tokyo Aug 14: 434 Hotels, Front-Loaded 10.8% vs Late-Surge 9.4%
- RM Tools & Price Dispersion: Tokyo/Osaka ADR Volatility by Hotel Type
References and Sources
- MetroEngines Research — Observation history of daily listed prices and rooms remaining for individual properties (Obon Aug 13–14: 12,821 hotels / 24,510 hotel-dates; Silver Week Sep 19–20: 9,818 hotels / 17,064 hotel-dates; all within LT90, double occupancy, one night)
- When is Silver Week 2026 (Reiwa 8)? The first long holiday of its kind in 11 years (used to confirm the 2026 Silver Week calendar)
- Silver Week 2026 is a five-day run, the first in 11 years (Rurubu Kids)
- Japan Tourism Agency, “Overnight Travel Statistics Survey”
■ Data source
Observation history of daily listed prices and rooms remaining for individual properties, collected by MetroEngines Research (lowest-priced plans published on OTAs and similar channels; double occupancy, per-room rate, tax included; within LT90). The target dates are the two Obon peak dates of Thursday, August 13 and Friday, August 14, 2026, and the first two Silver Week days of Saturday, September 19 and Sunday, September 20. The sample comprises 12,821 hotels / 24,510 hotel-dates for Obon and 9,818 hotels / 17,064 hotel-dates for Silver Week (observations as of August 11, 2026).
■ Calculation assumptions
A price-revision event is defined as an instance in which the listed price on a given observation day changed by ±3% or more from the immediately preceding observed value, classified as an increase or a decrease by the sign of the change. Days on which no listing could be confirmed are excluded from the test. Incidence is normalized as events per 1,000 observations, with hotel × observation-day as the denominator. The inventory sell-through rate is 1 − (rooms remaining at the final observation ÷ maximum rooms remaining during the observation period). Cross-group inventory comparisons are limited to properties whose published inventory is 30% or more of total rooms (15,769 hotel-dates / 8,439 hotels) and are conducted within the mid-size band of 30–99 rooms to isolate scale effects.
■ Limitations and caveats
This article is an analysis based on listed prices and differs from actual transacted prices and estimated settled ADR. Changes in listed prices include apparent movements such as turnover in the plan lineup (the addition or termination of lower-priced plans) and jumps in the displayed lowest price when early-bird discounts close. The relationship between revision timing and inventory sell-through is correlation, not causation; the reverse explanation — “they could raise because bookings had already accumulated early” — holds equally well. Silver Week was at LT39 and still in progress at the time of writing, and the figures will change with further observation. Estimates become less stable in lead-time bands with fewer observation days.