

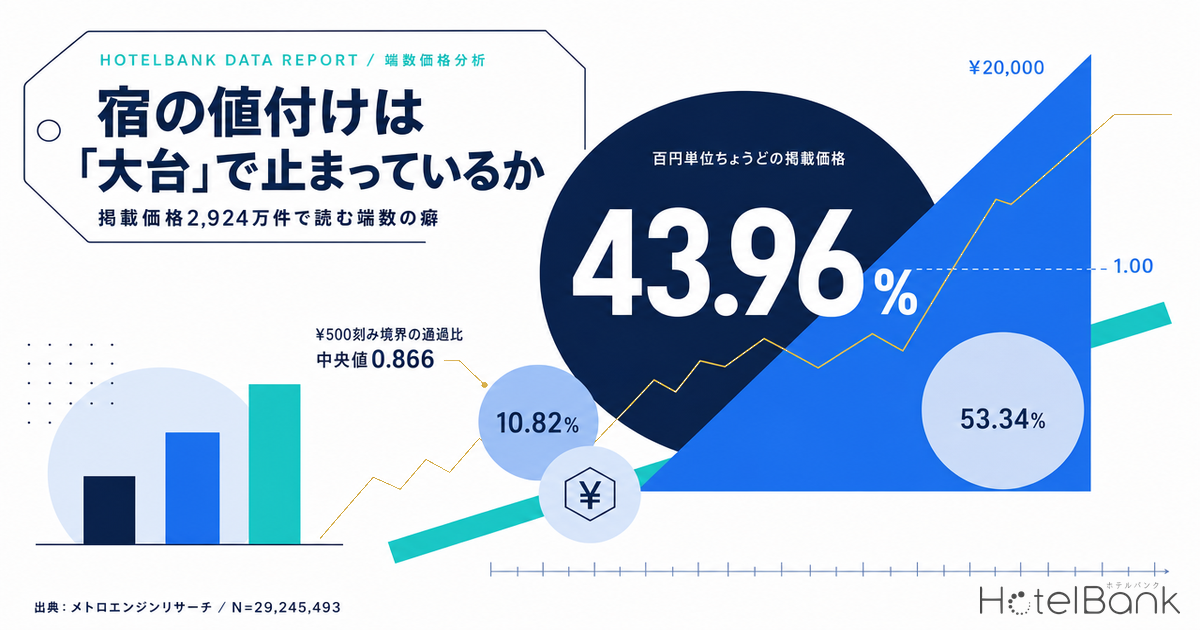
Line up hotel listed prices in bulk and a clear habit emerges. ¥9,800, ¥14,800, ¥19,800 — placing a price one step below a round number is well known in retail as charm pricing. Does lodging behave the same way? Using listed prices tracked by MetroEngines Research, we aggregated the distribution of the last three digits and the density of prices around each round-number line, covering 29,245,493 listed-price records across 90 check-in dates from May 14 to August 11, 2026, in 9 markets and 1,472 properties.
Metric Definitions Used in This Article
- Listed price: the selling price a property publishes on OTAs and other booking sites. Per-room rate for double occupancy (tax included). All plans are included, from room-only to meal-inclusive. It is not the actual transacted price.
- ADR (average daily rate): an estimated settled rate (tax-excluded equivalent) calculated by applying category-specific adjustment coefficients to the lowest published plan level of each property. Cross-checked against property-level results disclosed by listed hotel REITs, the median error is 7.5% (6.0% for business and city hotel categories; the cross-check covers 184 property-months for April to May 2026 — a “property-month” is the cumulative count of property × disclosure month, not a property count). These are estimates and differ from each property’s actual transacted prices and accounting figures. Area-level ADR is the median across the covered properties.
- Round-number crossing index: for a given price line (e.g. ¥20,000), the ratio of the count in the band just above (¥20,001–20,499) to the count in the band just below (¥19,500–19,999), normalized by the median of the same ratio calculated at the six surrounding thousand-yen lines (¥17,000–19,000 and ¥21,000–23,000). A value of 1.00 means “as easy to cross as an ordinary thousand-yen line”; below 1.00 means prices are piling up just short of that line.
- Data source: MetroEngines Research
- — 43.96% of listed prices land exactly on a hundred-yen unit. Adding records that become a hundred-yen unit once converted to tax-excluded terms, and removing the overlap, the figure reaches 49.15% (N=29,245,493 records / 1,472 properties).
- — Nationwide, the round-number crossing index is 0.96 at ¥10,000, 1.07 at ¥15,000, 0.96 at ¥20,000 and 1.01 at ¥30,000. Round numbers are not functioning as walls.
- — The more consistent habit sits inside each thousand-yen band. 53.34% of prices cluster in the lower half, ¥X,000–X,499, leaving 46.66% in the upper half.
- — By market, ¥10,000 falls below an index of 1.00 in 6 of 7 markets (all but Naha), and ¥20,000 in 5 markets. That gap is what remains as headroom for “one more step”.
- — The ratio of estimated settled ADR to listed price runs 0.39–0.56 (average of May–July 2026, 9 prefectures). Raise the listed price by ¥1,000 and only ¥390–¥560 survives into realized rates.
44% of listed prices sit exactly on a hundred-yen unit
Start with the distribution of the last three digits. Of the 29,245,493 records, prices ending in “00” — that is, exactly on a hundred-yen unit — numbered 12,855,810, or 43.96% of the total. Prices ending in “000”, exactly on a thousand-yen unit, numbered 3,165,721, or 10.82%. If prices were spread uniformly between ¥0 and ¥199,999, exact thousands would appear roughly 0.1% of the time; the observed figure is about 100 times that. Pricing is strongly pulled toward round numbers.
Bundling the last three digits into ten buckets of 100 yen makes that pull even clearer. The ¥X,000–X,099 bucket stands out at 16.36%, followed by the ¥X,600s (10.81%), ¥X,800s (10.65%), ¥X,400s (10.62%) and ¥X,200s (10.51%) — the even hundreds. The odd hundreds (¥X,100 / X,300 / X,700 / X,900) all stay in the 7.8–8.1% range.
Source: compiled by the HotelBank Editorial Team from MetroEngines Research (N=29,245,493 records / 1,472 properties)
That said, it is too early to read this entire distribution as deliberate intent on the hotel side. Listings are displayed tax-inclusive, and adding consumption tax to a tax-excluded set price itself generates odd endings. In fact, on top of the 43.96% whose listed price is already on a hundred-yen unit, another 11.51% of records land on a hundred-yen unit once converted to tax-excluded terms; removing the overlap and combining the two gives 49.15% — roughly half of all listed prices are aligned to a hundred-yen unit in either tax-inclusive or tax-excluded terms. Many seemingly awkward prices such as “¥21,560” are the result of taking ¥9,800 tax-excluded per person, converting to two people and adding tax. Booking-site display rules and rounding also come into play, so the appearance of the ending alone cannot tell you whether the pricing is well or badly executed.
Prices lean to the lower half of each thousand-yen band — a 53.3% skew
Next, look at which side of the thousand-yen line prices land on. Records whose last three digits fall in the “lower half”, 000–499, numbered 15,600,990, or 53.34%; the “upper half”, 500–999, accounted for 13,644,503, or 46.66%. The gap is 6.7 points. Because the distribution of lodging prices thins out above roughly ¥15,000, the lower half of each thousand-yen band would naturally be somewhat more populated anyway. Even after discounting that natural slope, however, the concentration in ¥X,000–X,499 is unmistakable.
This skew shows up as a waveform when you take the ratio of counts just above and just below each ¥500 boundary. The chart below computes that ratio for 71 boundaries from ¥5,000 to ¥40,000. At exact thousand-yen boundaries (¥14,000 to ¥18,000) the ratio runs high at 0.89–1.00, while at five-hundred-yen boundaries (¥14,500 to ¥18,500) it drops to 0.79–0.82, tracing a regular zigzag. In other words, prices do not “stop just short of the thousand-yen wall” — they tend to land just above the thousand-yen line, in ¥X,000–X,499.
Source: compiled by the HotelBank Editorial Team from MetroEngines Research (red dots = the four round-number lines at ¥10,000 / 15,000 / 20,000 / 30,000)
The median ratio across all boundaries is 0.866. That level already incorporates the natural decline in volume at higher prices, so 0.866 serves as the baseline for “how easy an ordinary price boundary is to cross”. From here on, we index each round number against that baseline to compare how much easier or harder it is to cross.
Round numbers are not walls — with ¥10,000 and ¥20,000 the exceptions
For the four round-number lines, we calculated a “round-number crossing index”: the ratio of counts just above (¥X,001–X,499) to just below (¥X-500–X,999), divided by the median of the same ratio at the six surrounding thousand-yen lines. Nationwide, ¥10,000 comes in at 0.96, ¥15,000 at 1.07, ¥20,000 at 0.96 and ¥30,000 at 1.01. All fall within ±7% of 1.00, so there is little evidence that round numbers act as special walls. Lodging listed prices do not carry the strong “just-under” convention of retail’s ¥980 or ¥1,980.
Break it down by market, though, and differences appear. The index at ¥10,000 falls below 1.00 in all six markets other than Naha (1.17), led by Sapporo at 0.89, Central Tokyo at 0.91 and Osaka City at 0.93. At ¥20,000, five markets sit below 1.00: Osaka City 0.88, Sapporo 0.91, Nagoya 0.93, and Central Tokyo and Fukuoka (both 0.96). Conversely, ¥15,000 clears 1.00 in all seven markets at 1.01–1.18, and ¥30,000 is roughly level at 0.96–1.08.
Source: compiled by the HotelBank Editorial Team from MetroEngines Research
| Market | Properties | Records | Median listed price | Ending in 00 | Ending in 000 | Lower half of thousand band |
|---|---|---|---|---|---|---|
| Central Tokyo (5 km radius) | 374 | 7,228,467 | ¥27,000 | 39.5% | 8.9% | 52.3% |
| Osaka City (5 km radius) | 238 | 5,307,157 | ¥17,400 | 43.6% | 10.9% | 53.3% |
| Kyoto City (5 km radius) | 203 | 3,653,786 | ¥24,600 | 42.5% | 10.6% | 53.8% |
| Sapporo (4.5 km radius) | 111 | 3,562,524 | ¥28,000 | 51.3% | 14.2% | 54.8% |
| Fukuoka (4.5 km radius) | 145 | 3,104,879 | ¥24,800 | 46.4% | 11.8% | 53.6% |
| Nagoya (4.5 km radius) | 116 | 2,294,982 | ¥19,400 | 47.1% | 11.0% | 53.2% |
| Naha (5 km radius) | 87 | 2,282,761 | ¥18,500 | 39.0% | 7.9% | 52.0% |
| Hakone (9 km radius) | 125 | 1,358,931 | ¥66,900 | 45.1% | 11.4% | 53.9% |
| Kusatsu Onsen (5 km radius) | 73 | 452,006 | ¥50,600 | 62.4% | 21.4% | 60.2% |
Source: compiled by the HotelBank Editorial Team from MetroEngines Research (check-ins May 14 – August 11, 2026)
What stands out in the table is Kusatsu Onsen. Its 62.4% share ending in 00 and 21.4% ending in 000 are both the highest of the nine markets, and its 60.2% share in the lower half of the thousand-yen band is equally exceptional. Despite a high median listed price of ¥50,600, prices are strongly aligned to ¥1,000 increments. Two-meal ryokan plans are often designed in large units such as “¥50,000” or “¥55,000”, and that shows up in the digits. At the other end, Central Tokyo (39.5%) and Naha (39.0%) have the lowest shares ending in 00, suggesting that day-by-day price movement is well established there.
Note that because Hakone and Kusatsu Onsen sit in a high price range, very few records fall in the bands immediately above and below ¥10,000 and ¥15,000 (N=38 around ¥10,000 in Hakone; N=1,323 around ¥15,000 in Kusatsu Onsen). Indices from thin samples swing wildly, so we did not calculate ¥10,000 and ¥15,000 for those two areas and excluded them from comparison. Hakone comes in at 1.05 for ¥20,000 and 1.12 for ¥30,000 (N=9,911), and Kusatsu Onsen at 1.38 for ¥20,000 (N=3,949) — resorts and onsen areas clear round numbers more readily than urban markets. Kusatsu Onsen’s ¥30,000, by contrast, is low at 0.69 (N=5,116), suggesting that ¥30,000 may function as a practical dividing line in that market.
By category — business hotels clear ¥15,000 more smoothly than average
Aggregating the same index by category, business hotels (1,004 properties, 19,494,316 records) register 0.96 at ¥10,000, 1.07 at ¥15,000, 0.97 at ¥20,000 and 1.04 at ¥30,000. At ¥15,000 and ¥30,000 they beat the baseline, meaning the business category extends pricing into higher bands without resistance. City hotels (171 properties) come in at 0.90 for ¥20,000 and 0.91 for ¥30,000, the most likely of the four categories to have prices stall just below a round number.
Source: compiled by the HotelBank Editorial Team from MetroEngines Research
Ryokan (275 properties) and resorts (22 properties) show high indices of 1.14–2.00 at ¥10,000 and ¥15,000, but that reflects thin coverage — 3,325 records around ¥10,000 and 5,603 around ¥15,000 for ryokan, and 5,049 and 9,013 for resorts — so the figures cannot be used for ranking. At ryokan, where two meals are standard, the low price bands closest to room-only pricing barely exist, and ¥10,000 sits in the tail of the distribution. These are best treated as reference values.
Property cases: how many of the 90 days cleared ¥20,000
Drop the aggregation to the property level and differences in operating style emerge in how round numbers are crossed. Among properties with a median listed price between ¥17,000 and ¥23,500, we show three anonymized cases for which the daily average listed price (a simple average of all plans listed that day) can be traced across all 90 days.
Source: compiled by the HotelBank Editorial Team from MetroEngines Research (3 properties, 90 days each)
| Property (anonymized) | Rooms | Days above ¥20,000 / 90 days | Days within ¥18,500–19,999 | Range of daily averages |
|---|---|---|---|---|
| Property A: Minami-ku, Kyoto City — city hotel | 320 rooms | 79 days | 11 days | ¥18,800–¥40,600 |
| Property B: Nishi-ku, Osaka City — business hotel | 81 rooms | 56 days | 32 days | ¥18,200–¥33,200 |
| Property C: Chuo-ku, Osaka City — business hotel | 210 rooms | 25 days | 20 days | ¥15,700–¥41,800 |
Source: compiled by the HotelBank Editorial Team from MetroEngines Research (check-ins May 14 – August 11, 2026)
Property A’s daily average exceeded ¥20,000 on 79 of the 90 days, reaching as high as ¥40,600. This is pricing that barely acknowledges the round number as a boundary. Property C, by contrast, cleared ¥20,000 on only 25 days, with another 20 days landing in the ¥18,500–19,999 band. Yet the same property also reached ¥41,800 on its peak day, so it is not that it cannot raise prices — it is choosing when to do so. There is headroom here to push prices one step past the round number on days when demand is strong.
The pattern seen at Property B — 32 of 90 days sitting in ¥18,500–19,999 — is widely observed among urban business-category hotels. Moving even a few of those days into the ¥20,000s builds rate while holding occupancy. Put the other way, the markets and categories whose index sits below 1.00 are precisely the ones where that “one more step” still shows up in the numbers. For the width of the daily pricing band itself — how far a property can swing its price from day to day — we compared areas and categories in Japan Autumn 2026 Hotel Price Range: 3.3x CV Gap Across 47 Prefectures.
Where a listed-price round number lands in realized rates
Everything so far concerns listed prices, and a listed price is not a transacted price. Because unsold high-band plans stay listed, and because the definition here is a two-person, all-plan average, average listed prices run above actual settled rates. Comparing them against estimated settled ADR makes that distance visible.
Source: compiled by the HotelBank Editorial Team from MetroEngines Research (average of May–July 2026; estimated settled ADR covers 440–1,139 properties per prefecture)
Averaged over May to July 2026, the ratio of estimated settled ADR (tax-excluded equivalent) to listed price (all-plan average, tax included) is highest in Osaka at 0.558 and Tokyo at 0.559, and lowest in Gunma at 0.395, Kanagawa at 0.406 and Hokkaido at 0.415. Overall the range is 0.39–0.56. In other words, a listed-price round number of ¥20,000 corresponds to roughly ¥8,000–¥11,000 in realized settled rates. A listed ¥20,000 and an estimated settled ADR of ¥20,000 — cross-checked against REIT disclosures — are entirely different heights, and the two cannot be discussed side by side.
Turned around, clearing one round number on the listing only leaves about 40–50% of that increase in realized rates. That is exactly why, in markets where prices pile up just short of a round number, it is worth checking from the settled-ADR side how much of that upside actually survives. Moving a listing from ¥19,800 to ¥20,800 passes roughly ¥390–¥560 through to realized rates — small on a per-room, per-night basis, but equivalent to ¥2.81M–¥4.03M for 100 rooms at 80% occupancy over 90 days.
Sensitivity — what “one more step” actually leaves behind
Using two axes — the size of the listed-price increase and the ratio of estimated settled ADR to listed price (the pass-through ratio) — the incremental revenue for 100 rooms at 80% occupancy over 90 days works out as follows. The pass-through ratios are taken directly from the nine prefectures used in this article and assigned to three levels (conservative 0.39 = Gunma level; mid 0.44 = the 0.437 median across the nine prefectures; upside 0.56 = Osaka level).
| Listed-price increase | Conservative pass-through 0.39 | Mid pass-through 0.44 | Upside pass-through 0.56 |
|---|---|---|---|
| +¥500 | ¥1.40M | ¥1.57M | ¥2.02M |
| +¥1,000 (¥19,800 → ¥20,800) | ¥2.81M | ¥3.15M | ¥4.03M |
| +¥2,000 | ¥5.62M | ¥6.29M | ¥8.06M |
Source: compiled by the HotelBank Editorial Team from MetroEngines Research (pass-through ratios are averages for May–July 2026; 440–1,139 properties per prefecture)
For the same increase, the amount that survives into realized rates differs by up to 1.4x depending on the market. The markets whose index sits below 1.00 have the most headroom for “one more step”, but how much revenue that step delivers depends on the pass-through ratio of that market. Before moving listed prices, it is worth confirming where your own market sits among these three levels.
Conclusion — the habit lies in the lower half of the thousand-yen band, not at the round-number wall
Three things emerge from 29,245,493 listed prices. First, pricing is strongly pulled toward round numbers: 43.96% of listed prices sit exactly on a hundred-yen unit and 10.82% on a thousand-yen unit, and including tax-excluded conversions, 49.15% align to a hundred-yen unit. Second, the round numbers themselves are not functioning as walls. Nationwide, the crossing index at ¥10,000, ¥15,000, ¥20,000 and ¥30,000 lands between 0.96 and 1.07 — barely different from an ordinary thousand-yen line. Third, the more consistent habit lies inside the thousand-yen band: 53.34% of prices cluster in the lower half at ¥X,000–X,499, leaving 46.66% in the upper half at ¥X,500–X,999.
By market, ¥10,000 fell below 1.00 in six markets — all but Naha — and ¥20,000 in Osaka City, Sapporo, Nagoya, Central Tokyo and Fukuoka. There, headroom remains to push prices one step higher. At the same time, ¥15,000 clears 1.00 in every market, and ¥20,000 in resort and onsen areas runs 1.05–1.38, so plenty of markets are already pricing across the round number. The reality is less “they cannot cross it” than “the markets that cross it and those that do not are clearly divided”.
To put this into practice, start by lining up 90 days of your own property’s last three digits. What share falls in ¥X,000–X,499? How many days are stuck at a specific price such as ¥19,800 or ¥14,800? That distribution is the record left behind by the accumulation of daily decisions, and the starting point for designing the next step up.
Related Reading
- Weekend Premium 2026: Tokyo Business 24% vs Hakone Ryokan 10%, N=659
- Kyoto Reviews vs Settled ADR: Bathroom 4.002 Weakest, July ¥17,420
- Saitama Hotel Rates Vary 4.8x by Municipality: 35 Areas, 5 Tiers
- Lodging Is 37% of Japan’s ¥2.51T Inbound Spend: ¥10,446 vs Real ADR
- Japan Autumn 2026 Hotel Price Range: 3.3x CV Gap Across 47 Prefectures
- Tokyo Business Hotel ADR 12-Month Trend: 30% Central vs Outer Ward Gap
References and Sources
■ Data sources
Listed prices collected by MetroEngines Research (90 check-in dates from May 14 to August 11, 2026; 9 markets, 1,472 properties; N=29,245,493 records). Coverage is double occupancy, tax included, all plans, limited to records above ¥0 and below ¥200,000. Estimated settled ADR is the same firm’s prefecture-level aggregation (May–July 2026; 440–1,139 properties per prefecture).
■ Calculation assumptions
The round-number crossing index is the ratio of the count in the band just above (¥X,001–X,499) to the count in the band just below (¥X-500–X,999), normalized by the median of the same ratio calculated at the six surrounding thousand-yen lines. The incremental revenue calculation sets the ratio of estimated settled ADR to listed price (the pass-through ratio) at three levels — conservative 0.39, mid 0.44 and upside 0.56 — and multiplies by representative conditions of 100 rooms, 80% occupancy and 90 days. It is not a revenue forecast for any specific property.
■ Limitations and caveats
All analysis here is based on listed prices, not transacted prices. Listings are shown tax-inclusive, so odd endings arise when consumption tax is added to a tax-excluded set price, and booking-site display rules and rounding also apply. The appearance of the ending alone cannot tell you whether pricing is well or badly executed. Bands with thin samples (such as N=38 around ¥10,000 in Hakone) swing widely and were excluded from comparison. Estimated settled ADR has a median error of 7.5% against property-level results disclosed by listed hotel REITs, and 6.0% for the business and city hotel categories (the cross-check covers 184 property-months for April to May 2026; a “property-month” is the cumulative count of property × disclosure month, not a property count).
■ Market data
- MetroEngines Research — listed-price data (check-ins May 14 – August 11, 2026; 9 markets, 1,472 properties; N=29,245,493 records) and estimated settled ADR (May–July 2026)
■ Public statistics and external references
- Japan Tourism Agency, “Overnight Travel Statistics Survey”
- Statistics Bureau of Japan, “Consumer Price Index” (accommodation charges index)
- The appeal and effect of charm pricing: a full picture of pricing strategy using consumer psychology (Will Links Inc.)
- Psychological pricing methods (Globalance)