

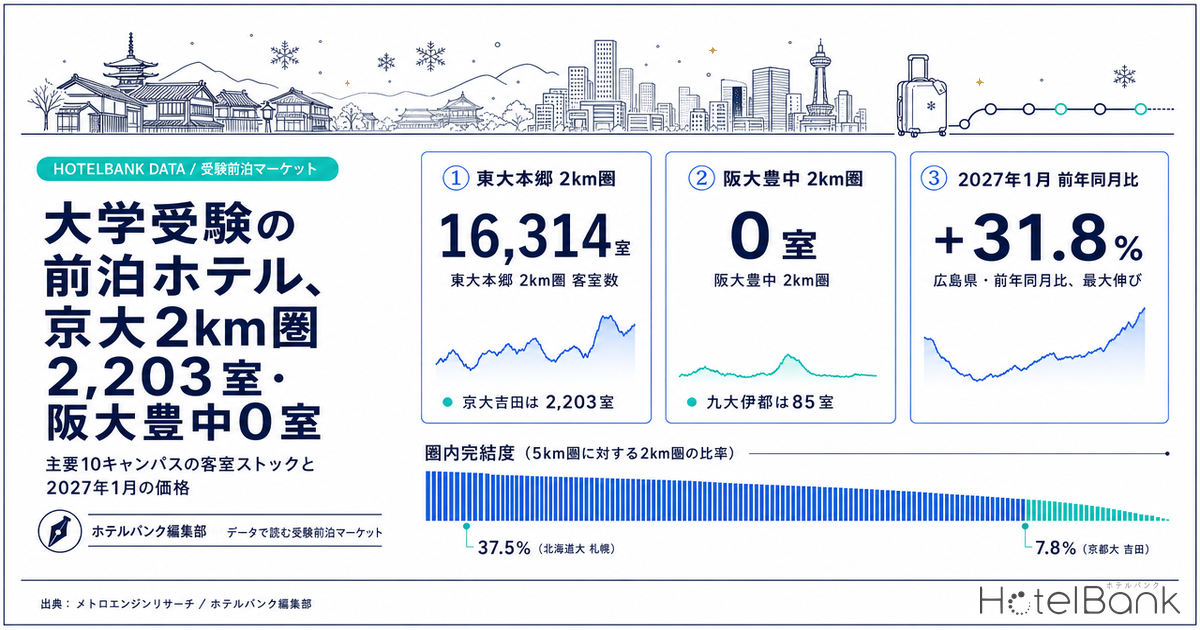
Japan’s 2027 Common Test for University Admissions (大学入学共通テスト) will be held on Saturday, January 16 and Sunday, January 17, 2027. For applicants and their families, securing accommodation for those two nights — and again for the national-university second-stage exams that follow — is a recurring practical problem. Yet the assumption that you can “stay near campus” does not actually hold for most campuses. This article inventories the actual room stock within 2km and 5km of ten major campuses, and examines how January rates behave, using both last year’s realized figures and the currently listed levels for January 2027.
Metric Definitions Used in This Article
- ADR (average daily rate): an estimated transacted rate (tax-excluded equivalent), calculated by applying category-specific adjustment coefficients to the lowest published plan rate each property lists on OTAs (double occupancy, per room, tax included). Cross-checked against property-level results disclosed by listed hotel REITs (91 properties, most recent three months), the median error is approximately 7%. These are estimates and differ from each property’s actual transacted rates and accounting figures. Area-level ADR is the median of the properties covered (i.e., the level of a typical property in that area).
- Listed price: the all-plan average of publicly available selling rates on OTAs and similar channels (double occupancy, per room, tax included, covering room-only through meal-inclusive plans). This is the basis used wherever day-by-day movements are shown. Because the basis differs from ADR, do not compare the two figures directly.
- Room stock: the registered room counts of properties tracked by MetroEngines Research and listed as currently operating, aggregated by straight-line distance from each campus’s center coordinates. Unlisted minshuku, simple lodgings and other properties absent from OTAs are not included.
- Data source: MetroEngines Research
- — Room stock within a 2km radius of ten major campuses ranges from 16,314 rooms at the University of Tokyo Hongo down to zero rooms at Osaka University Toyonaka. “Staying near campus” is a realistic option at only some of these campuses.
- — Kyoto University Yoshida has 139 properties within 2km, but only 2,203 rooms (15.8 rooms per property). Just 11 properties — 8% of the total — have 50 rooms or more: a high property count does not mean substantial room stock.
- — In the January 2026 results, no prefecture-level rate spike is observed over the Common Test weekend. What moved rates was the day of the week: the Friday-to-Saturday step was roughly ¥6,000 in Kyoto and ¥6,300 in Osaka.
- — Where January sits in the annual cycle flips by city. Kyoto is a trough at -46.8% versus its peak (November 2025), while Hokkaido’s January ranks fifth-highest of the last 12 months and Miyagi’s ranks second-highest.
- — Listed levels for January 2027 run +4% to +32% year on year. Hiroshima (+31.8%), Aichi (+28.9%) and Hokkaido (+28.1%) show the largest increases; Kyoto (+6.0%) and Hyogo (+4.1%) are moderate.
Fix the dates first — January 16 and 17, 2027
Any accommodation plan starts with the calendar. Rather than working from assumption, it is worth pinning the dates down against primary sources.
| Category | Date | Source |
|---|---|---|
| Common Test — main sitting | Sat Jan 16 and Sun Jan 17, 2027 | National Center for University Entrance Examinations |
| Common Test — supplementary / re-sitting | Sat Jan 23 and Sun Jan 24, 2027 | National Center for University Entrance Examinations |
| National universities — general selection application period | Jan 25 – Feb 3, 2027 | Japan Association of National Universities guidelines |
| First-round individual examinations | From February 25, 2027 as day one | Japan Association of National Universities guidelines |
| Second-round individual examinations | March 12, 2027 onward | Japan Association of National Universities guidelines |
Source: National Center for University Entrance Examinations; Japan Association of National Universities, “Guidelines for 2027 National University Admissions” (June 25, 2025)
The nights that generate pre-exam stays are Friday January 15 and Saturday January 16 — or Friday January 22 and Saturday January 23 for the supplementary sitting. For the first round, each university sets its own examination dates using February 25 as day one, so actual test days fall somewhere around February 25–27 depending on the faculty. Because individual dates are only confirmed in each university’s application guidelines, families should check their target university’s official announcement before committing to a booking. This article therefore centers on the Common Test period in January, the one window fixed nationwide.
Room stock within 2km of campus — 2,203 rooms at Kyoto, zero at Osaka Toyonaka, 85 at Kyushu Ito
For each of the ten campuses, we counted operating properties and their registered rooms within 2km and 5km of the campus center coordinates. The results split sharply.
| Campus | Properties <2km | Rooms <2km | of which 50+ rooms | Properties <5km | Rooms <5km | 2km/5km |
|---|---|---|---|---|---|---|
| Univ. of Tokyo, Hongo | 154 | 16,314 | 105 | 664 | 67,913 | 24.0% |
| Hokkaido Univ., Sapporo | 59 | 9,255 | 46 | 179 | 24,686 | 37.5% |
| Kyoto Univ., Yoshida | 139 | 2,203 | 11 | 1,347 | 28,242 | 7.8% |
| Osaka Univ., Suita | 2 | 120 | 1 | 11 | 891 | 13.5% |
| Nagoya Univ., Higashiyama | 1 | 77 | 1 | 23 | 2,494 | 3.1% |
| Tohoku Univ., Kawauchi | 1 | 25 | 0 | 89 | 11,889 | 0.2% |
| Hiroshima Univ., Higashi-Hiroshima | 1 | 23 | 0 | 15 | 1,391 | 1.7% |
| Kobe Univ., Rokkodai | 2 | 22 | 0 | 45 | 4,325 | 0.5% |
| Osaka Univ., Toyonaka | 0 | 0 | 0 | 24 | 1,906 | 0.0% |
| Kyushu Univ., Ito | 1 | 85 | 1 | 3 | 406 | 20.9% |
Source: MetroEngines Research; compiled by the HotelBank Editorial Team (straight-line distance from campus center coordinates, operating properties only, N=10 campuses)
Source: MetroEngines Research; compiled by the HotelBank Editorial Team
The first thing that stands out is that not a single operating lodging property exists within 2km of Osaka University’s Toyonaka campus. Within 2km of Kyushu University’s Ito campus there is only one property — Glocal Hotel Itoshima (グローカルホテル糸島), 85 rooms, immediately outside the campus south gate — and widening to 5km adds only three properties and 406 rooms in total. Ito is a greenfield site developed in stages from 2005 onward, and lodging supply has yet to catch up. Toyonaka sits in a residential district on the Senri hills, where land zoned for lodging is essentially absent. At these two campuses, the option of “staying nearby” is severely limited.
Kyoto University’s Yoshida campus needs to be read carefully. Its 139 properties within 2km rank second among the ten campuses, but the room count is 2,203 — just 15.8 rooms per property. Only 11 properties, 8% of the total, have 50 rooms or more. The Sakyo and Higashiyama wards of Kyoto are dense with small machiya-conversion lodgings: plenty of properties, thin aggregate room stock. That composition is poorly suited to exam-specific requirements such as putting three or four people in one room, or adding a room at short notice. This supply structure is why a search for “Kyoto University exam hotel” ends up pointing at the area around Kyoto Station.
Hokkaido University’s Sapporo campus is the opposite case. Within 2km there are 9,255 rooms, of which 46 properties have 50 rooms or more — large-format supply sits inside the radius. Of all rooms within 5km, 37.5% fall inside the 2km ring, the highest self-containment ratio of the ten campuses. The fact that the campus’s southern edge abuts the north side of Sapporo Station shows up directly in the numbers.
Source: MetroEngines Research; compiled by the HotelBank Editorial Team
Campuses and the distribution of room stock
Source: MetroEngines Research; compiled by the HotelBank Editorial Team (circle size = rooms within a 5km radius)
In practice people stay at the nearest terminal — station scale as a proxy for capacity
Where a campus has no rooms within 2km, real pre-exam demand shifts to the area around the nearest terminal station. Terminal scale doubles as an indicator of both morning transport capacity and the depth of lodging supply. Ranking each campus’s nearest terminal by daily passenger volume from the Ministry of Land, Infrastructure, Transport and Tourism (MLIT) station data (latest published year) gives the following.
| Campus | Nearest terminal | Daily boardings + alightings |
|---|---|---|
| Osaka Univ., Toyonaka & Suita | Osaka Station (JR West) | 734,838 |
| Nagoya Univ., Higashiyama | Nagoya Station (JR Central) | 397,411 |
| Kyoto Univ., Yoshida | Kyoto Station (JR West) | 329,424 |
| Kyushu Univ., Ito | Hakata Station (JR Kyushu) | 239,124 |
| Kobe Univ., Rokkodai | Sannomiya Station (JR West) | 231,870 |
| Tohoku Univ., Kawauchi | Sendai Station (JR East) | 178,924 |
| Hokkaido Univ., Sapporo | Sapporo Station (JR Hokkaido) | 168,030 |
| Osaka Univ., Toyonaka (campus-nearest) | Ishibashi-handaimae Station (Hankyu) | 36,184 |
| Hiroshima Univ., Higashi-Hiroshima | Saijo Station (JR West) | 17,782 |
Source: MLIT Real Estate Information Library (National Land Numerical Information, “Station Passenger Volumes”); compiled by the HotelBank Editorial Team
Ishibashi-handaimae, the station nearest Osaka University Toyonaka, handles 36,184 passengers a day — one twentieth the scale of Osaka Station. That is not a volume around which lodging supply accumulates. Indeed, most of the 1,906 rooms within 5km of the Toyonaka campus are scattered toward Shin-Osaka and Esaka. For a Toyonaka sitting, the practical answer is to stay at a central Osaka terminal such as Umeda or Shin-Osaka and travel in on the day.
Saijo Station, serving Hiroshima University’s Higashi-Hiroshima campus, is smaller still at 17,782 passengers, yet 15 properties and 1,391 rooms sit within 5km of the campus. In regional university towns, a modest terminal can still support a base of business-hotel stock generated by university and industrial-park demand. Station size alone is a poor filter; supply should be checked at the municipal level. The broader question of how thick room stock is relative to passenger volume is one we have examined across major terminals nationwide, and the pattern there is the same: passenger volume and room stock are only loosely coupled.
January rates move with the day of the week, not the exam date — last year’s daily figures
Next, rates. Start with what actually happened: daily listed prices for January 2026, when the Common Test was held on January 17 and 18. Day-level movement is invisible in monthly aggregates, so the prior-year curve serves as the proxy evidence.
Source: MetroEngines Research; compiled by the HotelBank Editorial Team (listed price, all-plan average, double occupancy, tax incl.; Kyoto N=1,445–1,582 properties / Hokkaido N=1,219–1,379 / Osaka N=831–873 / Miyagi N=365–411)
Comparing Friday January 16 and Saturday January 17, 2026 — the pre-exam nights that year — against the other Fridays and Saturdays in the same month gives the following.
| Prefecture | Fri Jan 16 | January Friday avg. | Diff | Sat Jan 17 | January Saturday avg. | Diff |
|---|---|---|---|---|---|---|
| Osaka | ¥26,300 | ¥25,000 | +5.3% | ¥31,800 | ¥31,300 | +1.5% |
| Hokkaido | ¥34,700 | ¥33,800 | +2.5% | ¥39,100 | ¥38,000 | +2.7% |
| Kyoto | ¥35,500 | ¥35,500 | ±0.0% | ¥40,900 | ¥41,500 | -1.4% |
| Miyagi | ¥24,500 | ¥25,000 | -2.0% | ¥30,000 | ¥32,400 | -7.5% |
Source: MetroEngines Research; compiled by the HotelBank Editorial Team (listed price, all-plan average, double occupancy, tax incl.; January 2026 actuals. Fridays = Jan 9, 16, 23, 30; Saturdays = Jan 10, 17, 24, 31)
There is no evidence of prefecture-level rate spikes over the Common Test weekend. Osaka’s Friday is marginally higher at +5.3%, Kyoto is essentially flat, and Miyagi is actually cheaper than its other weekends. What moved rates in January 2026 was the day of the week. The Friday-to-Saturday step was roughly ¥6,000 in Kyoto, ¥4,200 in Hokkaido and ¥6,300 in Osaka — an effect far larger than any exam-date factor.
For applicants and families, that is reassuring. City-wide rate levels move far less than the common perception that “rooms are impossible to get, and expensive, on Common Test weekend” would suggest. But a flat prefecture average is a different question from whether a specific property within walking distance of your target university still has availability. As shown above, at thin-supply campuses such as Kyoto Yoshida or Osaka Toyonaka the denominator is small, so individual properties fill early. Rather than taking comfort from an area average, the practical sequence is to decide the location you want first, then book.
Cities where January eases, and cities where it does not — Kyoto is 46.8% below November
Stepping back one level, where does January sit within the annual cycle? Overlaying Kyoto’s estimated transacted ADR by year makes it clear that January is a distinct trough.
Source: MetroEngines Research; compiled by the HotelBank Editorial Team (estimated transacted ADR, tax-excluded equivalent, Kyoto)
Kyoto’s estimated transacted ADR for January 2026 was ¥13,200 — fourth from the bottom across the last 12 months (August 2025 to July 2026) and 46.8% below the November 2025 peak of ¥24,800. That is a little over half the autumn-foliage level. The same shape appears in Tokyo (-26.0% from peak) and Osaka (-30.9%). In cities driven by leisure demand, January is one of the softest months of the year.
Hokkaido, by contrast, has the opposite profile.
Source: MetroEngines Research; compiled by the HotelBank Editorial Team (estimated transacted ADR, tax-excluded equivalent, Hokkaido)
Hokkaido’s January 2026 figure of ¥10,300 ranks fifth-highest across the last 12 months (August 2025 to July 2026). Winter leisure demand loads heavily onto January and February, so January is not a trough. Miyagi’s January 2026 level of ¥10,400 likewise ranks second-highest over the last 12 months, close to the August 2025 high of ¥10,600. Families planning a pre-exam stay for Hokkaido University should assume they are not booking into a cheap season.
Listed levels for January 2027 — currently +4% to +32% year on year
Everything above is history. What about January 2027? Below, levels estimated from selling rates published on OTAs as of the survey date are set alongside the January 2026 actuals.
Source: MetroEngines Research; compiled by the HotelBank Editorial Team (estimated transacted ADR, tax-excluded equivalent. January 2026 is actual; January 2027 is estimated from listings as of the survey date. Properties covered: Jan 2026 N=285–1,111; Jan 2027 N=203–924)
| Prefecture (main campus) | Jan 2026 actual | Jan 2027 estimate | YoY |
|---|---|---|---|
| Hiroshima (Hiroshima Univ., Higashi-Hiroshima) | ¥7,900 | ¥10,400 | +31.8% |
| Aichi (Nagoya Univ., Higashiyama) | ¥8,600 | ¥11,100 | +28.9% |
| Hokkaido (Hokkaido Univ., Sapporo) | ¥10,300 | ¥13,200 | +28.1% |
| Osaka (Osaka Univ., Toyonaka & Suita) | ¥9,500 | ¥10,800 | +13.9% |
| Fukuoka (Kyushu Univ., Ito) | ¥12,000 | ¥13,300 | +10.4% |
| Tokyo (Univ. of Tokyo, Hongo) | ¥13,200 | ¥14,200 | +7.6% |
| Kyoto (Kyoto Univ., Yoshida) | ¥13,200 | ¥14,000 | +6.0% |
| Miyagi (Tohoku Univ., Kawauchi) | ¥10,400 | ¥11,000 | +5.8% |
| Hyogo (Kobe Univ., Rokkodai) | ¥14,600 | ¥15,200 | +4.1% |
Source: MetroEngines Research; compiled by the HotelBank Editorial Team
The largest increases are in Hiroshima, Aichi and Hokkaido — all prefectures whose January 2026 levels were relatively low, now catching up from below amid a nationwide rate-increase phase. Kyoto (+6.0%) and Hyogo (+4.1%), by contrast, are rising only modestly; for January, rates there remain settled.
It is worth looking at the municipal level nearest each campus as well. For January 2027, Toyonaka is at ¥9,500 (N=3 properties), Suita at ¥8,400 (N=8) and Higashi-Hiroshima at ¥9,700 (N=9) — all below their prefectural averages. Because the property counts are in single digits these are indicative figures only, but the pattern is readable: the small number of properties around suburban campuses run at lower rates than central terminals.
Where "exam / away-trip" shows up in reviews is not around campuses
Classifying guest reviews with natural-language processing and counting mentions that fall into an “exam / away-trip” category produces a striking skew. The classifier is designed to capture both university entrance exams and travel for sports tournaments or competitions, and the properties at the top are not near universities — they are next to competition venues.
| Prefecture | Property with the most mentions | Mentions | Share of all reviews |
|---|---|---|---|
| Tokyo | Tokyo Dome Hotel (東京ドームホテル) | 121 | 3.23% |
| Hyogo | Hotel Hewitt Koshien (ホテルヒューイット甲子園) | 63 | 3.33% |
| Osaka | Hotel New Otani Osaka (ホテルニューオータニ大阪) | 61 | 2.01% |
| Fukuoka | Hilton Fukuoka Sea Hawk (ヒルトン福岡シーホーク) | 58 | 3.22% |
| Hokkaido | Hotel Emisia Sapporo (ホテルエミシア札幌) | 15 | 0.88% |
| Kyoto | Kyoto Brighton Hotel (京都ブライトンホテル) | 5 | 0.24% |
Source: HotelBank Editorial Team analysis (NLP classification of guest reviews, last 24 months, minimum 5 mentions, positive-sentiment subset)
Tokyo’s leader sits beside Tokyo Dome, Hyogo’s beside Koshien, Fukuoka’s beside the dome — venue-adjacent properties dominate. In Kyoto only one property met the threshold at all, with a mention share of just 0.24%. That does not mean Kyoto has no pre-exam demand; it means pre-exam stays are unlikely to be written up in reviews as “stayed here for an exam.” A single night, a rating left without stating the purpose — those behavioral traits are the likely explanation.
The operational implication matters: exam demand is hard to detect from review data. Because it barely surfaces in reviews, it is more reliably captured from the booking side — lead time, length of stay, party composition. That is a different character from sports-competition demand, which reviews do make visible. The standalone value of venue-adjacent locations is something we have examined separately across areas nationwide, and the same concentration around competition venues holds there.
What works during exam season, by property type
Taking supply structure and pricing together, what gets a property chosen during exam season varies by type. For operators, this is also where the revenue opportunity sits.
| Property type | What works during exam season | Campus areas where this applies |
|---|---|---|
| Terminal-area business hotels | Early breakfast service or takeaway option; walking minutes to the station stated explicitly; first-train information toward the exam venue posted on site | Kyoto Station; Umeda / Shin-Osaka; Hakata; Nagoya |
| Mid-sized hotels close to campus | Quiet rooms (circulation noise between floors, HVAC noise); desk lighting and desk size; later checkout | Sapporo Station north exit; Hongo / Suidobashi; central Higashi-Hiroshima |
| City hotels | Triples and twin-plus-extra-bed configurations for students travelling with a parent; a breakfast flow that stays entirely inside the building | Sannomiya; Sendai Station; Sapporo Station |
| Small lodgings and machiya-style properties | State maximum occupancy per building and per room; surface multi-guest single-room availability up front | Around Kyoto Univ. Yoshida |
In areas like Kyoto, where small properties cluster, “how many people can share one room” is the first filter an exam-season family applies. The structure — only 11 of 139 properties within 2km having 50 rooms or more — is, read the other way, a market full of small-party accommodation. Stating occupancy limits up front converts directly into booking upside.
In areas like Sapporo, where large properties sit inside the campus radius, quiet rooms and the morning routine become the differentiators. January in Hokkaido is not a month when rates soften, so there is room to be chosen by exam-season families while holding rate. Within Hokkaido, operators have also been reported designing exam-support plans timed around major event periods.
On the wider question of spreading demand across seasons, we have covered the pressure to disperse school-trip timing in School Trip Timing Dispersion vs Hotel Price Surge, and the weekday demand generated by academic meetings in 493 Medical Conferences in Japan: 75.7% of Nights Fall Wed-Fri. For the structure of rate gaps within a prefecture, see Intra-Prefecture ADR Gaps 2026.
Conclusion
What the inventory of ten major campuses shows is that “staying near campus” is realistic at only a few of them. Hokkaido University Sapporo (9,255 rooms within 2km) and the University of Tokyo Hongo (16,314) are self-contained, but Osaka University Toyonaka has zero rooms within 2km, Kyushu University Ito has one property with 85 rooms, and Tohoku Kawauchi, Kobe Rokkodai and Hiroshima Higashi-Hiroshima are all in the tens of rooms. Kyoto Yoshida has 139 properties, but only 11 with 50 rooms or more — thin, in terms of aggregate room stock.
On price, the January 2026 record shows no prefecture-level spike over the Common Test weekend. What moves rates is the day of the week. City differences do matter, though: January is the annual trough in Kyoto, Tokyo and Osaka, while in Hokkaido and Miyagi it sits on the high side. Listed levels for January 2027 range from +4% to +32% year on year, with Hiroshima, Aichi and Hokkaido standing out.
The practical conclusion for applicants and families is simple. First determine whether the target campus is self-contained or terminal-dependent; if the latter, move early on the terminal side. Even where area average rates look settled, availability at individual properties is a separate matter in thin-supply campus areas. For operators, exam season is a quiet demand segment that barely registers in reviews — and stating the basics up front (occupancy limits, the morning routine, quiet rooms) leaves real room to capture it.
⚠ Note on ADR for future dates: the January 2027 figures in this article are estimates based on selling rates published on OTAs as of the survey date (August 2026), and will shift as the check-in date approaches. The property count covered for January 2027 is 20–30% smaller than for January 2026, so both levels and composition may change as further listings are added. Individual examination dates are confirmed in each university’s application guidelines, so please check your target university’s official announcement before booking.
Related reading
- School Trip Timing Dispersion vs Hotel Price Surge: June 2026 Alternative Business Hotel ADR
- 493 Medical Conferences in Japan: 75.7% of Nights Fall Wed-Fri
- Intra-Prefecture ADR Gaps 2026: Median 2.74x, Okinawa Widest at 5.86x
- Kyoto Day-of-Week OCC: Thursday 90.4% Edges Friday, May–Jul 2026
- Autumn School Trips: Weekday Rate Floors in 5 Areas, Nagasaki +1.6pt
References and Sources
■ Examination dates (primary sources)
- National Center for University Entrance Examinations, “2027 Common Test for University Admissions — Examination Dates” (in Japanese)
- Japan Association of National Universities, “Guidelines for 2027 National University Admissions” (June 25, 2025; revised June 29, 2026, in Japanese)
- Japan Association of Public Universities, “Guidelines for 2027 Public University Admissions” (September 26, 2025, in Japanese)
- Kyoto University — General Selection (application guidelines, in Japanese)
- Hokkaido University — General Selection (admissions information, in Japanese)
■ Data sources
Room stock is the sum of registered rooms at properties MetroEngines Research & Consulting identifies as currently operating, aggregated by straight-line distance from each campus’s center coordinates into 2km and 5km rings (N=10 campuses, surveyed August 2026). Daily listed prices are all-plan averages for January 5–31, 2026 (double occupancy, per room, tax included), with properties covered by day at Kyoto N=1,445–1,582, Hokkaido N=1,219–1,379, Osaka N=831–873 and Miyagi N=365–411. Estimated transacted ADR is the monthly series of the median across covered properties at prefecture and municipality level (January 2024 – January 2027; January 2026 N=285–1,111 properties / January 2027 N=203–924). Passenger volumes are daily boarding-plus-alighting totals from MLIT’s National Land Numerical Information (“Station Passenger Volumes”), latest published year. Review data is an NLP classification of guest postings (last 24 months, minimum 5 mentions).
■ Calculation assumptions
The 2km and 5km radii are fixed distances approximating the practical range for walking and short transfers from a station or campus; administrative boundaries and actual travel times are not considered. The “2km/5km” column is the ratio of rooms within 2km to rooms within 5km, used as a self-containment indicator. The day-of-week comparison measures each date’s deviation from the simple average of January 2026 Fridays (Jan 9, 16, 23, 30) and Saturdays (Jan 10, 17, 24, 31) respectively, comparing only like weekdays within the same month. January 2027 levels are estimated from selling rates published on OTAs as of the survey date and are not actuals. Estimated transacted ADR applies category-specific adjustment coefficients to the lowest published plan rate each property lists on OTAs and similar channels (double occupancy, per room, tax included); cross-checked against property-level disclosures by listed hotel REITs (91 properties, most recent three months), the median error is approximately 7%.
■ Limitations and caveats
(1) Room stock is limited to operating properties confirmed as listed on OTAs; simple lodgings, minshuku and university-affiliated accommodation absent from OTAs are excluded, which may understate real capacity around regional campuses. (2) Because aggregation uses straight-line distance, actual travel times will differ where rivers, hills or rail lines divide a location. (3) Listed price and estimated transacted ADR use different bases (the former an all-plan average, tax included; the latter an adjusted estimated transacted rate, tax-excluded equivalent), so the two are never compared directly here. (4) A flat prefectural or municipal average does not mean availability can be secured at a specific property. Values for municipalities with single-digit property counts — Toyonaka N=3, Suita N=8, Higashi-Hiroshima N=9 — are indicative only. (5) The property count covered for January 2027 is 20–30% smaller than for January 2026, and both level and composition will shift as further listings are added. (6) The “exam / away-trip” review category covers both entrance examinations and travel for sports and competition events, and the two are not separated. (7) Individual examination dates are confirmed in each university’s application guidelines, so this article is centered on the Common Test period, the one window fixed nationwide.
■ Market data
- MetroEngines Research — room stock aggregation (operating properties, straight-line distance from campus center coordinates); daily listed-price aggregation (January 2026); monthly estimated transacted ADR (January 2024 – January 2027)
- HotelBank Editorial Team analysis — NLP analysis of guest reviews (last 24 months)
■ Government statistics and public data