

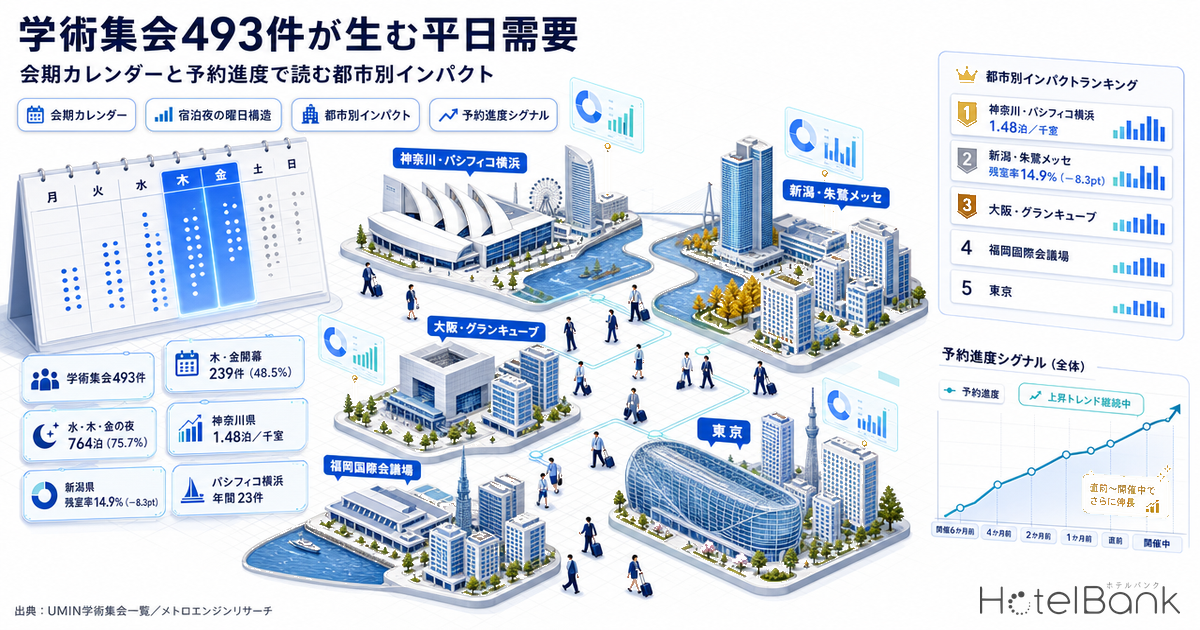
Almost all medical academic conferences in Japan open on a Thursday or a Friday. That means attendees stay on Wednesday, Thursday and Friday nights — precisely the nights that most urban hotels pass through at lower occupancy than the weekend. And unlike most demand drivers, conference dates are published more than a year in advance and the venue is already fixed. There are few sources of weekday demand this easy to work with. This article organizes the conference calendar for the 493 medical academic conferences registered with UMIN (University Hospital Medical Information Network) for fiscal 2026, visualizes the day-of-week structure of the room nights they generate, examines weekday occupancy levels city by city, and tests how the conference signal actually shows up in booking pace.
Metric Definitions Used in This Article
- ADR (average daily rate): An estimated settled rate (tax-exclusive equivalent), calculated by applying category-specific adjustment coefficients to the lowest publicly listed plan level each property shows on OTAs and similar channels (double occupancy, per-room rate, tax-inclusive). Cross-checked against property-level actuals disclosed by listed hotel REITs (91 properties, most recent three months), the median error is approximately 7%. These are estimates and differ from each property’s actual transacted prices or accounting figures. Area-level ADR is the median across the properties covered (the level of a typical property in that area).
- Listed price: The average publicly available selling price for a given check-in date (double occupancy, per-room rate, tax-inclusive, averaged across all plans from room-only through meal-inclusive). This is a separate metric from the monthly estimated settled ADR.
- OCC (occupancy rate): The share of sold rooms against total rooms in the area (an estimate based on OTA-listed inventory). This differs from a property’s actual overall occupancy.
- Remaining-inventory rate: The number of rooms still available in the area at the time of observation, divided by the total room count of the properties covered (room basis).
- LT (lead time): Days remaining until the check-in date. LT90 = 90 days before check-in; LT0 = same day.
- Conference room nights (our estimate): Cumulative nights counted as one night each from the eve of the opening day through the eve of the closing day. A one-day conference counts as one night (the eve); a three-day conference counts as three nights.
- Data sources: MetroEngines Research / UMIN (University Hospital Medical Information Network) list of academic conferences
- — Of the 493 medical academic conferences scheduled for fiscal 2026, 239 (48.5%) open on a Thursday or a Friday. Among the 126 larger conferences running three days or more, 97 open on a Thursday or Friday — 77.0% of that group.
- — Of the 1,009 cumulative room nights these generate, 764 (75.7%) fall on Wednesday, Thursday or Friday nights. Sunday, Monday and Tuesday nights account for just 51 (5.1%).
- — Meanwhile, estimated OCC for urban hotels is lowest on Sunday and Monday check-ins. Academic conferences are not demand that fills the trough — they are demand that adds further thickness to Wednesday through Friday.
- — Measured as conference weekday nights per 1,000 rooms, Kanagawa stands out among large markets at 1.48 nights (Pacifico Yokohama hosts 23 conferences, the most of any venue nationwide). Tokyo at 0.41, Osaka at 0.24 and Aichi at 0.12 sit far below.
- — Across 109 business hotels in Niigata, the remaining-inventory rate at LT50 for the conference opening day (September 11) was 14.9% — 8.3pt below a normal-week Friday. At the same time, listed prices were rising rather than falling.
493 medical conferences open almost exclusively on Thursday and Friday
The UMIN (University Hospital Medical Information Network) conference listing registers 494 academic conferences scheduled between April 2026 and March 2027. We tabulated the opening day of the week for the 493 of those that run seven days or fewer.
The result is unambiguous. 116 open on a Thursday and 123 on a Friday — 239 combined, or 48.5%. Saturday openings follow at 187 (37.9%). Monday and Tuesday openings total only 10. The day of the week on which conferences open is effectively fixed by industry convention, and that convention directly determines the day-of-week structure of the lodging demand they create.
Source: Compiled by the HotelBank Editorial Team from the UMIN (University Hospital Medical Information Network) list of academic conferences (N=493 conferences, fiscal 2026)
Splitting by conference length makes the structure clearer still. Of the 121 single-day conferences, 83 open on a Saturday — these are mostly regional chapters and branch meetings that begin and end over the weekend. By contrast, among the 126 larger conferences running three days or more, 54 open on a Thursday and 43 on a Friday, joined by 17 Wednesday openings and 7 Tuesday openings, pushing the start further into the first half of the week. The larger the national-scale conference — general assemblies and full scientific congresses — the longer the stretch of weekday lodging demand it generates.
76% of the room nights generated concentrate on Wednesday, Thursday and Friday
Next we estimate room nights from the conference dates. Because the standard pattern is for attendees to arrive on the eve of the opening day and depart on the morning of the closing day, we counted room nights as running “from the eve of day one through the eve of the final day.” The 493 conferences generate 1,009 cumulative room nights.
Source: Compiled by the HotelBank Editorial Team from the UMIN conference listing (1,009 cumulative nights, estimated from conference dates)
Friday nights lead at 365, followed by Thursday nights at 257, Saturday nights at 194 and Wednesday nights at 142. Those four days account for 958 nights, or 94.9% of the total. Against that, Sunday nights total 11, Monday nights 12 and Tuesday nights 28 — the head of the week is essentially blank.
This is the central point of the article. The thinnest days for an urban hotel are Sunday and Monday check-ins, yet academic conferences drop almost no demand there. What conferences thicken is Wednesday, Thursday and Friday — already the relatively strong band within the working week. The accurate reading, then, is that academic conferences are not “demand that fills the trough” but “demand that adds further weight to the shoulder of a peak that is already rising.”
The annual distribution shows clear seasonality as well. Cumulative room nights peak in October at 181, followed by November at 159, June at 137 and July at 132. August falls to 33 and the following January to 21. The conference season has a two-peak structure — spring (May–July) and autumn (September–November) — which does not necessarily align with the tourism high season.
Source: Compiled by the HotelBank Editorial Team from the UMIN conference listing (N=493 conferences)
Venue concentration is also distinctive. The venue hosting the most academic conferences in fiscal 2026 is Pacifico Yokohama (パシフィコ横浜) with 23. It is followed by Toki Messe Niigata Convention Center (朱鷺メッセ 新潟コンベンションセンター) with 14, Osaka International Convention Center (大阪国際会議場, including Grand Cube Osaka) with 12, Fukuoka International Congress Center (福岡国際会議場) with 11, and Kobe International Conference Center and Kobe International Exhibition Hall (神戸国際会議場・国際展示場) with 10. The fact that a single venue turns over more than 20 conferences a year makes it a demand base the surrounding lodging market cannot ignore.
| Venue | Conferences in FY2026 | Location |
|---|---|---|
| Pacifico Yokohama (incl. North and Conference Center) | 23 | Yokohama, Kanagawa |
| Toki Messe Niigata Convention Center | 14 | Niigata City, Niigata |
| Osaka International Convention Center (Grand Cube Osaka) | 12 | Osaka City, Osaka |
| Fukuoka International Congress Center | 11 | Fukuoka City, Fukuoka |
| Kobe International Conference Center / Kobe International Exhibition Hall | 10 | Kobe, Hyogo |
| Kyoto International Conference Center | 8 | Kyoto City, Kyoto |
| Kumamotojo Hall | 7 | Kumamoto City, Kumamoto |
| Sapporo Convention Center | 6 | Sapporo, Hokkaido |
| Sendai International Center / Tokyo International Forum (each) | 5 | Sendai, Miyagi / Chiyoda, Tokyo |
Table 1 source: Compiled by the HotelBank Editorial Team from the UMIN conference listing (venue name variants consolidated, N=493 conferences)
The weekday trough is Sunday and Monday — day-of-week profiles by city
So what occupancy level do the days that carry conference demand actually run at? Using MetroEngines Research data, we calculated estimated OCC by day of week for business hotels in major prefectures for July 2026, the most recent finalized month.
Source: Compiled from MetroEngines Research by the HotelBank Editorial Team (July 2026, business hotels; Tokyo N=861 properties, Kanagawa N=201, Kyoto N=285, Miyagi N=125, Niigata N=107, Fukuoka N=315)
The same shape appears in all six prefectures. The lowest point is Monday check-in, followed by Sunday. From there the curve rises through Tuesday, Wednesday and Thursday, flattens on Friday, and peaks on Saturday. In Kyoto the gap is widest, with Monday at 75.7% against Thursday at 89.3% — a spread of 13.6pt. Tokyo runs at a high level throughout, with Monday at 89.5% and Saturday at 96.3%, so its spread is narrow.
What matters is that the Wednesday, Thursday and Friday nights generated by academic conferences land on the part of this curve that has already nearly finished rising. The Sunday and Monday trough has to be designed around other demand — multi-night business travel, extended stays, local events. In practice, conference demand is not a tool for filling the trough; it is material for capturing rate on Wednesday through Friday. We apply the same method to reading day-of-week occupancy profiles in our analysis of business hotels in Aichi and Hiroshima, which found Sunday troughs of 7.1pt and 8.5pt against Thursday peaks.
Conference weekday nights per 1,000 rooms — thickness relative to market size
The raw count of academic conferences is highest in the large metropolitan areas: Tokyo 88, Kanagawa 34, Osaka 28. But the impact on a lodging market is determined not by the count of events, but by how many conference room nights land on the market’s room stock. We therefore calculated how many conference-generated weekday nights (Sunday through Thursday check-in) fall on the total room count of city and business hotels in each prefecture.
Source: Compiled by the HotelBank Editorial Team from MetroEngines Research / UMIN conference listing (room counts are for city and business hotels as of July 2026; 30 prefectures tabulated)
What stands out among the large markets is Kanagawa at 1.48 nights. That works out to 51 conference weekday nights against 34,546 rooms — 3.6 times Tokyo’s 0.41 nights. Behind it is the concentration at Pacifico Yokohama, which alone hosts 23 events a year. Hyogo at 1.29 nights, Niigata at 0.97 and Kumamoto at 1.06 are also thick given their market size.
By contrast, Osaka at 0.24 nights and Aichi at 0.12 have a reasonable number of conferences but a large room stock, so conference demand struggles to move overall market supply and demand. Even among cities that “get conferences,” the degree to which they bite into supply and demand differs this much. Prefectures with small room stocks — Tokushima at 1.62 nights, Nara at 1.31, Tottori at 1.22 — rank at the top, which conversely means that a single large conference can move the entire local inventory at once.
| # | Prefecture | Conferences | Conference weekday nights | Properties | Rooms | Weekday nights / 1,000 rooms | Weekday OCC | Weekend OCC |
|---|---|---|---|---|---|---|---|---|
| 1 | Tokushima | 5 | 8 | 69 | 4,932 | 1.62 | 83.6% | 86.2% |
| 2 | Kanagawa | 34 | 51 | 243 | 34,546 | 1.48 | 86.6% | 91.2% |
| 3 | Nara | 8 | 6 | 35 | 4,581 | 1.31 | 78.4% | 83.7% |
| 4 | Hyogo | 22 | 32 | 187 | 24,762 | 1.29 | 89.7% | 91.1% |
| 5 | Tottori | 9 | 7 | 55 | 5,739 | 1.22 | 84.0% | 87.9% |
| 6 | Kumamoto | 11 | 15 | 123 | 14,162 | 1.06 | 86.2% | 88.8% |
| 7 | Niigata | 14 | 14 | 124 | 14,473 | 0.97 | 88.0% | 92.3% |
| 8 | Yamagata | 3 | 6 | 65 | 6,902 | 0.87 | 89.9% | 93.4% |
| 9 | Iwate | 5 | 8 | 90 | 10,572 | 0.76 | 88.6% | 91.2% |
| 10 | Miyagi | 11 | 13 | 146 | 20,038 | 0.65 | 90.9% | 95.5% |
| 11 | Fukuoka | 24 | 29 | 351 | 49,919 | 0.58 | 90.5% | 93.6% |
| 12 | Tochigi | 5 | 6 | 130 | 11,612 | 0.52 | 84.5% | 87.6% |
| 13 | Okayama | 6 | 6 | 101 | 11,857 | 0.51 | 86.5% | 88.2% |
| 14 | Shiga | 5 | 4 | 87 | 8,020 | 0.50 | 82.1% | 88.6% |
| 15 | Gifu | 6 | 5 | 116 | 10,738 | 0.47 | 83.6% | 86.8% |
| 16 | Hokkaido | 24 | 28 | 455 | 59,384 | 0.47 | 93.3% | 95.3% |
| 17 | Gunma | 5 | 4 | 100 | 8,963 | 0.45 | 77.7% | 83.7% |
| 18 | Ishikawa | 9 | 6 | 110 | 14,061 | 0.43 | 81.2% | 85.4% |
| 19 | Toyama | 6 | 4 | 75 | 9,809 | 0.41 | 85.2% | 86.6% |
| 20 | Tokyo | 88 | 65 | 961 | 158,199 | 0.41 | 92.2% | 94.6% |
| 21 | Kyoto | 17 | 16 | 340 | 41,604 | 0.38 | 83.1% | 88.9% |
| 22 | Okinawa | 8 | 7 | 190 | 19,491 | 0.36 | 91.5% | 95.0% |
Table 2 source: Compiled by the HotelBank Editorial Team from MetroEngines Research / UMIN conference listing. Property and room counts cover city plus business hotels (as of July 2026). OCC figures are estimates for July 2026, with weekday = Sunday–Thursday check-in and weekend = Friday–Saturday check-in.
Does the conference signal show up in booking pace? The Niigata case
From here we look at how conference demand actually appears in booking pace. The case is the 28th Annual Meeting of the Japan Osteoporosis Society (第28回日本骨粗鬆症学会; September 11–13, 2026, Toki Messe Niigata Convention Center, hosted by the Japan Osteoporosis Society). The dates and venue are confirmed on the society’s official site.
The comparison method is simple. For 109 business hotels with 12,756 rooms in Niigata, we line up the remaining-inventory rate for Friday September 11 — the conference opening day — against normal-week Fridays in the same month (September 4 and September 18), matched at identical lead times (LT). Matching LT removes the trivial effect that “the earlier you observe, the more rooms are naturally still available.”
Source: Compiled from MetroEngines Research by the HotelBank Editorial Team (Niigata business hotels N=109 properties / 12,756 rooms; 95–104 properties observed per observation date)
The difference is clear. As early as LT90, September 11 already stood at a 21.2% remaining-inventory rate, below September 18’s 25.2% and August 28’s 27.6%. Depletion from there was faster too, falling to 14.9% (1,907 rooms remaining) at LT50. At the same point, September 18 stood at 23.2% (2,959 rooms) and September 4 at 21.1% (2,690 rooms) — a level 8.3pt below a normal-week Friday.
The same tendency appears on Thursday September 10, the eve of the conference. Its remaining-inventory rate at LT50 was 26.7%, 6.1pt below the 32.8% of September 17, a normal-week Thursday. A three-day conference is visibly moving inventory not only on the opening day but on the night before it.
Listed price movement is equally contrasting. The listed price for September 11 (all-plan average) rose from roughly ¥13,200 at LT90 to roughly ¥14,400 at LT50. September 18, meanwhile, fell from roughly ¥12,300 to roughly ¥11,600 — the same month and the same day of the week, yet prices moving in opposite directions. The obvious relationship — that prices do not fall on days when inventory tightens — is confirmed in the numbers.
Narrowing to the thinner supply of 17 city hotels with 2,076 rooms, the remaining-inventory rate for September 11 at LT50 had fallen to 5.7% (118 rooms remaining). The pattern suggests that large properties nearest the venue fill first, with demand then spreading out to business hotels in the surrounding area. Note that Niigata also hosts the 132nd Scientific Meeting of the Japan Society of Medical Physics (第132回日本医学物理学会学術大会) at the same Toki Messe venue on Friday August 28. That date’s remaining-inventory rate is also somewhat below a normal week in the same month, but the gap is not as large as September 11’s. The strength of the signal varies with the scale of the conference.
Kyoto and Hyogo — market depth dilutes the conference signal
We ran the same test in Kyoto and Hyogo. For Kyoto the subject was the 85th Annual Meeting of the Japanese Cancer Association (第85回日本癌学会学術総会; September 24–26, 2026, Kyoto International Conference Center, hosted by the Japanese Cancer Association), comparing Thursdays in September. The dates, venue and hosting society are all confirmed on the meeting’s official site.
Source: Compiled from MetroEngines Research by the HotelBank Editorial Team (Kyoto business hotels N=291 properties / 31,673 rooms; 270–285 properties observed per observation date)
September 24 stood at 34.2% at LT90 and 29.1% at LT56. The comparison dates ran 38.1%→34.5% for September 17 and 39.9%→36.9% for September 3, placing the conference opening day 5.4pt below a normal-week Thursday. The listed price at LT56 was roughly ¥17,500, above September 17’s roughly ¥15,500. The conference signal is certainly present, but it is mild compared with Niigata’s 8.3pt. Kyoto has a deep market — 31,673 rooms in business hotels alone — and autumn tourism demand starts building from late September, so conference demand is more readily absorbed into the existing base.
In Hyogo, we compared the opening day of the 33rd Annual Meeting of the Japanese Society for Spine and Spinal Neural Surgical Techniques (第33回日本脊椎・脊髄神経手術手技学会; September 11–12, 2026, Kobe International Conference Center) against a normal-week Friday in the same month. Across 148 business hotels with 16,999 rooms, the remaining-inventory rate at LT50 was 26.7% against 30.4% for the comparison date of September 18 — a gap of 3.7pt. For a two-day conference of relatively compact scale, the signal shrinks further.
| Market | Conference / opening day | Scope | Opening day remaining | Normal week remaining | Gap |
|---|---|---|---|---|---|
| Niigata Business hotels | 28th Annual Meeting, Japan Osteoporosis Society Fri 9/11 / Toki Messe | 109 properties 12,756 rooms | 14.9% | 23.2%(9/18) | -8.3pt |
| Kyoto Business hotels | 85th Annual Meeting, Japanese Cancer Association Thu 9/24 / Kyoto International Conference Center | 291 properties 31,673 rooms | 29.1% | 34.5%(9/17) | -5.4pt |
| Hyogo Business hotels | 33rd Annual Meeting, Japanese Society for Spine and Spinal Neural Surgical Techniques Fri 9/11 / Kobe International Conference Center | 148 properties 16,999 rooms | 26.7% | 30.4%(9/18) | -3.7pt |
Table 3: Remaining-inventory rates are at LT50 for Niigata and Hyogo, and at LT56 for Kyoto (lead times aligned with what was observable for the comparison dates). Source: Compiled by the HotelBank Editorial Team from MetroEngines Research / the UMIN conference listing and the official sites of each conference.
Placing the three markets side by side shows that what determines the strength of the conference signal is the ratio between the scale of the conference and the room stock of the market. A national three-day meeting arriving in a market of just over 10,000 rooms visibly moves supply and demand; the same conference in a market of 30,000-plus rooms is diluted. The weekday-night density ranking presented above is the metric for reading that relationship a year ahead.
Practical steps for thickening the weekday
From the data above, several practical opportunities emerge for revenue management at city and business hotels, and for the recruitment and hosting design of convention bureaus.
First, the conference calendar can be treated as a confirmed leading indicator. Conference dates and venues are in most cases published more than a year ahead. There is none of the uncertainty of weather or event lotteries. Simply mapping the conferences scheduled for your own market at the start of the fiscal year and marking the relevant Wednesdays, Thursdays and Fridays gives you a starting point for rate design. As shown above, the signal is already visible at LT90. The time to act is not the last minute, but 90-plus days out.
Second, there is upside in the eve and the night after the closing day. In the Niigata case, not only the opening day but the Thursday eve depleted 6.1pt faster than a normal week. Given that 126 conferences run three days or more, the week containing a conference can be designed as a single block of three to four nights covering “the eve plus the conference days.” Multi-night plans, and breakfast operations geared to early morning starts on day one, are moves that follow how attendees actually behave.
Third, treat the Sunday and Monday trough separately. Conferences thicken Wednesday through Friday, but they do not reach the trough at the head of the week. That is territory requiring a different demand design — extended stays, multi-date business travel, extension-night incentives off local weekend events. Not conflating conference demand with trough-filling measures ultimately improves the precision of both.
Fourth, look at the ratio to market size. Holding the perspective of conference weekday nights per 1,000 rooms helps avoid the misjudgment of “there were plenty of conferences this year, but nothing moved.” In a thick market like Aichi, there are limited occasions where a conference alone moves supply and demand. Conversely, in a market like Niigata or Kumamoto, a single national-scale conference reshapes several days of supply and demand.
Fifth, the opportunity as seen from the convention bureau side. From a venue-utilization standpoint, the skew of 181 nights in October and 159 in November against 33 in August and 21 in January means, conversely, that the open periods are clearly identifiable. If hosting terms developed jointly with lodging operators can be offered to conferences able to place their dates in the off-season, there is room to level out weekday occupancy across the region as a whole.
⚠ Note on forward-dated data: All check-in dates from September 2026 onward covered in this article represent booking pace in progress as of the time of research (July 31, 2026). Remaining-inventory rates and listed prices fluctuate as the check-in date approaches, and inventory can return through cancellations or be released additionally by properties. This article does not assert sell-out or full occupancy for any specific date. Remaining-inventory rates are also estimates based on the inventory each property publishes to OTAs and similar channels, and differ from a property’s actual total inventory.
Conclusion
Almost half of the 493 medical academic conferences scheduled for fiscal 2026 open on a Thursday or a Friday, and 75.7% of the 1,009 cumulative room nights they generate concentrate on Wednesday, Thursday and Friday nights. For urban hotels this is a band that, while short of the weekend, is relatively strong within the working week — and academic conferences act as demand that adds further thickness to it. This is not demand that fills the Sunday and Monday trough.
The size of the impact is determined not by the number of conferences but by the ratio to the market’s room stock. Measured as conference weekday nights per 1,000 rooms, Kanagawa stands out among large markets at 1.48 nights, on a different level from Tokyo’s 0.41, Osaka’s 0.24 and Aichi’s 0.12. Actual booking pace tells the same story: in Niigata the opening-day remaining-inventory rate ran 8.3pt below a normal-week Friday, while in the deeper Kyoto market the gap was 5.4pt and in Hyogo — where a smaller conference arrives — 3.7pt, narrowing in stages.
Conference dates are published years in advance. They are a high-confidence source of weekday demand, subject to neither weather nor lotteries. Map them into a calendar at the start of the fiscal year and design rate and inventory from the LT90 stage onward. That is the most reliable starting point for thickening the weekday.
Further Reading
References and Sources
■ Conference dates and venues (primary sources)
- UMIN (University Hospital Medical Information Network) list of academic conferences, fiscal 2026 — 494 academic conferences held between April 2026 and March 2027
- UMIN society information — academic conferences
- 85th Annual Meeting of the Japanese Cancer Association, meeting outline (Japanese Cancer Association; September 24–26, 2026, Kyoto International Conference Center)
- 28th Annual Meeting of the Japan Osteoporosis Society, meeting outline (September 11–13, 2026, Toki Messe Niigata Convention Center)
■ Data sources
Conference dates, venues and hosting societies are primary-source information from the UMIN (University Hospital Medical Information Network) list of academic conferences and the official sites of each conference. Lodging supply and demand uses historical data on OTA-published inventory and listed prices collected by MetroEngines Research (estimated OCC by day of week, remaining-inventory rate by lead time, listed prices, property counts and room counts). Property and room counts are for city and business hotels as of July 2026.
■ Calculation assumptions
Conference room nights are cumulative nights counted as one night each “from the eve of the opening day through the eve of the closing day” (one-day conference = 1 night; three-day conference = 3 nights). The scope is the 493 conferences held between April 2026 and March 2027 running seven days or fewer. Day-of-week OCC averages daily estimated OCC for July 2026 by day of week, with weekday = Sunday–Thursday check-in and weekend = Friday–Saturday check-in. Booking-pace comparisons line up each date against its comparison date at identical lead times (LT), eliminating apparent differences caused by differing observation timing. Conference weekday nights per 1,000 rooms divides the Sunday–Thursday check-in nights generated by conferences by the prefecture’s total city plus business hotel room count, expressed per 1,000 rooms.
■ Limitations and caveats
(1) Conference room nights are estimated from conference dates and are not observations of actual attendee numbers or lodging behavior. No estimate is made for conferences whose attendance is not disclosed. (2) OCC and remaining-inventory rates are estimates based on inventory published to OTAs, and differ from a property’s actual occupancy or actual inventory. (3) Check-in dates from September 2026 onward reflect booking pace in progress as of the research date (July 31, 2026) and may fluctuate through cancellations returning inventory or additional inventory being released. No sell-out is asserted for any specific date. (4) Differences in remaining-inventory rates are observed correlations that also include non-conference factors (other events, seasonality, property-side inventory management) and do not demonstrate causation. (5) Because the number of properties observed varies by day, thin cross-sections are avoided in comparison and the range of observed property counts is stated alongside each figure.
■ Lodging market data
- MetroEngines Research — estimated OCC by day of week (June and July 2026), remaining-inventory rate by lead time, listed prices, property and room counts for city and business hotels (as of July 2026)