

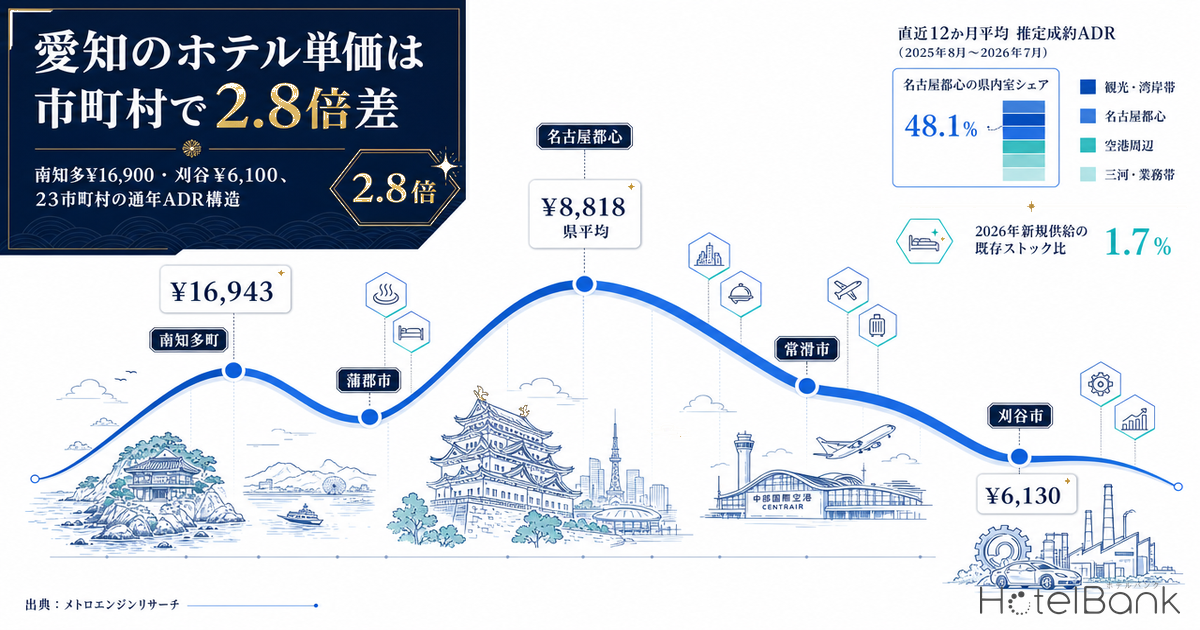
You cannot get a clear picture of Aichi’s hotel market by looking only at the prefecture-wide average. Aggregating settled ADR estimates by municipality from MetroEngines Research data over the latest 12 months (the finalized months from August 2025 to July 2026), the most expensive municipality, Minamichita Town, came in at about ¥16,900 and the cheapest, Kariya City, at about ¥6,100 — a 2.8x spread within a single prefecture. And the spread runs opposite to the usual “expensive downtown, cheap suburbs” pattern: central Nagoya (Nakamura Ward and Naka Ward), which holds roughly half of the prefecture’s room stock, sits at about ¥10,100, around 40% below the coastal tourism belt. This article sorts the full-year ADRs of 23 Aichi municipalities into four tiers and reads the market structure against room stock, seasonality and the supply pipeline.
Metric Definitions Used in This Article
- ADR (Average Daily Rate) = an estimated settled rate (tax-excluded equivalent), calculated by applying a property-type correction factor to the lowest-plan price each property publishes on OTAs and similar channels (per room, two guests per room, tax included). Checked against property-level results disclosed by listed hotel REITs (91 properties, latest 3 months), the median error is about 7%. These are estimates and differ from each property’s actual transaction prices and accounting figures. Area-level ADR is the median of the covered properties (the level of a typical property in the area).
- Listed price = the average of all plans listed on OTAs and similar channels (per room, two guests per room, tax included). This article reports it separately from ADR.
- Finalized / estimated months = figures through July 2026 are based on finalized results; figures from August 2026 onward are estimates based on listed price levels at the time of the survey. Year-over-year comparisons use finalized months only.
- Data source: MetroEngines Research
- — 2.8x Within Aichi, the 12-month average settled ADR ranges from ¥16,943 in Minamichita Town to ¥6,130 in Kariya City, a 2.8x gap. The prefecture average of ¥8,818 is the lowest among six major prefectures.
- — Ranking reversed Central Nagoya, which holds 48.1% of the room stock, sits at ¥10,057 — around 40% below the tourist and coastal belt (¥13,881), which holds just 5.7% of the prefecture’s rooms. The opposite of “downtown is expensive.”
- — 5 municipalities Only 5 of the 23 municipalities fall in the ¥10,000–¥15,000 upper-midscale band. The largest cluster is the 11 municipalities below ¥8,000.
- — 1.7% New openings in 2026 total 18 properties and 672 rooms, equal to 1.7% of the 39,986 business and city hotel rooms. Supply pressure is limited.
- — 1 net addition Of the 2 future pipeline projects identified from building-permit applications, the 170 rooms in Nishiki, Naka Ward are in the same building as the already-opened Conrad Nagoya. The only net addition is 100 rooms in Nishi Ward.
On the prefecture average alone, Aichi is the cheapest major prefecture
First, the prefecture-level position. Aichi’s settled ADR averaged about ¥8,800 over the latest 12 months (August 2025 to July 2026), up 6.7% from about ¥8,300 a year earlier. The sample covers N=507 properties (as of July 2026).
Lining up major prefectures over the same period with the same method gives Kyoto about ¥16,600, Tokyo about ¥14,600, Shizuoka about ¥13,600, Fukuoka about ¥11,800 and Osaka about ¥10,700. Aichi ranks lowest of the group. That does not make Aichi a “cheap prefecture,” though. It reflects a prefecture-wide room stock composed very differently from the others. As the following sections show, Aichi contains a rate band that beats Kyoto’s average and, at the same time, a business-demand rate band that runs on an entirely different logic.
Source: MetroEngines Research; compiled by HotelBank Editorial Team (12-month average, August 2025 – July 2026; Aichi N=507 properties as of July 2026)
Ranking 23 municipalities flips the order: coast above downtown
We aggregated settled ADR by municipality over the latest 12 months and extracted the 23 municipalities with a median of at least 5 covered properties. Because Nagoya is a designated city, its data come back ward by ward, so we handled the wards separately to avoid double-counting them in the prefecture total. We also excluded thin months — those in which the number of covered properties fell below 60% of that municipality’s median — from the averages. Without this step, high readings from months when the observed property count temporarily dropped would inflate the averages and produce misleading year-over-year figures.
The result was clear-cut. The top of the table — Minamichita Town (about ¥16,900), Gamagori City (about ¥15,400), Shinshiro City (about ¥14,500) and Mihama Town (about ¥13,900) — lines up along the Mikawa Bay and Chita Peninsula coast and the mountains of Oku-Mikawa. Central Nagoya’s Nakamura Ward (about ¥10,400) and Naka Ward (about ¥9,700) sit one step below, and Mikawa’s business cities form the lowest band: Kariya City at about ¥6,100, Ichinomiya City at about ¥6,200, Handa City at about ¥6,400 and Okazaki City at about ¥6,500. A prefectural capital or business city falling into the cheapest tier is not unique to Aichi; we have confirmed the same reversal persisting for 12 months in Kagoshima, where the prefectural capital is the cheapest.
Source: MetroEngines Research; compiled by HotelBank Editorial Team (coverage: 23 municipalities with a median of at least 5 covered properties)
This order shows that price is set not by “centrality of location” but by “what is being sold per night.” Coastal accommodations are dominated by ryokan and minshuku (family-run inns) where two meals are standard, so the unit of product per night differs from an urban hotel’s room-only stay. By property type in Aichi, the 12-month average settled ADR was about ¥14,700 for ryokan (N=138 properties), about ¥13,100 for resort hotels (N=10), about ¥12,800 for city hotels (N=30) and about ¥7,800 for business hotels (N=325). The prefecture average settles at ¥8,800 because business hotels, which account for the overwhelming majority of properties, set the level.
| Property type | 12-month avg. ADR | YoY | Covered properties (median) |
|---|---|---|---|
| Ryokan | ¥14,714 | +2.9% | 138 |
| Resort hotel | ¥13,134 | −1.0% | 10 |
| City hotel | ¥12,787 | +12.2% | 30 |
| Business hotel | ¥7,844 | +5.8% | 325 |
Source: MetroEngines Research; compiled by HotelBank Editorial Team (average of finalized months, August 2025 – July 2026)
48% of rooms are downtown; the high-rate coastal belt holds just 5.7%
The price ranking and the distribution of room stock run in almost opposite directions. Splitting the 1,326 properties and 77,857 rooms registered in our Aichi property master into four tiers gives the following.
| Tier | Properties | Rooms | Share of rooms | Avg. rooms per property | 12-month avg. ADR |
|---|---|---|---|---|---|
| Central Nagoya (Nakamura Ward, Naka Ward) | 293 | 37,419 | 48.1% | 127.7 | ¥10,057 |
| Mikawa business belt (Toyota, Okazaki, Kariya, Toyohashi) | 179 | 9,525 | 12.2% | 53.2 | ¥6,952 |
| Tourist & coastal belt (Minamichita, Gamagori, Inuyama) | 253 | 4,468 | 5.7% | 17.7 | ¥13,881 |
| Airport area (Tokoname) | 26 | 4,224 | 5.4% | 162.5 | ¥8,195 |
| Aichi total | 1,326 | 77,857 | 100% | 58.7 | ¥8,818 |
Source: MetroEngines Research; compiled by HotelBank Editorial Team. Property and room counts are based on property-master registrations, a different population from the set of properties confirmed as active on OTAs. Tier ADR is the simple average of the 12-month averages of the constituent municipalities.
The tourist and coastal belt has more properties (253) than the Mikawa business belt (179), yet only 4,468 rooms — 5.7% of the prefecture total — because it is made up of small inns averaging 17.7 rooms each. Minamichita Town alone has 188 properties with 1,894 rooms, an average of 10.1 rooms. Tokoname City is the opposite: 26 properties with 4,224 rooms, an average of 162.5, a structure of a few large properties serving Chubu Centrair International Airport.
Plot average property size against settled ADR on a single chart and the relationship appears as a downward-sloping line. The smaller the property and the more it bundles meals, the higher the rate; the larger the property and the more it relies on room-only stays, the lower the rate. Aichi’s price structure is explained not by a map of locations but by a map of product design.
Source: MetroEngines Research; compiled by HotelBank Editorial Team (bubble size = number of properties; coverage: 23 municipalities with a median of at least 5 covered properties, N=507 properties as of July 2026)
Each tier has a completely different seasonal “fingerprint”
Converting each of the four tiers’ settled ADR over the latest 12 months into a monthly index (12-month average = 100) reveals a distinct shape for each.
Source: MetroEngines Research; compiled by HotelBank Editorial Team (August 2025 – July 2026; simple average of each tier’s constituent municipalities, indexed; coverage: 23 municipalities with a median of at least 5 covered properties, N=507 properties as of July 2026)
Central Nagoya has two peaks, in March (117.1) and November (114.4), with a trough in June (87.5). Fiscal-year-end relocation and business-trip demand and autumn conference and exhibition demand push rates up, then they ease in the rainy season — a textbook urban shape. The peak-to-trough range is 29.6 points.
The Mikawa business belt, by contrast, has the smallest range of the four tiers at 16.2 points. Its high is 108.1 in November and its low 91.9 in July, making it nearly flat year-round. Kariya City in particular has an extremely low 12-month coefficient of variation of 2.9%, with monthly figures barely moving. In a market where manufacturing business-trip demand arrives in a steady volume regardless of day or month, rates are set by contracts and base occupancy rather than by season. That stability is a strength in the sense that demand is easy to read.
The tourist and coastal belt peaks in December (117.4) and August (113.1) and falls into a deep trough in June (80.9). Its 36.5-point range exceeds central Nagoya’s. This is a meal-driven shape, with rates moved by two seasonal products: winter delicacies and summer beach trips. Tokoname City peaks in September (114.3) and October (123.8), and had the largest range of all at 40.2 points.
September–October 2026 must be read separately from the full-year structure
One caveat: the September and October 2026 figures should not be mixed directly into the full-year structural analysis. The 20th Asian Games (Aichi-Nagoya 2026) run from September 19 to October 4, 2026, followed two weeks after the closing by the 5th Asian Para Games from October 18 to 24. These two events put Aichi’s autumn into a demand phase unlike a normal year.
Estimates based on listed price levels at the time of the survey put the prefecture-wide ADR for September 2026 at about ¥13,900, up 64.0% from about ¥8,500 a year earlier, and October at about ¥12,900, up 48.0%. By municipality, the increases are larger in the surrounding cities than in central Nagoya.
Source: MetroEngines Research; compiled by HotelBank Editorial Team (September and October 2026 are estimates based on listed price levels at the time of the survey; Aichi N=507 properties as of the finalized month of July 2026)
Mikawa’s business cities — Kariya City at +104.6% in September, Okazaki City at +99.6% and Toyohashi City at +93.2% — outpace central Nagoya (Nakamura Ward +89.8%, Naka Ward +69.3%). Meanwhile, in the tourist and coastal belt, Minamichita Town is at −3.9% and Gamagori City at −12.1%, showing almost no effect from Games demand. The catchment for access to competition venues and the lodging market driven by seasonal products simply run on different demand curves.
We have already covered supply and demand during the Games themselves in several articles. Because this article focuses on the full-year market structure, we leave the details to them: for demand spilling beyond Greater Nagoya, see Asian Games 2026: Toyohashi +18.7pt, Kuwana +14.4pt Beyond Nagoya; for the Para Games week in October, see Asian Para Games 2026: Aichi Weekdays Run 12pt Above the Next Week; and for how to read single-month swings by property type, see Aichi Settled ADR 18 Months: City Swings 25.0pt, Business 14.0pt.
New supply in 2026 is 672 rooms, 1.7% of existing stock
Now the supply side. New openings in Aichi in 2026 confirmed by MetroEngines Research through OTA listings total 18 properties and 672 rooms, of which 6 properties (657 rooms) have 20 or more rooms. That is a slight increase from 560 rooms in 2025. Against the 39,986 rooms of Aichi’s 287 business hotels (34,695 rooms) and 33 city hotels (5,291 rooms) combined, the 672 new rooms in 2026 equal 1.7%.
| Opening | Property | Rooms | Type | Tier |
|---|---|---|---|---|
| 2026-07 | Conrad Nagoya (コンラッド名古屋) | 170 | City hotel | Central Nagoya |
| 2026-06 | SONO Moon Nagoya | 130 | Business hotel | Central Nagoya |
| 2026-06 | SETRE Canal Nagoya (セトレ キャナル 名古屋) | 24 | Resort hotel | Nagoya City |
| 2026-07 | Manga Art Hotel Nagoya Marunouchi (マンガアートホテル名古屋丸の内) | 25 | Hostel | Central Nagoya |
| 2026-09 | Hotel Route-Inn Aichi Togo (ホテルルートイン愛知東郷) | 196 | Business hotel | Eastern Nagoya |
| 2026-11 | Tabino Hotel lit Toyokawa (たびのホテルlit豊川) | 112 | City hotel | East Mikawa |
Source: MetroEngines Research & Consulting (based on confirmed OTA listings, N=18 properties). Listings appear several months before opening, so figures for recent and upcoming months may rise as more listings appear.
What stands out is where the openings are. Of the six major 2026 openings, three are in central Nagoya; the rest are spread outside the core, in Togo Town east of Nagoya and Toyokawa City in East Mikawa. In 2025, too, supply came in without concentrating on the core alone: 134 rooms in Inuyama City, 188 rooms in Nishiki (Nagoya), 110 rooms in front of Fushimi Station and 100 rooms near Nagoya Castle.
Looking further ahead, the Ministry of Land, Infrastructure, Transport and Tourism’s (MLIT) Building Construction Statistics identify 2 projects in Aichi on a building-permit-application basis: a 170-room hotel in a 41-story mixed-use redevelopment in Nishiki, Naka Ward, Nagoya, and a 100-room hotel in Nishi Ward, Nagoya. However, the 170-room, 41-story Nishiki project is the same building as Conrad Nagoya (The Landmark Nagoya Sakae, Nishiki 3-chome, Naka Ward, Nagoya; 41 stories; 170 rooms), which opened on July 31, 2026, and is already counted among the 2026 openings in the table above. The only project left as a net addition to the pipeline is therefore the single 100-room project in Nishi Ward, Nagoya; reading both permit-based projects as future supply would double-count. Because building permits are usually filed one to two years before opening, this count is a floor for the pipeline confirmed to date. It is expected to grow as further applications are filed, so supply pressure from 2027 onward cannot be judged from this single project.
Only 5 municipalities sit in the ¥10,000–¥15,000 band — room to grow in upper-midscale
Counting the 23 municipalities by 12-month average ADR band brings Aichi’s market structure into even sharper focus.
| Price band (12-month avg. ADR) | Municipalities | Which municipalities |
|---|---|---|
| ¥15,000 and above | 2 | Minamichita Town, Gamagori City |
| ¥12,000–¥15,000 | 2 | Shinshiro City, Mihama Town |
| ¥10,000–¥12,000 | 3 | Nishio City, Nakamura Ward, Tahara City |
| ¥8,000–¥10,000 | 5 | Naka Ward, Higashi Ward, Inuyama City, Tokai City, Tokoname City |
| Below ¥8,000 | 11 | Komaki City, Toyota City, Toyohashi City and others |
Source: MetroEngines Research; compiled by HotelBank Editorial Team (average of finalized months, August 2025 – July 2026)
Five municipalities fall in the ¥10,000–¥15,000 upper-midscale band, and four of them — Shinshiro City, Mihama Town, Nishio City and Tahara City — are meal-driven coastal or mountain markets. The only urban market to reach this band is Nakamura Ward (about ¥10,400). In other words, Aichi has two thick layers — a mostly room-only ¥6,000–¥8,000 band and a two-meal ¥15,000 band — with a wide gap between them where urban upper-midscale product is missing.
That gap can be read as headroom. In fact, moves to build a rate ladder already show up in the numbers. Taking only Aichi hotels that sell both a room-only plan and a breakfast-included plan and comparing them (paired analysis, July 2026, N=176 properties), adding breakfast supports a premium of +14.5% (about ¥2,800) overall. For business hotels alone the premium is +13.7% (about ¥2,100, N=144 properties), and for city hotels +11.6% (about ¥4,200, N=24 properties). This is a market where adding just one element — a meal — to a night’s product stacks on a little over 10% in rate. How widely that premium varies across prefectures is laid out, as a same-hotel comparison, in Breakfast Premium 4.4x Gap: Kyoto 22.0% vs Shizuoka 5.0%, 10 Markets.
The Mikawa business belt’s stable 16.2-point annual range is a favorable base on which to build that rate ladder. In a market where the demand floor is easy to read, it is straightforward to design value-adds that do not depend on season — breakfast, a lounge, features suited to longer stays — to lift the full-year rate level. Specific break-even lines for a West Mikawa project, and how to even out the gap between weekday and weekend occupancy, are separate questions that we leave outside the scope of this article.
From the coastal belt’s side, the biggest headroom is the June trough at an index of 80.9. The question is how much product it can place in the shoulder season between its two peaks, winter (December, 117.4) and summer (August, 113.1), that guests choose for reasons other than food. Since rates themselves are already at the top of the prefecture, what is needed is not higher prices but product design that fills the off-season days.
⚠ Note on ADR for future dates: Figures in this article from August 2026 onward are estimates based on selling prices published on OTAs and similar channels at the time of the survey, and they will change as check-in dates approach. In September–October 2026 in particular, which covers the Asian Games and Asian Para Games, prices currently set high may move with added inventory or last-minute adjustments. Year-over-year comparisons use only finalized months through July 2026.
Summary — Aichi is not “one market”
Lining up Aichi’s settled ADR by municipality shows how much the prefecture average of ¥8,800 conceals. Minamichita Town’s roughly ¥16,900 and Kariya City’s roughly ¥6,100 are figures from the same prefecture, yet they share neither a source of demand, nor a seasonal shape, nor what is actually sold in a night’s stay.
Put simply, Aichi is a collection of at least four independent markets. First, central Nagoya, which holds 48.1% of the prefecture’s rooms yet sits mid-table on rate, peaking in March and November and moving within a 29.6-point range. Second, the Mikawa business belt, the flattest at a 16.2-point range, with a firm rate floor. Third, the tourist and coastal belt, which achieves the prefecture’s highest rates with a cluster of small inns — 253 properties but only 4,468 rooms. Fourth, the airport area, centered on large properties at 26 properties and 4,224 rooms.
The two international events of autumn 2026 temporarily overwrite this structure. As far as the numbers show, however, that overwrite reaches central Nagoya and Mikawa’s business cities, not the coastal tourism belt. Once the Games are over, what remains of Aichi’s lodging market is the four-tier structure examined here. Pricing decisions should be built on this full-year structure, not on a single month’s large year-over-year jump.
Related Articles
- Asian Games 2026: Toyohashi +18.7pt, Kuwana +14.4pt Beyond Nagoya
- Asian Para Games 2026: Aichi Weekdays Run 12pt Above the Next Week
- Aichi Settled ADR 18 Months: City Swings 25.0pt, Business 14.0pt
- Kagoshima’s Capital Is Its Cheapest: ADR ¥6,819 vs Kirishima ¥14,330
- Why Hotels Feel Expensive in Obihiro, Fukui & Okayama: 393-City Check
- Breakfast Premium 4.4x Gap: Kyoto 22.0% vs Shizuoka 5.0%, 10 Markets
- Asian Games 2026: 1,500 Ship Rooms vs Nagoya’s 28,986-Room Stock
- Japan Autumn ADR 2026: 20 Prefectures Peak in Nov, Kyoto +81.8%
References and Sources
■ Data sources
Inventory and rates published on OTAs for lodging properties in Aichi, collected daily; the area median of each property’s daily average, aggregated by month. Municipal ADR covers the 23 municipalities with a median of at least 5 covered properties (Nagoya, a designated city, is handled ward by ward, and ward rows are not double-counted in the prefecture total), with finalized months through July 2026 (N=507 properties). Room stock is from the property master (1,326 properties, 77,857 rooms); new openings are based on confirmed OTA listings; the future pipeline is based on building-permit applications in MLIT’s Building Construction Statistics.
■ Calculation assumptions
ADR is the settled ADR estimate, reported separately from listed prices. It is an estimated settled rate (tax-excluded equivalent) obtained by applying a property-type correction factor to each property’s lowest-plan price (two guests per room, per room, tax included); checked against property-level results disclosed by listed hotel REITs (91 properties, latest 3 months), the median error is about 7%. The 12-month average is a simple average of finalized months only, August 2025 – July 2026, and thin months in which the number of covered properties fell below half the median are excluded from the average (a raw average without this exclusion produces misleading year-over-year figures). Tier ADR is a simple average of the constituent municipalities, not weighted by room count.
■ Limitations and caveats
(1) ADR is an estimate and differs from each property’s actual transaction prices and accounting figures. (2) Figures from August 2026 onward are estimated months based on listed price levels at the time of the survey, not finalized results. (3) The Asian Games (September 19 – October 4, 2026) and the Asian Para Games in October are short-term demand events, and September–October figures must be read separately from the full-year market structure. (4) Municipalities with fewer than 5 covered properties are not among the 23 in this article, which does not cover every municipality in the prefecture. (5) The future pipeline is a floor based on building-permit applications and will grow as further applications are filed. (6) This article does not cover occupancy (OCC), and profitability cannot be assessed from ADR alone.
■ Market data
- MetroEngines Research — monthly settled ADR series for 23 Aichi municipalities (August 2024 – January 2027; finalized months N=507 properties as of July 2026), ADR by property type, property master (1,326 properties, 77,857 rooms)
- MetroEngines Research & Consulting (based on confirmed OTA listings) — 18 new Aichi openings in 2026 with 672 rooms; 560 rooms in 2025
- MetroEngines Research — meal premium (paired analysis, July 2026, N=176 properties)
■ Government statistics and public data
- Ministry of Land, Infrastructure, Transport and Tourism, Building Construction Statistics (2 lodging construction projects in Aichi; the 170-room, 41-story project in Nishiki, Naka Ward, Nagoya is the same building as the already-opened Conrad Nagoya)
- Mitsubishi Estate, “Conrad Nagoya Opens Today, Friday, July 31, 2026” (Japanese) (opening date; 170 rooms)
- Hilton press release, “Conrad Nagoya Opens Today, Friday, July 31, 2026” (Japanese)
- Mitsubishi Estate, “The Landmark Nagoya Sakae Is Born” (Japanese) (Nishiki 3-chome, Naka Ward, Nagoya; 41 stories)
■ Games-related (public information)
- Japanese Olympic Committee (JOC), “Aichi-Nagoya Asian Games” (Japanese) (dates: September 19 – October 4, 2026)
- Olympics.com, “Asian Games Aichi-Nagoya 2026: Sports, Venues and Access” (Japanese)