

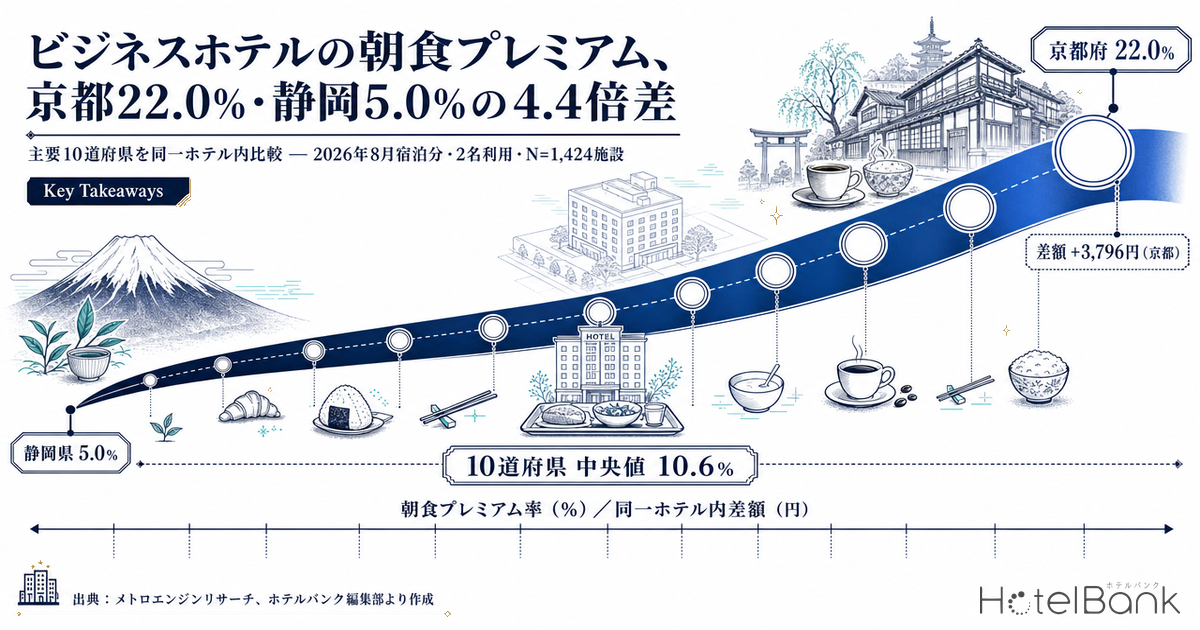
The same hotel, on the same night, sells the same room in two versions: with breakfast and without. The gap between those two prices is exactly what that hotel charges for breakfast. Aggregating that gap across business hotels in 10 major prefectures, Kyoto comes in at 22.0% (a within-hotel gap of roughly +¥3,800, N=68 properties) against Shizuoka at 5.0% (+¥800, N=132 properties) — a 4.4x spread. The median across the 10 prefectures is 10.6%. The breakfast premium is not a single nationwide “going rate”; it is a variable that differs by an order of magnitude from market to market.
Scope: business hotels in 10 major prefectures, limited to properties that sell both a “with breakfast” and a “room only” plan within the same hotel — N=1,424 properties (August 2026 stays, two-guest basis). This article deals only with the within-hotel breakfast premium rate (%) and gap (¥); it does not compare price levels across properties or areas. Ryokan are excluded. Data as of August 21, 2026.
- — Kyoto 22.0%, Shizuoka 5.0% — on a within-hotel paired comparison, the breakfast premium spans a 4.4x range across 10 major prefectures. The median is 10.6%, and no single nationwide going rate exists.
- — Rate and yen rankings do not line up — Hokkaido ranks 7th on rate at 9.4% but 4th on the gap at +¥1,981. Higher-priced markets show a smaller percentage for the same yen amount, so a self-audit needs both axes.
- — It is the business-hotel side that is scattered — city hotels across 6 prefectures sit within 11.9–18.6% (a 6.7pt band), while business hotels spread from 5.0% to 22.0% (a 17.0pt band).
- — A prefectural average is not a yardstick for your own hotel — inside Tokyo’s overall 13.3% lies a 19.3pt spread from Chuo 20.0% to Koto 0.7%. Inside Shizuoka’s 5.0%, the range runs from Aoi Ward in Shizuoka City at 17.7% down to Yaizu at minus 11.2%.
- — Only Kyoto inverts the segment convention — of the 6 prefectures, Kyoto alone has business hotels (22.0%) above city hotels (17.8%), with the breakfast gap functioning as a core component of room rate.
Why only a within-hotel paired comparison can measure the price of breakfast
The easiest trap when measuring a breakfast premium is to subtract the area-wide average of room-only plans from the area-wide average of breakfast-included plans. That does not work. Properties that lead with breakfast-included plans skew toward the mid-to-upper price tiers, while room-only-led properties skew toward the lower tiers, so the subtraction mixes in a population difference — which kinds of properties sell breakfast — rather than isolating the price of breakfast.
To avoid that contamination, this analysis extracts only properties that sell both a “with breakfast” and a “room only” plan within the same hotel, takes the gap inside each property, and only then aggregates to the market level. Properties selling just one of the two are excluded from the start. Each N therefore represents the number of properties where a valid pair was confirmed, not the total property count. No simple nationwide average across all hotels is used. Ryokan, where dinner sits at the center of pricing, are structurally different and are excluded.
The comparison conditions are constant throughout: segment = business hotel, occupancy condition = two guests, comparison = “with breakfast” versus “room only”, target month = August 2026 stays. Every figure below is on those conditions.
Kyoto 22.0%, Shizuoka 5.0% — rate and yen do not align neatly
Ranked by rate, the 10 prefectures come out as Kyoto 22.0% (N=68), Tokyo 13.3% (N=361), Aichi 13.0% (N=143), Hyogo 12.1% (N=68), Osaka 10.9% (N=164), Hiroshima 10.2% (N=68), Hokkaido 9.4% (N=196), Miyagi 8.7% (N=79), Fukuoka 8.1% (N=145) and Shizuoka 5.0% (N=132). Top to bottom, the spread is 17.0 percentage points.
What deserves attention here is that the ranking by rate and the ranking by yen gap do not match. Hokkaido is 7th of 10 on rate, yet its within-hotel gap of roughly +¥2,000 is the 4th largest. Hiroshima runs the other way: 6th on rate at 10.2%, but 7th on the gap at about +¥1,700. Because the rate is relative to the underlying room-only price level, a higher-priced market produces a smaller percentage for the same yen amount. Auditing your own breakfast pricing on rate alone, or on yen alone, leaves half the picture out.
Source: MetroEngines Research, compiled by the HotelBank Editorial Team
The table below adds, to the 10-prefecture list, the low and high premium rates observed across the four most recent monthly snapshots (May–August 2026 stays). Kyoto has the widest range at 9.5 percentage points, indicating large month-to-month swings. Tokyo, by contrast, sits at 11.2–13.3% and Hyogo at 11.0–12.5% — both within a band of roughly 2 points, suggesting breakfast pricing is stable as a market. Shizuoka runs 5.0–7.8%, where even the top of the range fails to reach the bottom of other markets.
| Prefecture | Breakfast premium rate | Within-hotel gap | N (paired properties) | Range, last 4 snapshots |
|---|---|---|---|---|
| Kyoto | 22.0% | +¥3,796 | 68 | 13.4–22.9% |
| Tokyo | 13.3% | +¥2,736 | 361 | 11.2–13.3% |
| Aichi | 13.0% | +¥2,094 | 143 | 12.1–14.0% |
| Hyogo | 12.1% | +¥1,812 | 68 | 11.0–12.5% |
| Osaka | 10.9% | +¥1,736 | 164 | 9.6–11.8% |
| Hiroshima | 10.2% | +¥1,687 | 68 | 10.2–12.9% |
| Hokkaido | 9.4% | +¥1,981 | 196 | 8.8–12.2% |
| Miyagi | 8.7% | +¥1,469 | 79 | 8.7–13.5% |
| Fukuoka | 8.1% | +¥1,523 | 145 | 8.1–10.2% |
| Shizuoka | 5.0% | +¥780 | 132 | 5.0–7.8% |
August 2026 stays, two guests, business hotels, within-hotel paired comparison. Ranges are observed values across the monthly snapshots for May–August 2026. Source: MetroEngines Research, compiled by the HotelBank Editorial Team
City hotels stay within 11.9–18.6% — it is the business-hotel side that is scattered
Running the same aggregation on city hotels in the same prefectures inverts the picture. Across 6 prefectures, the city-hotel breakfast premium falls between Shizuoka at 11.9% (N=21) and Fukuoka at 18.6% (N=30) — a band of just 6.7 percentage points. Business hotels, meanwhile, spread from Shizuoka 5.0% (N=132) to Kyoto 22.0% (N=68), a 17.0-point band. The dispersion in breakfast pricing sits with business hotels, not city hotels.
Kyoto stands out for a second reason. Of the 6 prefectures, it is the only one where the business-hotel premium exceeds the city-hotel premium (business 22.0%, N=68 versus city 17.8%, N=29). In Tokyo, business runs 13.3% (N=361) against city 17.2% (N=65); in Osaka, business 10.9% (N=164) against city 17.1% (N=57); in Hokkaido, business 9.4% (N=196) against city 18.1% (N=50); in Fukuoka, business 8.1% (N=145) against city 18.6% (N=30) — city hotels lead in every case. Kyoto’s business hotels can be read as a market where breakfast works as a rate component beyond the usual limits of the segment. How far the gap between segments can widen inside a single prefecture is examined in Nagano’s breakfast premium, split three ways across city, business and resort hotels.
August 2026 stays, two guests, within-hotel paired comparison. Source: MetroEngines Research, compiled by the HotelBank Editorial Team
Inside Tokyo’s 13.3% the range is 0.7–20.0% — a prefectural average is not a benchmark
Prefecture-level figures cannot be used as a yardstick for an individual hotel. Tokyo’s business hotels average 13.3% overall (N=361), but breaking that into the 16 wards and cities with five or more paired properties reveals a distribution from Chuo 20.0% (N=62) down to Koto 0.7% (N=11) — a 19.3-point spread. Shinagawa 15.4% (N=17), Shinjuku 14.6% (N=21), Minato 14.4% (N=43) and Chiyoda 13.1% (N=30) cluster near the citywide level, while Taito 10.8% (N=45) and Ota 6.2% (N=22) fall clearly below it.
Shizuoka shows the same dispersion. Inside the prefecture-wide 5.0% (N=132), Aoi Ward in Shizuoka City reaches 17.7% (N=11), Numazu 15.5% (N=12) and Gotemba 13.8% (N=7) hold double digits, while Kakegawa comes in at 7.4% (N=10), central Hamamatsu at 2.6% (N=17), and Yaizu registers minus 11.2% (N=5). A negative value means that even within the same hotel, the average of breakfast-included plans fell below the average of room-only plans. Depending on plan construction — which room types breakfast is attached to — an inversion can occur even inside a single property.
August 2026 stays, two guests, business hotels, within-hotel paired comparison, wards and cities with five or more paired properties only. Source: MetroEngines Research, compiled by the HotelBank Editorial Team
Given this dispersion, comparing your hotel to a prefectural average and concluding “we are around average” is risky. The reference point that matters is the level in the ward or city where you actually compete; a suburban Tokyo property targeting the citywide 13.3% may be aiming at something that has little to do with its own submarket. On how sharply price levels themselves differ between wards inside Tokyo, our comparison of business hotel ADR in Tokyo’s five central wards versus the outer 18 digs into the background.
For revenue managers running business hotels in these 10 prefectures — implications and an action plan
(a) Operational insights
1. Check your breakfast gap on both the rate and the yen axis. The 10-prefecture median is 10.6%. But Hokkaido ranks 7th on rate at 9.4% while its gap of roughly +¥2,000 ranks 4th, and Hiroshima ranks 6th on rate at 10.2% while its gap of about +¥1,700 ranks 7th — the order flips. Your setting can sit at the bottom of the market’s rate range and still be mid-pack in yen. Put both side by side first and identify which axis is out of line.
2. Push the benchmark unit down to the ward or city level. When the inside of Tokyo’s 13.3% runs 0.7–20.0% and the inside of Shizuoka’s 5.0% runs from minus 11.2% to 17.7%, a prefectural average cannot serve as your target. Simply resetting the reference point to the level in the ward or city where your compset actually overlaps changes how the target is framed.
3. In low-premium markets, do not use breakfast as the entry point for a rate increase. Where the whole market sits low — Shizuoka 5.0%, Fukuoka 8.1%, Miyagi 8.7% — raising the breakfast gap in isolation risks cutting the attachment rate for breakfast plans without lifting total revenue. In that order, moving the price of room-only inventory first and layering the gap on top is the easier design to evaluate. In a market like Kyoto at 22.0%, by contrast, the breakfast gap itself functions as a core component supporting rate.
4. There is room to question segment convention. In 5 of the 6 prefectures, city hotels (11.9–18.6%) sit above business hotels, but in Kyoto business at 22.0% exceeds city at 17.8%. The assumption that “a business hotel breakfast is worth about this much” does not hold in every market. How much your own trade area actually accepts is set by the market, not by the segment.
5. Negative or near-zero values are useful as a design-review signal. Levels like Koto Ward at 0.7% (N=11) or Yaizu at minus 11.2% (N=5) may point to structural issues behind the number — breakfast not being tied to higher room types, or crossover between breakfast plans and premium room-only plans. Before raising prices, there is room to review how the plans are combined.
(b) Action plan
| Timeframe | Action | Decision trigger | Objective |
|---|---|---|---|
| Today to this week | Inventory your own gap between “with breakfast” and “room only” for the same room type, in both percentage and yen | You do not sell both plans on the same room type, or the gap is inconsistent across room types | Create a comparable in-house figure first |
| Today to this week | Replace the reference benchmark with the level in your own ward or city rather than the prefectural average | Your current target is still set to a prefectural average (e.g. Tokyo 13.3%) | Avoid chasing the wrong target inside a 19.3-point spread |
| Within two weeks | Match breakfast cost and service hours (seats, turns, staffing) against the headroom for raising the gap | Your gap is below the market median of 10.6% and the breakfast venue has spare capacity | Fix the ceiling from operational constraints before pricing |
| Within two weeks | Redesign how room-only inventory is carved out (which room types, days of week, share of sales) | Your market sits in the low-premium band, at the level of Shizuoka 5.0% or Fukuoka 8.1% | Build up from the base rate rather than from the gap |
| Toward next month | Prepare a plan to phase a revised breakfast gap in, starting from the upper room types | Your gap stays below the bottom of the market range (e.g. 13.4% in Kyoto, 11.2% in Tokyo) | Raise rate without breaking the attachment rate |
| Toward next month | Record the post-revision breakfast attachment rate and gap monthly on the same measuring stick | Every month from the one following a revision | Keep your position within the market range trackable |
Source: MetroEngines Research, compiled by the HotelBank Editorial Team
None of these guarantees a result; they are an ordering of steps and of the evidence behind each decision. The third row in particular — fixing the ceiling from operational constraints first — is easy to overlook. Raising the breakfast gap without the venue capacity or service hours to match simply comes back as a degraded guest experience. That the market accepts 22.0% does not mean your kitchen can deliver 22.0% worth of expectation.
Conclusion — three measuring sticks for the breakfast premium
Stick 1: read rate and yen as a set. The 10-prefecture median is 10.6%. But the rate ranking and the gap ranking diverge, producing twists like Hokkaido at 7th on rate and 4th on yen. Always confirm your position on both axes.
Stick 2: the unit is the ward or city. Inside Tokyo’s 13.3% the range is 0.7–20.0%; inside Shizuoka’s 5.0% it runs from minus 11.2% to 17.7%. A prefectural average is a representative value for the market, not a target for your hotel.
Stick 3: the order of a rate increase changes with the market level. A market like Kyoto at 22.0%, where the breakfast gap works as a core rate component, calls for a different first move than a market like Shizuoka at 5.0%. In low-premium markets there is room to consider putting the price and carve-out of room-only inventory first and the breakfast gap second. On how to design the step widths further up the ladder, including half-board plans beyond breakfast, our breakdown of Oita’s meal premiums by segment is also useful.
Breakfast is not a binary of “included or not”; it is a price component with a different acceptance band in every market. Measured again as a within-hotel gap, how much your breakfast contributes to rate becomes something you can track month by month.
About the data
■ Data sources
・Definition of the breakfast premium: only properties selling both a “with breakfast” and a “room only” plan within the same hotel are extracted; the gap (¥) and gap rate (%) are computed inside each property and then aggregated to the market level. Properties selling only one of the two are excluded. A simple average across all hotels is not used, because it introduces selection bias. Ryokan, where dinner sits at the center of the price structure, are out of scope.
・N (paired properties): the number of properties where sales of both meal types were confirmed within the same property. Cells with N below 5 are not cited in this article. The N for each market is shown in the body text and tables. For August 2026 stays, the total N for business hotels across the 10 prefectures is 1,424 properties (Kyoto 68, Tokyo 361, Aichi 143, Hyogo 68, Osaka 164, Hiroshima 68, Hokkaido 196, Miyagi 79, Fukuoka 145, Shizuoka 132).
■ Calculation assumptions
・Comparison conditions: segment = business hotel (the segment is stated explicitly only where a comparison with city hotels is made), occupancy condition = two guests, target month = August 2026 stays. Only the ranges in the table use the individual monthly snapshots for May, June, July and August 2026.
■ Limitations and caveats
・Metrics this article does not address: no comparison of price levels across properties or areas is made. For reference, the settled ADR estimate this publication uses as its price-level metric is a settled price level (tax-excluded equivalent) inferred from sales data on OTAs and other channels (lowest-plan level x segment-specific coefficients, ensembled across multiple channels); past months are confirmed values, while the current and future months are estimates based on the sales situation at the time (median error of 6.6% when reconciled against published operating results). This article does not use that metric for level comparisons.
・Data as of: August 21, 2026. Sales conditions and inventory change daily, so the figures in this article are a snapshot at the time of retrieval.
Related reading
- Nagano Breakfast Premium: City +11.1% vs Resort +3.2% — 3x Segment Gap
- Oita Meal Premiums: Business Breakfast +10.6%, Half-Board +39.3%
- Ibaraki Breakfast Premium +5.8% vs Two-Meal +52.3% (July 2026)
- Fukuoka Settled ADR Slows +14.4% to +3.6% — Breakfast Premium Next?
- Tokyo Business Hotel ADR 12-Month Trend: 30% Central vs Outer Ward Gap
- Hotel Category Mix Explains Half of City ADR: 34 Municipalities