

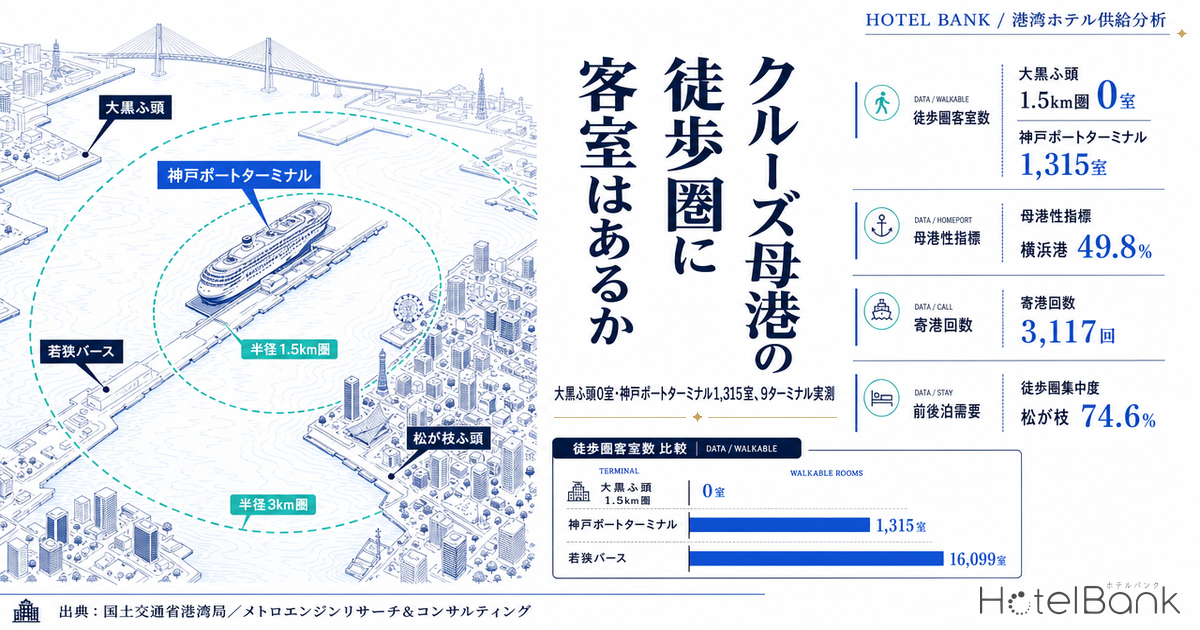
The berths that handle the largest cruise ships are the ones with the fewest hotels within walking distance. At the Port of Yokohama, the Daikoku Pier Passenger Terminal — where mega-ships too tall to pass under the Yokohama Bay Bridge dock — has zero properties and zero rooms within a 1.5km radius. Kobe Port Terminal, the Port of Kobe’s large-ship berth, has just 4 properties and 1,315 rooms. By contrast, Osanbashi Pier, which connects directly to downtown Yokohama, has 54 properties and 9,891 rooms, and Naha Port’s Wakasa Berth has 280 properties and 16,099 rooms. Ports that all count as “cruise ports of call” turn out to offer completely different lodging capacity once you look at the individual berth.
This analysis starts from one premise: a ranking of port calls is not a ranking of lodging demand. On a day call (transit call), passengers return to the ship in the evening and generate almost no hotel stays on land; overnight demand arises only from turnaround calls, where passengers embark and disembark. On that basis, we measured walking-distance room supply, the weekday demand base, and price levels for 9 terminals at 5 major ports, and quantified the development potential of port-adjacent land.
How this article differs from earlier coverage. In Record 3,117 Cruise Calls: Hotel Capacity at Japan’s Top 10 Ports, HotelBank counted room supply for the top 10 ports at the city level. This article drills down from the city to the berth (terminal), measuring supply within 1.5km and 3km radii and overlaying the local employment and residential base and the supply pipeline. Our facility-proximity supply analyses include 6 Japan Exhibition Venues: 87x Room Gap in 5km and B.League Premier Arenas: 103x Gap in 2km Rooms, which cover different facility types. For transport hubs, we have covered international catchments of 20 regional airports and 10km catchments of 50 smart interchanges under construction. This is our first article to use ports as an investment lens.
Metric Definitions Used in This Article
- ADR (Average Daily Rate): An estimated settled rate (tax-exclusive equivalent), calculated by applying property-type correction factors to the lowest plan price each property publishes on OTAs (per room, 2 guests per room, tax-inclusive). Checked against property-level results disclosed by listed hotel REITs (91 properties, most recent 3 months), the median error is about 7%. These are estimates and differ from each property’s actual transaction prices and accounting figures. Area-level ADR is the median of the properties covered (the level of a typical property in the area).
- Listed price: The average price of all plans published on OTAs (per room, 2 guests per room, tax-inclusive). Because it includes everything from room-only to meal-inclusive plans, it runs higher than the estimated settled ADR. It is treated as a separate metric from ADR.
- Turnaround call: A cruise on which passengers embark or disembark at that port, generating pre-cruise and post-cruise hotel stays. Day call (transit call): A stop partway through an itinerary; passengers come ashore during the day and return to the ship in the evening, so almost no land-based lodging is generated.
- Home-port indicator: The share of a port’s 2025 cruise calls made by ships operated by Japanese cruise lines. Because Japanese-operated ships generally sail round trips from Japan, we use this as an outward proxy for a port’s role as an embarkation port (it has limitations, described below).
- Walking-distance concentration: Rooms within a 1.5km radius of a terminal divided by rooms within a 3km radius. A comparison metric devised for this article to show whether inventory sits right next to the berth or in a more distant downtown.
- Data sources: Port calls and passenger numbers = MLIT Ports and Harbours Bureau / Lodging supply and prices = MetroEngines Research / Employment = MIC and METI Economic Census / Resident population = MLIT National Land Numerical Information
- — Of 3,117 calls, 765 (24.5%) were by Japanese cruise lines. Only two ports score high on the home-port indicator — Yokohama at 49.8% and Kobe at 30.3% — while Nagasaki, at 2.0%, is an entirely different kind of port.
- — At the berth level, capacity is discontinuous. Daikoku Pier Passenger Terminal has 0 properties and 0 rooms within 1.5km; Kobe Port Terminal has 4 properties and 1,315 rooms. That is an order of magnitude below other berths in the same ports (Shinko Pier: 84 properties, 16,122 rooms; Naka Pier: 64 properties, 7,436 rooms).
- — Walking-distance concentration splits ports into those with inventory close to the berth — Matsugae 74.6%, Shinko Pier 66.5%, Wakasa 60.8% — and those where inventory sits farther away in downtown, such as Hakata Central Pier 17.9%, Kobe Port Terminal 11.2% and Naha Shinko Pier 1.8%.
- — A 2,000-passenger turnaround with a 50% pre/post-stay rate means 500 rooms for one night. That equals 38.0% of the 1,315 rooms within 1.5km of Kobe Port Terminal, but only 5.1% of Osanbashi’s 9,891 rooms.
- — The weekday demand base around terminals varies widely. Employees within 1.5km number 206,282 at Shinko Pier and 148,051 at Naka Pier, versus 17,418 at Kobe Port Terminal. Cruise demand has to be assessed together with the weekday base, not on its own.
Of 3,117 calls, where does overnight demand arise? — Separating day calls from turnarounds
According to “Number of Inbound Cruise Passengers and Cruise Ship Port Calls (2025 Preliminary),” released by the Ministry of Land, Infrastructure, Transport and Tourism (MLIT) Ports and Harbours Bureau on February 20, 2026, cruise ships made 3,117 calls at Japanese ports in 2025, approximately 1.3x the previous year. This exceeded the 2,930 calls recorded in 2018 to set a new record. Ships operated by foreign cruise lines accounted for 2,352 calls (approx. 1.2x YoY) and ships operated by Japanese cruise lines for 765 (approx. 1.4x YoY). Foreign cruise ships called at 93 ports. Inbound cruise passengers totaled 1.767 million (approx. 1.2x YoY).
The key point is that port calls do not translate directly into lodging demand. There are two distinct types of cruise calls. On a day call (transit call) partway through an itinerary, passengers come ashore to sightsee during the day and return to sleep on board in the evening; they have no need to stay in a hotel on land. On a turnaround call, by contrast, passengers board or leave the ship at that port, creating a motive to stay on land the night before embarkation and the night of disembarkation. Lodging demand arises from the latter.
A way to separate the two from published data is the number of calls by ships operated by Japanese cruise lines. Japanese-operated ships generally sail round trips from Japan, so the more Japanese-line calls a port has, the stronger its character as an embarkation port. Organizing MLIT’s published rankings, Hakata Port and the Port of Yokohama tied for first in total 2025 calls with 209 each, followed by Naha Port (205), Nagasaki Port (198) and the Port of Kobe (142). Looking only at Japanese cruise lines, however, the ranking changes: Yokohama leads with 104, followed by Bella Vista Marina (95) and Kobe (43).
Source: Compiled by MetroEngines Research from MLIT Ports and Harbours Bureau, “Number of Inbound Cruise Passengers and Cruise Ship Port Calls (2025 Preliminary)” (released February 20, 2026) (N = top 10 ports)
Yokohama rose from 4th place with 146 calls in 2024 to 209 in 2025, tying Hakata for first. NYK Cruises launched the Asuka III — its first newbuild cruise ship in 34 years — in July 2025 with Yokohama as its home port, which drove the increase in Japanese-line calls (69 in 2024 → 104 in 2025). Mitsui O.S.K. Line’s MITSUI OCEAN FUJI also debuted in December 2024, sailing from Yokohama, Nagoya, Kobe, Hakata and Naha. The roughly 1.4x increase in Japanese-line calls reflects the introduction of these two ships.
Re-sorting by the home-port indicator (the share of calls by Japanese cruise lines) makes the differences in port character clear.
Source: Compiled by MetroEngines Research from MLIT Ports and Harbours Bureau “2025 Preliminary” data (N = top 10 ports; national average = 765 ÷ 3,117 = 24.5%)
| Port | Total calls | Foreign lines | Japanese lines | Home-port indicator | Character |
|---|---|---|---|---|---|
| Hakata Port | 209 | 191 | 18 | 8.6% | Mixed embarkation / transit |
| Port of Yokohama | 209 | 105 | 104 | 49.8% | Embarkation port |
| Naha Port | 205 | 187 | 18 | 8.8% | Mixed embarkation / transit |
| Nagasaki Port | 198 | 194 | 4 | 2.0% | Mainly transit calls |
| Port of Kobe | 142 | 99 | 43 | 30.3% | Embarkation port |
| Ishigaki Port | 130 | 121 | 9 | 6.9% | Mainly transit calls |
| Kagoshima Port | 129 | 122 | 7 | 5.4% | Mainly transit calls |
| Sasebo Port | 128 | 122 | 6 | 4.7% | Mainly transit calls |
| Hiroshima Port | 106 | 100 | 6 | 5.7% | Mainly transit calls |
| Shimizu Port | 105 | 99 | 6 | 5.7% | Mainly transit calls |
Port calls = MLIT Ports and Harbours Bureau, “Number of Inbound Cruise Passengers and Cruise Ship Port Calls (2025 Preliminary)” (released February 20, 2026), Attachment Figures 7 and 8. Japanese-line calls calculated as total minus foreign-line calls. Home-port indicator = Japanese lines ÷ total. N = 10 ports
Only two ports — Yokohama at 49.8% and Kobe at 30.3% — exceed the national average of 24.5%. The rest stay in single digits: Naha 8.8%, Hakata 8.6%, Ishigaki 6.9%. At Nagasaki, 194 of 198 calls were by foreign lines, for a home-port indicator of 2.0%. Nagasaki ranks first in Japan for foreign-line calls with 194, yet calls involving embarkation or disembarkation are very limited. At this point, the ranking of port calls and the ranking of pre/post-cruise lodging demand already diverge.
This indicator has limitations, however. Japanese-operated ships also make transit calls mid-itinerary, so not all 104 calls are turnarounds. Conversely, foreign lines generate turnarounds when they offer Japan-departure cruises. According to MLIT, foreign passengers who mainly fly into Japan to board cruises departing from Japan reached a record 181,000 in 2025, roughly double the 89,000 of 2019. This segment necessarily stays overnight in Japan before boarding. Note that the home-port indicator is a proxy for the direction of a port’s character, not a count of turnaround calls.
How many rooms are within walking distance of home-port berths? — 9 terminals measured
This is the core of the article. Pre- and post-cruise demand originates not from “the city with the port” but from “the berth where passengers embark and disembark.” Passengers with suitcases can walk 1 to 1.5km at most; beyond that is taxi and shuttle-bus territory. We therefore took the coordinates of the 9 terminals where passenger ships actually dock at 5 major ports and measured the number of lodging properties and rooms within 1.5km and 3km radii.
| Port / terminal | Berth character | 1.5km properties | 1.5km rooms | 3km properties | 3km rooms | Walking-distance concentration |
|---|---|---|---|---|---|---|
| Port of Yokohama Osanbashi International Passenger Terminal | Main berth connected to downtown | 54 | 9,891 | 208 | 21,216 | 46.6% |
| Port of Yokohama Shinko Pier Passenger Terminal | Adjacent to Minato Mirai | 84 | 16,122 | 242 | 24,257 | 66.5% |
| Port of Yokohama Daikoku Pier Passenger Terminal | For mega-ships unable to pass under Bay Bridge | 0 | 0 | 1 | 172 | 0.0% |
| Port of Kobe Naka Pier Passenger Terminal | Sannomiya side; small and mid-size ships | 64 | 7,436 | 146 | 15,583 | 47.7% |
| Port of Kobe Kobe Port Terminal | Port Island; large ships | 4 | 1,315 | 87 | 11,712 | 11.2% |
| Hakata Port Central Pier Cruise Center | Main berth near city center | 157 | 7,725 | 667 | 43,263 | 17.9% |
| Naha Port Wakasa Berth | Main berth near city center | 280 | 16,099 | 539 | 26,487 | 60.8% |
| Naha Port Shinko Pier | Shared with cargo operations | 26 | 382 | 399 | 21,138 | 1.8% |
| Nagasaki Port Matsugae International Cruise Terminal | Main berth near city center | 106 | 6,048 | 160 | 8,107 | 74.6% |
Properties and rooms = MetroEngines Research (within radius of terminal coordinates, operating properties, as of September 2026. N = 9 terminals. The catchments of Yokohama’s 3 terminals partly overlap, so the 9 locations are not summed) / Walking-distance concentration = rooms within 1.5km ÷ rooms within 3km
Source: MetroEngines Research (N = 9 terminals, as of September 2026)
Yokohama is the clearest example, with three terminals of very different character in the same port. Shinko Pier Passenger Terminal (Yokohama Hammerhead, opened October 2019) has 84 properties and 16,122 rooms within 1.5km, and Osanbashi International Passenger Terminal has 54 properties and 9,891 rooms. But Daikoku Pier Passenger Terminal, built in 2019 for mega-ships that cannot pass under the Bay Bridge, has 0 properties and 0 rooms within 1.5km — and only 1 property with 172 rooms even at 3km. Walking-distance lodging there has yet to be developed.
The Port of Kobe has the same structure. Naka Pier Passenger Terminal on the Sannomiya side has 64 properties and 7,436 rooms within 1.5km, while Kobe Port Terminal, located on Port Island and handling large ships, has 4 properties and 1,315 rooms. Expanding to 3km brings it to 87 properties and 11,712 rooms, so its walking-distance concentration is a low 11.2%. For now, Kobe’s pre/post-cruise demand is absorbed by inventory across the bridge on the Sannomiya side.
Naha follows the same pattern: Wakasa Berth, close to the city center, is the deepest of all terminals with 280 properties and 16,099 rooms, whereas Shinko Pier, which is shared with cargo operations, has 26 properties and 382 rooms within 1.5km and a walking-distance concentration of 1.8%. Nagasaki’s Matsugae International Cruise Terminal, meanwhile, has 106 properties and 6,048 rooms, and at 74.6% the highest walking-distance concentration of the 9 terminals — tourist anchors such as Glover Garden and Oura Cathedral and lodging inventory are clustered right next to the berth. Hakata’s Central Pier Cruise Center has 157 properties and 7,725 rooms within 1.5km, but because the 3km radius is huge at 667 properties and 43,263 rooms, its concentration is 17.9%. This shows that Fukuoka’s lodging inventory is centered on the Hakata Station and Tenjin side, a 1–3km band away from the berth. Supply trends around Hakata Station and Tenjin are covered in Fukuoka Hotel Supply 2026-2028: ~1,000 Rooms/Year in Hakata & Tenjin.
Source: MetroEngines Research (operating properties with 40+ rooms, as of September 2026, N = 70 properties)
On the map, Yokohama’s lodging inventory is densely clustered in Minato Mirai, Kannai and Bashamichi, while the Daikoku Pier side, across the bay, is blank. The berth where mega-ships dock and the place where rooms are concentrated do not coincide. This is not a question of how well supply and demand are matched, but of growth potential in a location that has yet to be developed.
One ship’s turnaround as a share of walking-distance inventory — Estimating pre/post-stay rooms
Whether walking-distance room supply is large or small cannot be judged from the number alone; it must be set against how many rooms of demand a single turnaround creates. Below is a sensitivity table varying passenger numbers and the pre/post-stay rate. The only assumption is that “passengers who stay before or after the cruise stay 2 per room”; this is a simplified estimate that does not account for actual passenger counts, party composition or multi-night stays.
| Passengers | Pre/post-stay rate 20% | 30% | 50% | 70% |
|---|---|---|---|---|
| 500 | 50 rooms | 75 rooms | 125 rooms | 175 rooms |
| 1,000 | 100 rooms | 150 rooms | 250 rooms | 350 rooms |
| 2,000 | 200 rooms | 300 rooms | 500 rooms | 700 rooms |
| 3,000 | 300 rooms | 450 rooms | 750 rooms | 1,050 rooms |
MetroEngines Research estimate. Simple calculation assuming passengers who stay before or after the cruise stay one night, 2 per room; actual passenger counts, party composition and multi-night stays are not considered
We then compare these room counts with each terminal’s walking-distance inventory. In the case of 2,000 passengers and a 50% pre/post-stay rate (= 500 rooms), that equals 38.0% of the 1,315 rooms within 1.5km of Kobe Port Terminal, 8.3% of Nagasaki Matsugae’s 6,048 rooms, 6.5% of Hakata Central Pier’s 7,725 rooms, 5.1% of Yokohama Osanbashi’s 9,891 rooms, and 3.1% of Naha Wakasa’s 16,099 rooms.
Source: MetroEngines Research (rooms within 1.5km of each terminal, as of September 2026. Pre/post-stay rooms use the Table 3 estimate of 500 rooms as an illustration)
In other words, the same ship can have more than 10x the impact on local inventory depending on which berth it docks at. At berths with thin walking-distance inventory such as Kobe Port Terminal, a single night’s turnaround can equal 30–40% of that inventory — these are locations with ample room to add capacity for pre/post-cruise stays. Conversely, at berths with deep inventory such as Wakasa Berth or Osanbashi, cruises alone do not move the overall market. There, differentiation comes from “products designed to capture cruise demand” (early-morning checkout, large-luggage storage, transfer routes to the port).
How to fill weekdays — The employment and residential base around terminals
Cruise turnarounds happen once or twice a week. Japanese-line calls number only 104 a year at Yokohama and 43 at Kobe. For an investment decision on a hotel on port-adjacent land, the real question is what demand will fill the remaining 360-odd days. We therefore lined up the number of establishments, employees and office-type share (Economic Census) and resident population (National Land Numerical Information 250m mesh) within a 1,500m radius of each terminal.
| Terminal | Establishments | Employees | Office-type share | Rooms within 1.5km | Data coverage |
|---|---|---|---|---|---|
| Yokohama – Osanbashi International Passenger Terminal | 6,001 | 81,253 | 26.0% | 9,891 | Sufficient |
| Yokohama – Shinko Pier Passenger Terminal | 9,751 | 206,282 | 33.4% | 16,122 | Sufficient |
| Yokohama – Daikoku Pier Passenger Terminal | 259 | 4,258 | 3.6% | 0 | Reference only (few boundary areas) |
| Kobe – Naka Pier Passenger Terminal | 11,882 | 148,051 | 21.2% | 7,436 | Sufficient |
| Kobe – Kobe Port Terminal | 748 | 17,418 | 9.4% | 1,315 | Sufficient |
| Hakata – Central Pier Cruise Center | 6,269 | 89,040 | 24.8% | 7,725 | Sufficient |
| Naha – Wakasa Berth | 3,627 | 36,347 | 29.0% | 16,099 | Sufficient |
| Naha – Shinko Pier | 93 | 1,559 | 15.6% | 382 | Reference only (few boundary areas) |
| Nagasaki – Matsugae International Cruise Terminal | 5,374 | 57,005 | 24.6% | 6,048 | Sufficient |
Employment = MIC and METI “Economic Census for Business Activity (2021)” / Boundaries = MIC “2020 Census small areas,” aggregated by MetroEngines Research (N = 9 locations, 1,500m radius). Daikoku Pier and Naha Shinko Pier are reference values because only 1–2 small areas fall within the aggregation. The small number of boundary areas is a data-coverage constraint and does not mean there is no employment
Source: Compiled by MetroEngines Research from MIC and METI “Economic Census for Business Activity (2021)” (N = 7 locations with sufficient coverage only)
The weekday base is deepest around Shinko Pier, with 206,282 employees and a 33.4% office-type share, capturing the Minato Mirai office cluster. Naka Pier is also deep at 148,051 employees (21.2%), drawing on Sannomiya’s commercial and business concentration. Next come Hakata Central Pier (89,040, 24.8%), Osanbashi (81,253, 26.0%), Matsugae (57,005, 24.6%) and Wakasa (36,347, 29.0%). By contrast, the Kobe Port Terminal area has 17,418 employees and a 9.4% office-type share, reflecting Port Island’s character — its business base is limited. Rather than filling weekdays with business demand, a design that pairs the hotel with Port Island’s cluster of convention, university and sports facilities is a better fit here.
Note that the Daikoku Pier area (259 establishments, 4,258 employees) and the Naha Shinko Pier area (93 establishments, 1,559 employees) are each based on only 1 and 2 boundary small areas, respectively. This is a matter of statistical coverage units and does not indicate that actual employment is at this level. We do not use employment data as a demand basis for these two locations.
Turning to residents: the estimated 2025 population within 1,500m is 38,017 around Hakata Central Pier, 32,437 around Matsugae, 22,069 around Osanbashi, 21,145 around Wakasa and 16,193 around Kobe Port Terminal. Comparing 2040 projections with 2020, the areas diverge: Osanbashi +5.2%, Hakata Central Pier +4.5%, Kobe Port Terminal +0.6%, Wakasa −10.7% and Matsugae −21.4%. The more a catchment’s resident population is projected to shrink, the more it matters to build lodging demand from outside visitors — and pre/post-cruise stays are one candidate source of that external demand.
Source: MLIT National Land Numerical Information (future population estimates by 250m mesh, FY2024 estimates) (1,500m radius, 250m mesh, N = 76 meshes)
Mapping resident-population meshes around Nagasaki’s Matsugae Pier shows the Minamiyamate, Oura and Doza neighborhoods pressed right up against the back of the berth. The 74.6% walking-distance concentration comes from this geographic closeness. Note that this is resident population (census-based), not daytime or transient population.
Price levels — Estimated settled ADR and listed prices in 5 cities
The other axis of an investment decision is price. We checked monthly data for the most recent 12 months (August 2025–July 2026) in the 5 cities/wards where the terminals are located. The metric is estimated settled ADR (tax-exclusive equivalent), shown alongside the listed price (2 guests per room, tax-inclusive, average of all plans). The two use different bases, so please do not compare them as the same “price.”
| City / ward | Est. settled ADR | YoY | Listed price | Months covered | Properties (median) |
|---|---|---|---|---|---|
| Hakata Ward, Fukuoka | ¥14,300 | +11.1% | ¥25,500 | 12 | 146 |
| Naka Ward, Yokohama | ¥11,800 | +7.5% | ¥19,900 | 12 | 51 |
| Chuo Ward, Kobe | ¥11,700 | +12.9% | ¥20,000 | 11 | 63 |
| Naha | ¥10,200 | +19.6% | ¥15,300 | 12 | 139 |
| Nagasaki | ¥10,100 | -5.9% | ¥19,600 | 12 | 63 |
Source: MetroEngines Research. Both estimated settled ADR and listed prices cover closed (actual-based) months only; months in which the number of properties covered fell below 60% of the series median were excluded (Chuo Ward, Kobe excludes November 2025, for 11 months). Property count is the monthly median of properties covered in the estimated settled ADR
Source: MetroEngines Research (August 2025–July 2026, N = 5 cities/wards, 11–12 months)
Estimated settled ADR is highest in Hakata Ward, Fukuoka, at about ¥14,300, up 11.1% YoY. It is followed by Naka Ward, Yokohama at about ¥11,800 (+7.5%), Chuo Ward, Kobe at about ¥11,700 (+12.9%), Naha at about ¥10,200 (+19.6%) and Nagasaki at about ¥10,100 (−5.9%). Naha shows the strongest growth. How prices move on the call days themselves is examined for three ports in Hotel Pricing on Cruise Port Days: ADR Premium Analysis for Yokohama, Kobe & Naha.
Nagasaki’s year-on-year decline is best read alongside supply-side movements. Within 1.5km of Matsugae Pier, 16 properties with 684 rooms have newly appeared on listings since 2023, including two with more than 100 rooms (207 and 186 rooms). When capacity is being built out, per-property price levels tend to level off for a while. It is reasonable to view this as a phase that precedes further upside.
Supply pipeline — New openings and building plans around the terminals
We check how walking-distance capacity is changing using two sources: actual openings and building plans. The two mean different things, so we treat them separately.
| Terminal | Properties | Rooms | Total rooms within 1.5km | Notes |
|---|---|---|---|---|
| Port of Yokohama – Osanbashi | 6 | 851 | 9,891 | 3 with 100+ rooms: 276, 242 and 175 rooms |
| Hakata Port – Central Pier | 20 | 403 | 7,725 | Mostly small properties, except one with 255 rooms |
| Port of Kobe – Kobe Port Terminal | 0 | 0 | 1,315 | No new openings observed within 1.5km |
| Naha Port – Wakasa Berth | 23 | 1,794 | 16,099 | 5 with 200+ rooms: 366, 257, 257, 223 and 216 rooms |
| Nagasaki Port – Matsugae | 16 | 684 | 6,048 | 2 with 100+ rooms: 207 and 186 rooms |
Source: MetroEngines Research (based on confirmed OTA listings, N = 5 terminals, as of September 2026). OTA listings appear several months before opening, so figures for the most recent months may rise as further listings appear
Over the past three-plus years, the largest build-out has been around Naha Port’s Wakasa Berth, with 23 properties and 1,794 rooms, including five with 200+ rooms (366, 257, 257, 223 and 216 rooms). The Osanbashi area in Yokohama added 6 properties and 851 rooms, 3 of them with 100+ rooms. The Matsugae area in Nagasaki added 16 properties and 684 rooms. The Central Pier area at Hakata added 20 properties and 403 rooms — many openings, but small ones, mostly compact properties apart from one with 255 rooms. No new openings have been observed within 1.5km of Kobe Port Terminal.
On the building-plan side: among planning-stage projects based on MLIT’s Statistical Survey on Building Construction, those in the 5 target cities are a 272-room project in Kitanaka-dori 6-chome, Naka Ward, Yokohama (scheduled completion May 2027; a mixed-use development of apartments, hotel and parking by Daiwa Jisho and Sumitomo Realty & Development), a 223-room project in Onoedori, Chuo Ward, Kobe (scheduled completion July 2027), and a 70-room project in Kumoidori 5-chome, also in Chuo Ward, Kobe (scheduled completion December 2027; a mixed-use development of hotel, offices, retail and a bus terminal). No relevant projects were found in Fukuoka, Naha or Nagasaki.
* Building plans are based on building-confirmation applications as of the survey date; applications are typically filed 1–2 years before opening. The number of projects and rooms is expected to increase as further applications are filed, so treat these as a lower bound on the confirmed pipeline at this point. The absence of a relevant project does not mean that no plans exist.
Both Kobe projects in Chuo Ward are on the Sannomiya side and affect the Naka Pier Passenger Terminal catchment. Within walking distance of Kobe Port Terminal, no projects are visible even at the planning stage. For landowners with port-adjacent sites, this is the development opportunity with the least competition.
How much demand is that per year? — Pre/post-stay room nights under 3 scenarios
Table 3 showed the rooms generated by a single turnaround. To put this into a business plan, it needs to be built up into annual room nights and converted into annual revenue. Here we use Japanese-line call counts from Table 1 as a proxy for turnaround counts and vary passenger numbers and the pre/post-stay rate across three scenarios. Rates use the estimated settled ADR from Table 5 (12-month average, August 2025–July 2026).
The scenarios are: Pessimistic = 1,000 passengers, 20% pre/post-stay rate (100 rooms per call); Base = 2,000 passengers, 30% (300 rooms per call); Optimistic = 2,000 passengers, 50% (500 rooms per call). All use the same assumption as Table 3 — “passengers who stay before or after the cruise stay one night, 2 per room” — and count only one night per turnaround.
| Port | Japanese-line calls (2025) | Est. settled ADR | Pessimistic (100 rooms/call) | Base (300 rooms/call) | Optimistic (500 rooms/call) |
|---|---|---|---|---|---|
| Port of Yokohama | 104 | ¥11,800 | 10,400 RN ¥123M / avg 28 rooms/day | 31,200 RN ¥368M / avg 85 rooms/day | 52,000 RN ¥614M / avg 142 rooms/day |
| Port of Kobe | 43 | ¥11,700 | 4,300 RN ¥50M / avg 12 rooms/day | 12,900 RN ¥151M / avg 35 rooms/day | 21,500 RN ¥252M / avg 59 rooms/day |
| Hakata Port | 18 | ¥14,300 | 1,800 RN ¥26M / avg 5 rooms/day | 5,400 RN ¥77M / avg 15 rooms/day | 9,000 RN ¥129M / avg 25 rooms/day |
| Naha Port | 18 | ¥10,200 | 1,800 RN ¥18M / avg 5 rooms/day | 5,400 RN ¥55M / avg 15 rooms/day | 9,000 RN ¥92M / avg 25 rooms/day |
| Nagasaki Port | 4 | ¥10,100 | 400 RN ¥4M / avg 1 rooms/day | 1,200 RN ¥12M / avg 3 rooms/day | 2,000 RN ¥20M / avg 5 rooms/day |
Source: Port calls = MLIT Ports and Harbours Bureau, “Number of Inbound Cruise Passengers and Cruise Ship Port Calls (2025 Preliminary)” (released February 20, 2026); estimated settled ADR = MetroEngines Research (August 2025–July 2026, N = 5 cities/wards, 11–12 months). Japanese-line call counts are a proxy for home-port character, not turnaround counts, and include day calls by Japanese lines. Pre/post-stay rates and passenger numbers are assumptions, not measured values. RN = room nights
In the Base scenario, the Port of Yokohama generates 31,200 pre/post-stay room nights a year — about ¥368M in annual room revenue at an estimated settled ADR of ¥11,800. Kobe comes to 12,900 room nights and ¥151M, Hakata 5,400 and ¥77M, Naha 5,400 and ¥55M, and Nagasaki 1,200 and ¥12M. The home-port indicator ranking shows up directly as the ranking of demand volume.
An important caveat is that this demand is spread thinly across 365 days. Averaged daily, the Base scenario comes to only 85 rooms/day for Yokohama and 35 rooms/day for Kobe. A 150-room hotel running at 70% occupancy year-round sells 105 rooms a day, so Yokohama’s pre/post-cruise demand equates to a little less than one such hotel over the year. As noted in the three types described below, this is not demand on which a business plan can be built by cruises alone; it is more practical to read it as demand layered on top of a weekday base.
On turnaround days, on the other hand, demand concentrates into a single night. Even in Yokohama’s Base scenario, 300 rooms materialize on one specific night per call — 3.5x the daily average of 85. The thinner the walking-distance inventory at a berth, the more this concentration affects pricing: 300 rooms equals 22.8% of the 1,315 rooms within 1.5km of Kobe Port Terminal. The focus of revenue design is not the annual average but how to capture that one turnaround night.
What to look for as an investment — Three types of port-adjacent land
Summarizing the measurements so far, land adjacent to cruise ports falls into three types. None is inherently superior; each requires a different design.
1. Blank-berth type
Daikoku Pier (0 rooms within 1.5km), Kobe Port Terminal (4 properties, 1,315 rooms), Naha Shinko Pier (26 properties, 382 rooms). These berths handle mega- or large ships, yet walking-distance lodging is undeveloped and there is effectively no competition. The weekday base is thin, however, so a design combining demand from adjacent facilities — conventions, universities, logistics — is a prerequisite. The fact that a 2,000-passenger turnaround can equal 30–40% of walking-distance inventory is this type’s biggest upside.
2. Directly connected, deep-inventory type
Osanbashi (54 properties, 9,891 rooms), Shinko Pier (84 properties, 16,122 rooms), Wakasa Berth (280 properties, 16,099 rooms), Naka Pier (64 properties, 7,436 rooms). The berth and downtown are close and inventory is deep. Here, rather than room volume itself, there is room to win through product design that serves pre/post-cruise stays (early-morning and late-night access, temporary large-luggage storage, routes to the port, multilingual boarding information). The weekday base is also deep, which helps underpin occupancy.
3. Transit-call / conversion type
Nagasaki Port (home-port indicator 2.0%; No. 1 in Japan for foreign-line calls with 194), plus Sasebo, Ishigaki and Kagoshima. Call volumes are among the highest in Japan, but calls with embarkation or disembarkation are limited. The issue is not room volume but demand conversion: whether the port can gain an embarkation function for Japan-departure cruises, and whether stay itineraries can be created for the day before and after a call. Matsugae Pier stands out with a 74.6% walking-distance concentration, so the conditions for pursuing conversion are in place.
A common point to note: pre/post-cruise demand arises not on the call day itself but on the day before and the day after. Hotel inventory moves one day ahead of or one day behind the port-call calendar, and because calls fall on any day of the week, much of the demand lands on weekdays. In a business plan, this should be factored in as a driver that lifts weekday occupancy.
Conclusion
The 3,117 calls in 2025 set a record, but only 765 (24.5%) were by Japanese cruise lines. Lodging demand arises from turnarounds involving embarkation and disembarkation, and on the home-port indicator Yokohama (49.8%) and Kobe (30.3%) stand out — an entirely different profile from Nagasaki (2.0%). Reading the port-call ranking as a lodging-demand ranking leads to wrong decisions.
Drilling down to the berth level then reveals discontinuities in capacity that city-level totals cannot show. Within the same Port of Yokohama, Shinko Pier has 16,122 rooms within 1.5km while Daikoku Pier has 0. Within the same Port of Kobe, Naka Pier has 7,436 rooms while Kobe Port Terminal has 1,315. Against a demand scale of 500 rooms a night for 2,000 passengers at a 50% pre/post-stay rate, these gaps are decisive for investment decisions.
For landowners with port-adjacent sites, real-estate divisions of regional financial institutions, and development teams at hotel operators, there are three practical implications. First, define the unit of demand as the “berth,” not the “port.” Second, do not build a business plan on cruises alone; design how weekdays will be filled first, combining the employment and residential base within 1.5km. Third, the thinner the walking-distance inventory at a berth, the less competition exists and the greater the growth potential as a base for pre/post-cruise stays. With foreign visitors on Japan-departure cruises hitting a record 181,000, this opportunity will come under increasing scrutiny.
Related Articles
- Record 3,117 Cruise Calls: Hotel Capacity at Japan’s Top 10 Ports
- Asian Games 2026: 1,500 Ship Rooms vs Nagoya’s 28,986-Room Stock
- 6 Japan Exhibition Venues: 87x Room Gap in 5km, Show Lift Max +5.8pt
- Winter Schedule Oct 25: Do 20 Regional Airports Have Enough Rooms?
- Japan’s 50 Smart Interchanges: Median 1,130 Hotel Rooms Within 10km
- Hotel Pricing on Cruise Port Days: ADR Premium Analysis for Yokohama, Kobe & Naha
- Fukuoka Hotel Supply 2026-2028: ~1,000 Rooms/Year in Hakata & Tenjin
References and Sources
■ Data sources
Port calls and inbound cruise passenger numbers are from the MLIT Ports and Harbours Bureau 2025 preliminary figures (released February 20, 2026) and the port-level figures in its attachment. Lodging supply (properties and rooms within 1.5km / 3km of each terminal) was aggregated from the MetroEngines Research lodging property master (operating properties with 40+ rooms, as of September 2026) via distance search from the coordinates of the 9 terminals. Prices are the company’s monthly series of estimated settled ADR and listed prices (August 2025–July 2026). Employee counts are from the Economic Census for Business Activity (2021) and resident population from the National Land Numerical Information future population estimates by 250m mesh (FY2024 estimates), both aggregated within a 1,500m radius.
■ Assumptions
The home-port indicator is the share of a port’s calls made by ships operated by Japanese cruise lines, used as a proxy for the port’s character as an embarkation port. Walking-distance concentration = rooms within 1.5km ÷ rooms within 3km. Pre/post-stay rooms (Table 3) and annual room nights (Table 7) are simple calculations based solely on the assumption that “passengers who stay before or after the cruise stay one night, 2 per room”; passenger numbers and pre/post-stay rates are assumed values. Table 7 uses Japanese-line call counts as a proxy for turnaround counts, counts only one night per turnaround, and uses the 12-month average estimated settled ADR from Table 5. Price series cover closed months only, excluding months in which the number of properties covered fell below 60% of the series median (Chuo Ward, Kobe excludes November 2025, for 11 months).
■ Limitations
Japanese-line calls include day calls without embarkation, so the home-port indicator and the turnaround counts in Table 7 do not match actual turnaround counts. Actual passenger counts, party composition, multi-night stays and call cancellations are not considered, so Tables 3 and 7 are estimates for gauging the order of magnitude of demand, not business-plan figures. Estimated settled ADR is an estimate derived by applying property-type corrections to published prices; the median error against listed hotel REIT disclosures is about 7%. Room counts are limited to properties whose listings could be confirmed and exclude unlisted or temporarily closed properties. For terminals without employment data coverage (Daikoku Pier and Naha Shinko Pier), the gap reflects missing data, not zero employment. Building plans are based on building-confirmation applications and do not guarantee construction or opening.
■ Government statistics and primary sources
- MLIT, “Number of Inbound Cruise Passengers and Cruise Ship Port Calls (2025 Preliminary)” (released February 20, 2026) [Japanese]
- Same, attachment (PDF) — port calls by port, Figures 7, 8 and 9 [Japanese]
- Same, press release (PDF) [Japanese]
- MIC and METI, “Economic Census for Business Activity (2021)” / Boundaries = MIC “2020 Census small areas” (e-Stat Statistical GIS)
- MLIT National Land Numerical Information, “Future population estimates by 250m mesh (FY2024 estimates)”
- MLIT, “Statistical Survey on Building Construction” (building plans, based on confirmation applications)
■ Port and terminal information
- Yokohama Convention & Visitors Bureau, “Daikoku Pier Passenger Terminal” [Japanese]
- Osanbashi Yokohama International Passenger Terminal, “Other passenger terminals” [Japanese]
- City of Yokohama Port and Harbor Bureau, “Outlook for the Port of Yokohama as a Cruise Hub” (April 25, 2025, PDF) [Japanese]
- Yokohama Keizai Shimbun, “NYK Cruises’ first newbuild ship in 34 years, Asuka III, to be home-ported in Yokohama” [Japanese]
- Mitsui Ocean Cruises, “MITSUI OCEAN FUJI” official site
■ Lodging supply and price data
- MetroEngines Research — lodging property master (properties and rooms within terminal radii, as of September 2026), estimated settled ADR and listed prices (monthly, August 2024–July 2026), new openings (based on confirmed OTA listings)