

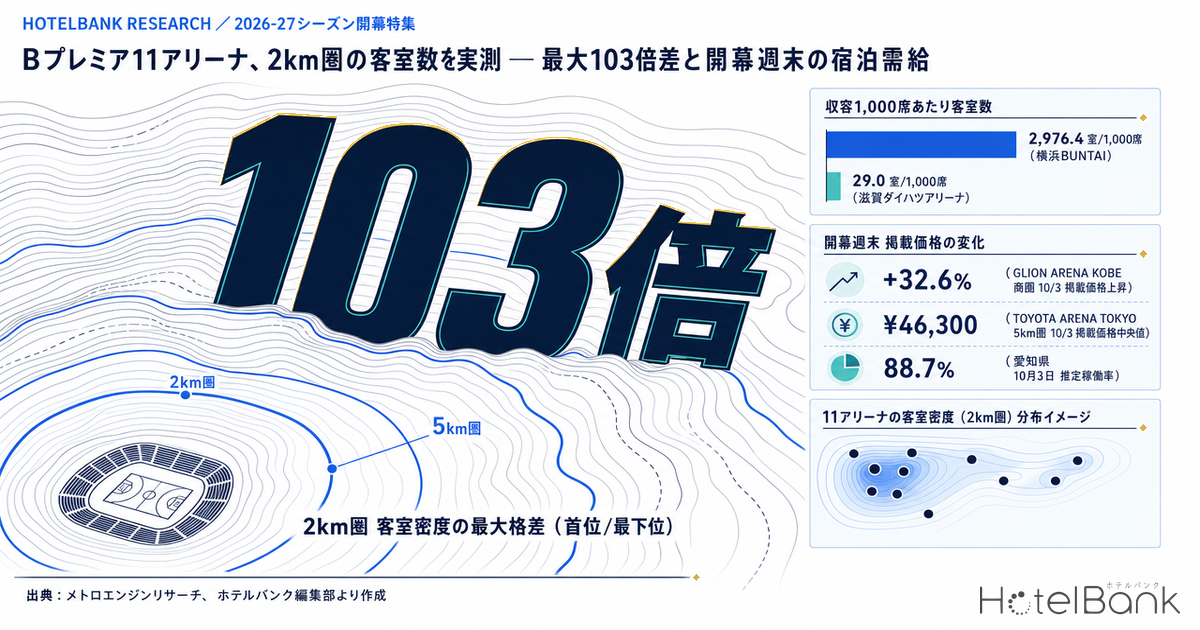
On 22 September 2026, B.LEAGUE PREMIER (B.Premier) tips off. It is the first season of “B.Kakushin,” the league restructuring that scraps promotion and relegation based on competitive results and instead composes the leagues around business scale and arena requirements. Clubs entering the top tier were required to have a home arena with a capacity of at least 5,000 seats (fixed seats plus retractable seating and club-installed temporary seats). The result has been a wave of large arenas opening across the country over the past few years. So how much lodging capacity actually sits around them? For the 11 venues we could confirm through official sources, this article measures the number of properties and rooms within a 2km and 5km radius using MetroEngines Research data, and converts them into rooms per 1,000 seats of capacity to compare the depth of each catchment. The headline finding: room density within 2km varies by roughly 103x between the top and bottom venues.
Metric Definitions Used in This Article
- ADR (Average Daily Rate): An estimated transacted rate (tax-excluded equivalent) derived by applying category-specific adjustment factors to each property’s lowest advertised plan level on OTAs and other channels (2 guests per room, per-room rate, tax included). Cross-checked against per-property results disclosed by listed hotel REITs, the median error is about 7%. It is an estimate and differs from each property’s actual transacted prices and accounting figures. Area-level ADR is the median across the properties covered (the level of a typical property in that area).
- Advertised Price: The average price across all plans published on OTAs and other channels at the time of the survey (2 guests per room, per-room rate, tax included). The daily prices in this article are on this advertised-price basis, which sits at a different level from ADR (the estimated transacted rate).
- OCC (Occupancy Rate): The ratio of rooms sold to total rooms in the area (estimated from OTA sales inventory; consistency checks against REIT monthly disclosures confirm accuracy within roughly a few percentage points).
- LT (Lead Time): Days remaining until the check-in date. LT0 = same day.
- Rooms per 1,000 seats: Total rooms in the arena catchment ÷ arena capacity × 1,000. A normalized indicator of lodging supply depth relative to venue size.
- Data Source: MetroEngines Research
- — Room density within 2km across the 11 venues ranges from 29 to 2,976 rooms per 1,000 seats, a roughly 103x gap. Venues embedded in an existing lodging cluster and venues standing alone present completely different assumptions for visiting fans.
- — On Saturday 3 October 2026, shortly after the season opener, advertised prices exceeded those of Saturday 26 September at 9 of the 10 venues outside Aichi Prefecture (+2.9% to +32.6%).
- — The largest increase was +32.6% in the GLION ARENA KOBE catchment (¥28,700 → ¥38,100, N=60 properties). That said, it is the result of multiple overlapping factors including the autumn travel season and other events, and the season-opening effect cannot be isolated from it.
- — Lodging demand from one sold-out game works out to roughly 56 rooms per 1,000 seats (10% of attendees staying overnight from out of town, 1.8 guests per room). At urban venues that is a fraction of catchment inventory, but Shiga, Maishima and Okinawa cannot cover it within 2km alone.
- — Of the 337 properties across the arena catchments, 206 (61.1%) released less than 30% of their total rooms to OTAs. Zero rooms remaining does not mean the property is full.
The Opener Is 22 September; Coverage Is the 11 Venues We Could Officially Confirm
According to B.LEAGUE, the opening game of the 2026-27 season is on Tuesday 22 September 2026, with Alvark Tokyo hosting the Ryukyu Golden Kings at TOYOTA ARENA TOKYO — the same fixture on the same date as the league’s inaugural game in 2016.
This analysis is limited to the 11 venues that could be confirmed as home arenas through B.LEAGUE official sources and facility disclosures, and whose capacity has been published. Venues still under construction or at a provisional-name stage, and venues whose official capacity could not be confirmed, are excluded. This is therefore not an exhaustive list of every B.Premier club, but a quantitative comparison across what could be verified.
| Arena / Club · Location | Capacity (seats) |
2km Props. |
2km Rooms |
2km Rooms/1,000 seats |
5km Props. |
5km Rooms |
5km Rooms/1,000 seats |
|---|---|---|---|---|---|---|---|
| Yokohama BUNTAI Yokohama B-Corsairs / Naka-ku, Yokohama |
5,000 | 87 | 14,882 | 2,976.4 | 111 | 18,901 | 3,780.2 |
| Hiroshima Green Arena Hiroshima Dragonflies / Naka-ku, Hiroshima |
10,000 | 155 | 14,835 | 1,483.5 | 194 | 17,477 | 1,747.7 |
| GLION ARENA KOBE Kobe Storks / Chuo-ku, Kobe |
10,000 | 67 | 9,509 | 950.9 | 93 | 12,789 | 1,278.9 |
| Happiness Arena Nagasaki Velca / Nagasaki City, Nagasaki |
6,000 | 69 | 4,808 | 801.3 | 123 | 7,331 | 1,221.8 |
| TOYOTA ARENA TOKYO Alvark Tokyo / SunRockers Shibuya / Koto-ku, Tokyo |
10,000 | 8 | 4,757 | 475.7 | 242 | 44,567 | 4,456.7 |
| IG Arena Nagoya Diamond Dolphins / Kita-ku, Nagoya |
17,000 | 31 | 4,690 | 275.9 | 237 | 33,212 | 1,953.6 |
| SAGA Arena Saga Ballooners / Saga City, Saga |
8,400 | 17 | 1,546 | 184.0 | 26 | 1,806 | 215.0 |
| LaLa arena TOKYO-BAY Chiba Jets / Funabashi City, Chiba |
10,000 | 12 | 940 | 94.0 | 26 | 2,635 | 263.5 |
| Okinawa Arena Ryukyu Golden Kings / Okinawa City, Okinawa |
10,000 | 29 | 577 | 57.7 | 135 | 4,499 | 449.9 |
| Ookini Arena Maishima Osaka Evessa / Konohana-ku, Osaka |
7,056 | 5 | 268 | 38.0 | 41 | 7,177 | 1,017.1 |
| Shiga Daihatsu Arena Shiga Lakes / Otsu City, Shiga |
5,000 | 7 | 145 | 29.0 | 33 | 2,230 | 446.0 |
Source: MetroEngines Research; compiled by the HotelBank Editorial Team (based on confirmed OTA listings. 2km zone: 487 properties / 56,957 rooms in total; 5km zone: 1,261 properties / 152,624 rooms in total)
The count covers lodging properties that, within the scope tracked by MetroEngines Research, sit within a 2km or 5km straight-line radius of each venue and had confirmed OTA listings for check-in dates between 18 August and 30 November 2026. Adults-only facilities, bathing facilities, campgrounds and corporate or institutional lodges were excluded, and only properties with a registered room count were included. Ryokan, guesthouses and simple lodging businesses not listed on OTAs are not covered.
A 103x Gap in 2km Room Density — “Downtown” Venues vs “Reclaimed-Land” Venues
Ranked by rooms per 1,000 seats of capacity, the order splits cleanly. Yokohama BUNTAI (Yokohama B-Corsairs) tops the list at 2,976 rooms per 1,000 seats. A relatively compact 5,000-seat venue sits in the middle of Kannai and Isezakicho, one of Yokohama’s densest lodging clusters. Its 2km zone holds 87 properties and 14,882 rooms.
Next come Hiroshima Green Arena (Hiroshima Dragonflies) at 1,483 rooms per 1,000 seats and GLION ARENA KOBE (Kobe Storks) at 951. Both sit in the central districts of prefectural capitals, or on waterfronts connected to them within walking distance, so they can draw directly on existing business and tourism lodging clusters.
The bottom three venues are a different animal. Shiga Daihatsu Arena (Shiga Lakes) has 7 properties and 145 rooms within 2km, or 29 rooms per 1,000 seats; Ookini Arena Maishima (Osaka Evessa) has 5 properties and 268 rooms, or 38 per 1,000 seats; and Okinawa Arena (Ryukyu Golden Kings) has 29 properties and 577 rooms, or 58 per 1,000 seats. The gap to the top venue reaches roughly 103x. Maishima is an artificial island, Shiga Daihatsu Arena sits in a residential area in southern Otsu, and Okinawa Arena is inland in Okinawa City — all large facilities standing alone, away from existing lodging clusters.
Source: MetroEngines Research; compiled by the HotelBank Editorial Team (logarithmic scale. N = 487 properties in the 2km zone / 1,261 in the 5km zone)
What is striking is that some venues change rank sharply between the 2km and 5km zones. TOYOTA ARENA TOKYO has only 8 properties and 4,757 rooms within 2km (476 rooms per 1,000 seats), but widen the radius to 5km and it becomes the largest of all venues at 242 properties, 44,567 rooms and 4,457 rooms per 1,000 seats. It sits in the island-like waterfront area of Odaiba and Aomi, while the 5km zone pulls in the large hotel clusters of Shiodome, Hamamatsucho and Toyosu. IG Arena (Nagoya Diamond Dolphins) follows the same pattern, rising 7.1x from 276 rooms per 1,000 seats within 2km to 1,954 within 5km. Its Meijo Park location on the northern edge of the city center captures the Nagoya Station and Sakae clusters at the 5km radius. The same Meijo Park 5km zone has already absorbed a venue relocation once, when the Nagoya Grand Sumo Tournament moved to IG Arena, so its demand structure is not new territory.
Conversely, SAGA Arena (Saga Ballooners) barely moves, from 184 rooms per 1,000 seats within 2km to 215 within 5km. Saga City’s lodging supply is itself concentrated around the venue, so widening the radius surfaces almost no additional inventory. Ookini Arena Maishima rises to 1,017 rooms per 1,000 seats at 5km, but much of that inventory sits across the bay in Konohana-ku and Minato-ku, and is not as easy to reach as the straight-line distance suggests.
The 11 Venues on a Map — the Shape of Room Distribution
Plotting all 11 venues with the scale of their 2km room supply makes the differences in location type visible. Circle size corresponds to the number of rooms within 2km.
Source: MetroEngines Research; compiled by the HotelBank Editorial Team
Next, two contrasting venues are shown side by side at closer zoom. On the left is Yokohama BUNTAI, with 87 properties packed into its 2km zone; on the right is Ookini Arena Maishima, which has only 41 properties even at 5km, most of them across the bay. Dot size corresponds to each property’s room count.
Yokohama BUNTAI, 2km radius (87 properties, 14,882 rooms)
Ookini Arena Maishima, 5km radius (41 properties, 7,177 rooms)
Source: MetroEngines Research; compiled by the HotelBank Editorial Team
Price-Tier Composition — Where the Inventory Visiting Fans Can Actually Book Sits
Total room count alone does not measure a catchment’s real capacity to absorb visiting fans. Travel demand around sports splits between those keeping accommodation costs down and those building a richer stay around the game. So for each venue’s primary catchment (the 5km zone is used for venues with fewer than 10 properties within 2km), we looked at grade composition on a room-count basis.
Source: MetroEngines Research; compiled by the HotelBank Editorial Team (share of rooms. For properties without a registered grade, the tier was estimated from early-October advertised price bands)
In LaLa arena TOKYO-BAY’s (Chiba Jets) 2km zone, the Budget tier accounts for 61.3% of rooms and there is nothing at High-Grade or above. The venue adjoins the Minami-Funabashi retail cluster, and lodging is concentrated in nearby affordable tiers. SAGA Arena is similar, with Budget at 45.0% and no Luxury-tier inventory.
By contrast, TOYOTA ARENA TOKYO’s 5km zone is nearly 40% upper tiers, with Luxury at 20.9% and High-Grade at 18.6%. Ookini Arena Maishima’s 5km zone is also upper-tier heavy at 22.1% Luxury and 34.7% High-Grade, but that is because large resort hotels line the bay area on the opposite shore, so the real travel distance from the venue is longer than the numbers suggest.
This compositional difference is a direct constraint on how clubs can build game-plus-stay packages. Catchments thin on upper-tier inventory have limited raw material for high-value packages; catchments skewed toward upper tiers tend to be short of options for price-conscious visiting fans. Whether a venue’s drawing power and its catchment’s price mix are matched varies considerably by venue.
How Far Have Advertised Prices Risen in Each Catchment for the First Saturday of October?
With supply depth established, we now measure demand and supply right after the opener. The target date is Saturday 3 October 2026 — about 10 days after the opening game, and the first Saturday of October, when many clubs schedule home games. The comparison date is Saturday 26 September of the same year. 10–12 October is a three-day weekend including Sports Day, and 19–21 September is a three-day weekend including Respect for the Aged Day, so both would be too distorted to serve as a control.
For each venue’s primary catchment, we took the median of per-property daily average advertised prices.
| Arena catchment | Radius | N Props. |
Sat 9/26 median adv. price |
Sat 10/3 median adv. price |
Change | Est. prefecture OCC on 10/3 |
|---|---|---|---|---|---|---|
| Yokohama BUNTAI | 2km | 70 | ¥33,800 | ¥38,700 | +14.5% | Kanagawa 73.8% |
| Hiroshima Green Arena | 2km | 136 | ¥25,700 | ¥31,400 | +22.3% | Hiroshima 72.2% |
| GLION ARENA KOBE | 2km | 60 | ¥28,700 | ¥38,100 | +32.6% | Hyogo 80.9% |
| Happiness Arena | 2km | 63 | ¥21,500 | ¥26,000 | +21.3% | Nagasaki 72.9% |
| TOYOTA ARENA TOKYO | 5km | 211 | ¥38,500 | ¥46,300 | +20.1% | Tokyo 76.5% |
| IG Arena(during the Asian Games) | 2km | 28 | ¥46,600 | ¥39,900 | -14.5% | Aichi 88.7% |
| SAGA Arena | 2km | 17 | ¥18,500 | ¥20,000 | +8.1% | Saga 74.0% |
| LaLa arena TOKYO-BAY | 2km | 11 | ¥19,000 | ¥22,500 | +18.2% | Chiba 70.8% |
| Okinawa Arena | 2km | 26 | ¥15,900 | ¥14,900 | -5.9% | Okinawa 77.6% |
| Ookini Arena Maishima | 5km | 38 | ¥31,200 | ¥36,700 | +17.5% | Osaka 70.1% |
| Shiga Daihatsu Arena | 5km | 31 | ¥26,300 | ¥27,100 | +2.9% | Shiga 76.7% |
Source: MetroEngines Research; compiled by the HotelBank Editorial Team (advertised prices are for 2 guests per room, per-room rate, tax included. Estimated occupancy observed on 17 August 2026, at LT47)
One caveat first: both dates in Aichi Prefecture fall within the 20th Asian Games (Aichi-Nagoya 2026, 19 September – 4 October 2026). The IG Arena catchment’s 14.5% decline from 26 September to 3 October reflects the control date being pushed up by Games demand, so this single case must be read separately from comparisons across arena catchments. The same reason explains why Aichi’s estimated occupancy of 88.7% for 3 October (stays on 3 October 2026, observed 17 August 2026 at LT47, N = 538 properties / 54,249 rooms) is the highest of the 11 prefectures.
Source: MetroEngines Research; compiled by the HotelBank Editorial Team
Excluding Aichi, advertised prices on 3 October exceeded those on 26 September at 9 of the 10 remaining venues. The largest increase was the GLION ARENA KOBE catchment at +32.6% (¥28,700 → ¥38,100, N=60 properties), followed by the Hiroshima Green Arena catchment at +22.3% (¥25,700 → ¥31,400, N=136), the Happiness Arena catchment at +21.3% (¥21,500 → ¥26,000, N=63) and the TOYOTA ARENA TOKYO catchment at +20.1% (¥38,500 → ¥46,300, N=211).
Attribution of cause needs care here. The first Saturday of October is the start of the autumn travel season, and several demand drivers overlap — academic conferences, exhibitions, concerts. Our data measures lodging supply and demand in arena catchments; it cannot attribute the increase to basketball games alone. What can be read from it is the fact that on the weekend just after the opener, these catchments already show advertised price levels 20–30% above a normal Saturday.
The Okinawa Arena catchment moved the other way, with 3 October 5.9% below 26 September (¥15,900 → ¥14,900, N=26 properties). Estimated occupancy for Okinawa Prefecture as a whole is by no means low at 77.6% (N = 1,160 properties / 52,888 rooms), but lodging supply in central Okinawa City totals only 577 rooms, so prefecture-wide conditions and prices around the venue do not track each other closely. The Shiga Daihatsu Arena catchment was also roughly flat at +2.9%.
Source: MetroEngines Research; compiled by the HotelBank Editorial Team (check-in 3 October 2026, observed 17 August 2026 at LT47. Estimated from OTA sales inventory)
At the prefecture level, the estimated occupancy furthest along for stays on 3 October 2026 as of LT47 (observed 17 August 2026) is Aichi at 88.7%, followed by Hyogo at 80.9% (N = 817 properties / 35,052 rooms), Okinawa at 77.6%, Shiga at 76.7% (N = 222 / 10,406) and Tokyo at 76.5% (N = 1,344 / 182,496). The loosest are Osaka at 70.1% (N = 717 / 111,005) and Chiba at 70.8% (N = 700 / 48,258). Hyogo’s high reading points in the same direction as the advertised price increase in the GLION ARENA KOBE catchment (+32.6%).
* Interpretation constraints:The occupancy figures in this article are macro aggregates at the prefecture level; we do not compute occupancy for individual properties or arena catchments. Errors from inventory release timing and channel allocation average out in macro aggregates, but reliability cannot be assured at narrow geographies. The survey point is also 47 days before 3 October 2026, so inventory take-up at this stage is a work in progress. Additional inventory and last-minute price adjustments will move where things finally land.
Thin OTA Allotments — a Caveat When Reading Arena Catchment Inventory
There is one structural constraint on tracking arena catchment inventory property by property. For properties with 50 or more rooms in each catchment, we could confirm remaining-room trends for 3 October check-in at 337 properties. Of these, 206 (61.1%) had rooms listed on OTAs amounting to less than 30% of their total room count throughout the observation period. By venue, the GLION ARENA KOBE catchment had the highest share at 38 of 47 properties (80.9%), with a median peak allotment of 10.1% of total rooms. The Ookini Arena Maishima catchment followed at 73.7% (14 of 19) and the TOYOTA ARENA TOKYO catchment at 67.1% (49 of 73).
In such cases, rooms hitting zero on OTAs does not mean the property is fully booked. It is simply the remaining count within a deliberately small released allotment. There is no single explanation for small allotments; the possibilities include (1) operations centered on non-OTA channels such as direct booking on the official site, call centers, travel agencies and corporate contracts, (2) inventory control that withholds full volume and adds rooms incrementally as check-in approaches, and (3) contractually small OTA allotments in the first place. Public data alone cannot distinguish between them.
Accordingly, when discussing supply and demand in arena catchments, it is safer to read the trend in price levels together with prefecture-level inventory take-up, rather than property-level remaining rooms. That is why this article is structured the way it is.
How Much Lodging Demand Does One Game Generate Relative to Catchment Size?
Comparing arena capacity directly against catchment rooms tells you little, because most spectators live within day-trip range. So we set out a simple estimate to get a sense of scale.
■ Estimate Assumptions
We assume that 10% of attendees at a sold-out game come from far enough away to stay overnight, and that 1.8 guests share a room. Required rooms then works out to “capacity × 10% ÷ 1.8,” equivalent to about 56 rooms per 1,000 seats. Actual visiting-fan ratios vary widely with the fixture, the day of week and how far the opponent travels, so this figure is a yardstick for scale, not a demand forecast for any specific game.
On these assumptions, a sold-out game at a 10,000-seat venue generates demand for roughly 556 rooms. Set against 2km room counts, Yokohama BUNTAI holds 53.5x that inventory, Hiroshima Green Arena 26.7x and GLION ARENA KOBE 17.1x. At urban venues, one game’s worth of visiting-fan demand is a small increment against total catchment inventory. The flip side is that when a game lands on a day where existing lodging demand is already heavy, visiting fans are easily crowded out.
By contrast, Shiga Daihatsu Arena covers only 0.5x, Ookini Arena Maishima 0.7x and Okinawa Arena 1.0x — the 2km zone alone cannot meet the estimated requirement. LaLa arena TOKYO-BAY at 1.7x and SAGA Arena at 3.3x leave little headroom either. At these venues, visiting fans start from the assumption of staying several kilometers away or more.
This estimate is sensitive to the assumptions. Flexing the share of attendees traveling in with an overnight stay and the number of guests per room, required rooms per 1,000 seats falls within the following range.
| Share of attendees staying overnight | 1.6 guests/room | 1.8 guests/room (base) | 2.0 guests/room |
|---|---|---|---|
| 5% | 31.2 | 27.8 | 25.0 |
| 10% | 62.5 | 55.6 | 50.0 |
| 15% | 93.8 | 83.3 | 75.0 |
Source: estimate by the HotelBank Editorial Team (the base case used in the text is shown in blue)
For a sold-out game at a 10,000-seat venue, required rooms range from 250 to 938, with the base case of 556 sitting in the middle. At Yokohama BUNTAI, with 14,882 rooms within 2km, even the upper bound of 938 is just 6.3% of catchment inventory; at Shiga Daihatsu Arena, with 145 rooms within 2km, even the base case of 278 cannot be met, and the upper bound of 469 is more than three times inventory. Flexing the assumptions does not flip the conclusion about which venues have thick catchments and which do not.
Revenue Opportunities for Hotels — Plays by Venue Type
Everything above translates into concrete opportunities for lodging operators.
Urban venues with thick catchments (Yokohama BUNTAI, Hiroshima Green Arena, GLION ARENA KOBE, TOYOTA ARENA TOKYO) — here visiting-fan demand arrives on top of existing demand. That advertised levels for 3 October are already +14.5% to +32.6% above a normal Saturday confirms these catchments’ drawing power. The upside here lies less in price than in stay design. Operational fit — late check-in after the final buzzer, a later breakfast the next morning, walking-route guidance to the venue — can differentiate a property from same-price competitors. In catchments with deep upper-grade inventory (Luxury and High-Grade combined reach 39.5% around TOYOTA ARENA TOKYO), there is room to build high-value packages around game attendance.
Standalone venues with thin catchments (Shiga Daihatsu Arena, Ookini Arena Maishima, Okinawa Arena, LaLa arena TOKYO-BAY) — here the situation reverses. When 2km inventory is at or below the estimated requirement, nearby rooms become structurally scarce on game days. For surrounding properties, there is room to build the fixture calendar into planning ahead of time and raise prices in stages from an early lead time. That the Shiga Daihatsu Arena catchment currently sits at +2.9% for 3 October and the Okinawa Arena catchment at −5.9% — barely different from a normal Saturday — means, read the other way, that room to reflect the fixture calendar is still on the table.
Venues where inventory only appears once you widen the radius (IG Arena, Ookini Arena Maishima) — here properties several kilometers out also have a chance. IG Arena’s 5km zone holds 237 properties and 33,212 rooms, including the Nagoya Station and Sakae inventory. Properties that can spell out access options and travel time from the venue can effectively neutralize the distance handicap. Where a bay sits in between, as in Maishima’s 5km zone, straight-line distance and actual travel time diverge, so the precision of that guidance determines whether a property gets chosen.
Conclusion
B.Premier’s entry requirement of an arena seating at least 5,000 (including retractable and temporary seats) has produced large arenas across the country. But “the box is built” and “there is somewhere to stay” are two different things. Across the 11 venues examined here, 2km room density ranges from 29 to 2,976 rooms per 1,000 seats — a roughly 103x gap — and the reality facing visiting fans is completely different between a venue placed inside an existing lodging cluster and one standing alone on open ground.
Advertised prices for Saturday 3 October 2026 exceeded those for Saturday 26 September at 9 of the 10 venues outside Aichi. The increases range from +2.9% to +32.6%, directly reflecting how strong supply and demand are in each catchment. That said, the rise is the result of multiple overlapping factors including the autumn travel season and various events, and the effect of the league opener cannot be isolated from it.
The practical implication is nonetheless clear. An arena is a demand engine that reliably produces around 30 home games a year, and those dates are published in advance. The thinner a venue’s catchment, the more value surrounding properties gain from building that known calendar into their pricing and inventory plans. At urban venues with thick catchments, by contrast, the differentiator is operational design matched to how spectators move, rather than price. Identifying the venue type is the first step.
⚠ Note on prices for future dates:The advertised prices for 26 September and 3 October 2026 in this article are averages of selling prices published on OTAs and other channels at the time of the survey, and will move as the check-in date approaches. Please note that new plans and last-minute price adjustments mean current levels may not be where things land. Likewise, the estimated occupancy by prefecture is a work in progress as of LT47.
Related Reading
- World Masters Games 2027 Kansai: 164,707 Rooms Across 50 Venue Cities
- Asian Para Games 2026: Aichi Weekdays Run 12pt Above the Next Week
- Aomori’s First National Sports Games in 49 Years: Prices and Inventory
- Hiroshima 2026: 1,003 New Rooms, City Settled ADR Turns -4.1% in July
- Japan’s Autumn Marathons 2026: Race-Eve Hotel Rates Up to +49.1%
References and Sources
■ League and Venue (Official)
- B.LEAGUE, “All fixtures confirmed for the Resona Group B.LEAGUE 2026-27 season B.PREMIER, B.ONE and B.NEXT, the first year of B.Kakushin” (17 February 2026)
- B.LEAGUE, “Clubs confirmed for entry under B.Kakushin”
- B.LEAGUE, “Home Arena Inspection Requirements [for the 2026-27 B.PREMIER season]” (PDF)
- TOYOTA ARENA TOKYO official site, “Main Arena”
- IG Arena official site, “The global arena ‘IG Arena’ is born”
- GLION ARENA KOBE official site (TOTTEI)
- Okinawa City tourism portal Koza Web, “Okinawa Suntory Arena”
- Ookini Arena Maishima official site, “Main Arena”
- Hiroshima Prefectural Sports Center (Hiroshima Green Arena) facility overview
- Yokohama BUNTAI official site
- Shiga Daihatsu Arena official site, “Facility Guide”
- Japan National Tourism Organization (JNTO) MICE, “Nagasaki Stadium City Happiness Arena”
- LaLa arena TOKYO-BAY official site
■ Event-Related
■ Data Sources
We used MetroEngines Research’s lodging property master (location, room count, category, grade), daily history of OTA advertised prices, and estimated occupancy based on OTA sales inventory. Arena coordinates were identified via the Geospatial Information Authority of Japan’s place-name and address search API, and venue names and capacities were confirmed against B.LEAGUE official figures and disclosures by each facility and municipality. Data was retrieved on 17–18 August 2026.
■ Estimate Assumptions
Catchments are defined as 2km and 5km radii centered on each venue’s coordinates. The 5km zone was adopted as the primary catchment only for venues with fewer than 10 properties within 2km. Advertised prices are per-property daily averages for 2 guests per room, per-room rate, tax included, with the median taken across the catchment. Lodging demand per game assumes 10% of attendees at a sold-out game stay overnight from out of town, with 1.8 guests per room (the range under flexed assumptions is shown in Table 3). Estimated occupancy is at the prefecture level, for 3 October 2026 check-in, observed 17 August 2026 (LT47).
■ Limitations and Caveats
Advertised prices are published prices for future dates, not final outcomes. Estimated occupancy is inferred from OTA sales inventory and diverges from in-house occupancy at properties that release small allotments. The rise in advertised prices results from multiple factors including the autumn travel season, conferences and concerts, and does not isolate the effect of the league opener. Coverage is limited to the 11 venues whose capacity could be officially confirmed, and is not exhaustive of all B.Premier clubs. Both dates in the IG Arena catchment fall within the 20th Asian Games, so they must be read separately from comparisons with other catchments.
■ Market Data
- MetroEngines Research — lodging property location and room-count master, OTA advertised prices, estimated occupancy based on OTA sales inventory (retrieved 17–18 August 2026)
- Geospatial Information Authority of Japan place-name and address search API — identifying arena coordinates