

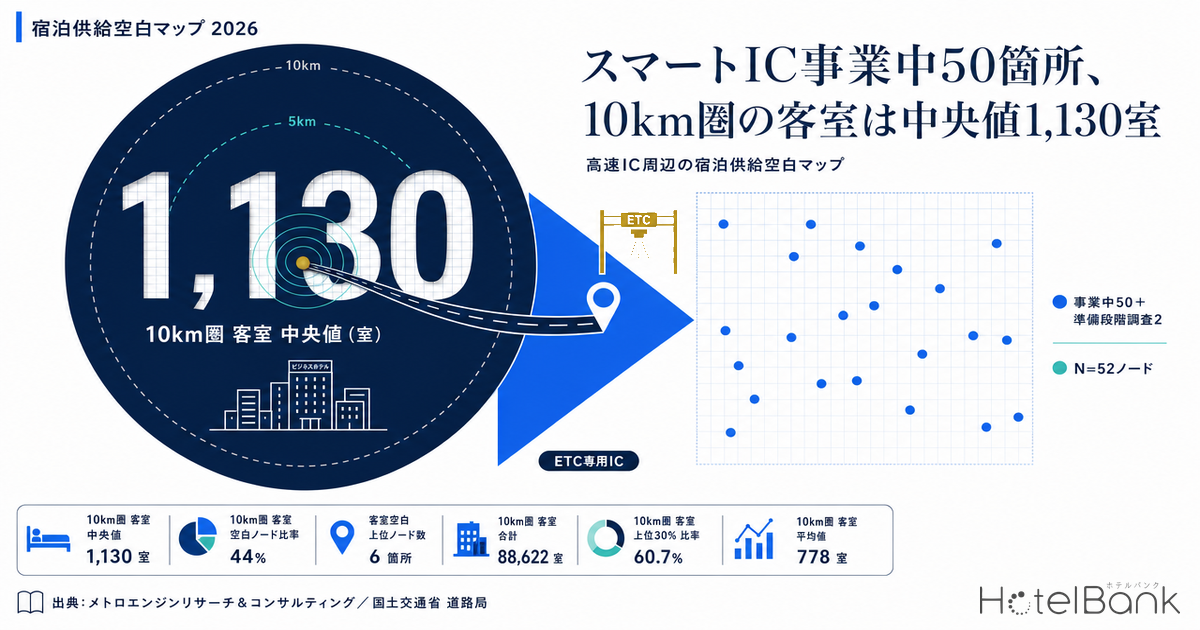
Japan’s Ministry of Land, Infrastructure, Transport and Tourism (MLIT) Road Bureau reports that, as of 5 July 2026, there are 166 smart interchanges (ETC-only expressway interchanges) already open to traffic, 50 under construction, and 2 in preparatory-stage study. This article takes the 52 that have not yet opened (50 under construction plus 2 in preparatory-stage study) and counts how many guest rooms exist today within a 5km and a 10km radius of each. Instead of cutting the transport network at railway stations or airports, it cuts at expressway interchanges — quantifying accommodation supply at locations where demand comes from private cars, rental cars, freight haulage and construction crews.
- — Across the 50 smart interchanges under construction, room stock within a 10km radius has a median of 1,130 rooms. Twenty-two sites (44%) hold fewer than 1,000 rooms — less than a single full-service hotel.
- — Six nodes have zero rooms within a 5km radius (Shintoku, Kake, Odaka, Mibu PA, Sasazaka PA and Hachihonmatsu). The 5km median of 180 rooms against 1,130 rooms at 10km shows existing stock sits on the side of the established built-up area.
- — Rooms per 10,000 residents within 5km has a median of 34.9 rooms — roughly one third of the national average of about 103 rooms computed on the same basis.
- — New openings since 2024 total just 778 rooms across 8 sites within the 10km catchments of all 52 nodes. At the remaining 44 sites, not a single new room can be confirmed over the past two and a half years.
- — At 4 of the 5 newly approved sites, the leading benefit cited by MLIT is industrial parks, logistics and corporate attraction — implying two-stage demand: long-stay during construction, then repeat business travel once operations begin.
Metric Definitions Used in This Article
- Room count / property count: Of the roughly 168,000 domestic properties tracked by MetroEngines Research, the population used here is the 27,249 properties and 1,266,986 rooms whose operation can be confirmed on OTA platforms (as of the aggregation date). Room count is the primary metric and property count the secondary one, because some records in the property master carry no registered room count, so counting properties alone overstates the picture.
- ADR (average daily rate): An estimated settled rate (tax-excluded equivalent) derived by applying category-specific adjustment factors to the lowest published plan level each property lists on OTA platforms (two guests per room, per-room rate, tax included). Cross-checked against property-level results disclosed by listed hotel REITs (91 properties, most recent 3 months), the median error is about 7%. These are estimates and differ from each property’s actual transacted prices or accounting figures. Area-level ADR is the median across the target properties (the level of a typical property in the area). This article uses the 12-month average from August 2025 to July 2026, excluding months with fewer than 3 target properties.
- Residential population: Future population projections by 250m mesh, summed within the given radius of the target point. This is residential population — not daytime, staying or passing population.
- Data sources: MetroEngines Research & Consulting / MLIT Road Bureau / MLIT National Land Numerical Information / Economic Census (Ministry of Internal Affairs and Communications and Ministry of Economy, Trade and Industry)
Median Room Stock Within 10km Is 1,130 — 22 of the 50 Sites Fall Short of 1,000
To start with the conclusion: room stock within a 10km radius of the 50 smart interchanges under construction has a median of 1,130 rooms and a mean of 1,787. The minimum is 11 rooms at Shintoku Smart IC on the Doto Expressway (Shintoku, Hokkaido); the maximum is 13,623 rooms at Koyo Smart IC on the Sanyo Expressway (Asakita Ward, Hiroshima) — a spread of three orders of magnitude. The distribution is heavily weighted to the lower end: 22 sites (44%) hold fewer than 1,000 rooms within 10km, and 36 sites (72%) fewer than 2,000. Junctions with less room stock than a single full-service hotel are about to be newly connected to the expressway network.
Zoom in closer and the outline sharpens. Six sites have zero rooms within a 5km radius (Shintoku, Kake, Odaka, Mibu PA, Sasazaka PA and Hachihonmatsu). Across the 50 sites the median 5km room count is just 180, and the gap against the 1,130 seen at 10km shows that existing room stock sits not near the planned interchange but on the side of the established built-up area. Once an interchange opens, that skew may be reconsidered in terms of traffic flow.
The category mix is overwhelmingly weighted to business hotels at 60.7% (53,797 rooms), followed by city hotels at 19.3% and ryokan at 9.4%. Read the other way: rooms explicitly designed for car-based stays — parking that takes large vehicles, a workable route for loading and unloading, fittings that hold up over consecutive and extended nights, a way to handle late-night arrivals — are barely identifiable anywhere in this population. Most existing stock is station-front business hotels, not buildings laid out for guests arriving by car from an interchange exit.
Population and Positioning — All 52 Sites Analysed, None Excluded
The basis of the aggregation is disclosed here. The subjects are the 50 sites under construction and 2 sites in preparatory-stage study, 52 in total, published on the MLIT Road Bureau’s “Development of Smart Interchanges” page (as of 5 July 2026). Road name, prefecture, site name, connection type and project body (the municipality concerned) were taken from the PDF summary tables. Note that 2 of the 50 under construction (Hasuda Smart IC on the Tohoku Expressway and Kake Smart IC on the Chugoku Expressway) are full-access upgrades — adding entry and exit directions to a smart interchange that is already open, rather than opening a new junction. Strictly speaking, there are 48 genuinely new nodes yet to open.
Because MLIT’s tables identify only the municipality, latitude and longitude were estimated as follows. (1) For service-area and parking-area connections where the SA/PA location can be identified, the actual position was used (5 sites). (2) Where a district name could be identified from press releases or the site name, the nearest point on the relevant expressway from that district centre was used (29 sites). (3) Otherwise, the nearest point on the expressway from the centre of the municipality was used (18 sites). All 52 positions could be estimated by this method; no site was excluded for want of a position. The 18 sites under method (3) can carry errors of several kilometres. Aggregation within a 10km radius is relatively robust to that error, but figures within a 5km radius are sensitive to it — which is why this article treats the 10km radius as the primary metric and does not rest its argument on the 5km figures.
The 18 Thinnest Nodes — Seven Hold Under 300 Rooms Within 10km
The table below ranks nodes by room stock within 10km, lowest first. The top seven hold fewer than 300 rooms within that radius. In this population, 36 nodes (72%) have a largest single property of 250 rooms or fewer within 10km, so each of the nodes below amounts to “drive 10km and you still find only one or two mid-sized properties’ worth of rooms.”
| Smart IC (provisional name) | Location | Rooms 5km | Rooms 10km | Largest property | Est. settled ADR | Population 5km |
|---|---|---|---|---|---|---|
| Shintoku | Shintoku, Hokkaido | 0 | 11 | 11 | ¥10,432 | 2,541 |
| Kake | Akiota, Hiroshima | 0 | 48 | 31 | ¥8,162 | 3,047 |
| Odaka | Minamisoma, Fukushima | 0 | 65 | 50 | ¥5,739 | 2,356 |
| Mibu PA | Mibu, Tochigi | 0 | 196 | 61 | ¥5,738 | 49,648 |
| Kasama PA | Kasama, Ibaraki | 42 | 244 | 150 | ¥9,178 | 25,672 |
| Takahata | Takahata, Yamagata | 116 | 285 | 32 | ¥7,675 | 29,889 |
| Awa-Ichiba | Awa, Tokushima | 63 | 298 | 80 | ¥5,291 | 21,178 |
| Shimotsuke | Shimotsuke, Tochigi | 177 | 380 | 98 | — | 95,701 |
| Joyo | Joyo, Kyoto | 35 | 426 | 109 | — | 243,742 |
| Yamakita | Yamakita, Kanagawa | 55 | 508 | 102 | ¥17,147 | 70,858 |
| Otama | Otama, Fukushima | 47 | 514 | 92 | — | 30,297 |
| Shiroishi-Chuo | Shiroishi, Miyagi | 516 | 516 | 127 | ¥12,233 | 25,153 |
| Shintomi-Nyutabaru | Shintomi, Miyazaki | 112 | 520 | 121 | — | 24,224 |
| Miki | Miki, Hyogo | 171 | 527 | 204 | ¥24,633 | 52,068 |
| Hachimantai | Hachimantai, Iwate | 78 | 566 | 167 | ¥12,535 | 9,726 |
| Togo | Nisshin, Aichi | 18 | 592 | 125 | — | 214,759 |
| Kuromaru | Higashiomi, Shiga | 443 | 603 | 180 | ¥6,547 | 49,226 |
| Sasazaka PA | Kasaoka, Okayama | 0 | 733 | 164 | ¥7,531 | 53,268 |
Two things can be read from this table. First, the scale of the largest property in the catchment. At 36 of the 50 sites under construction (72%), the largest accommodation property within 10km has 250 rooms or fewer. In the table above, several sites have a largest property under 100 rooms. There is no single vessel capable of absorbing large group or corporate demand, which means that when concentrated demand does appear — long stays by construction crews, or the start-up of a logistics facility — it has no choice but to disperse across the surrounding area.
Second, there are 12 municipalities where the monthly estimated settled ADR series cannot be formed at all (among the 50 sites under construction). These are cases where, after excluding months with fewer than 3 target properties, all 12 months are missing: Shimotsuke, Joyo, Otama, Nisshin, Shingu, Shintomi, Tsukubamirai, Moriya, Kasumigaura, Yashio, Hasuda and Kaizu. This is not a data defect — it is itself the finding, that the accommodation market in those municipalities is too thin to generate a stable price signal. It is especially notable that municipalities adjacent to major cities (Yashio, Hasuda, Moriya, Nisshin) appear on the list. Population is ample; it is the accommodation function alone that has been externalised to the neighbouring city.
Across the 38 municipalities where ADR could be obtained, levels range from ¥5,291 (Awa, Tokushima) to ¥24,633 (Miki, Hyogo). The middle of the range clusters in the ¥7,000-¥9,000 business-hotel band, consistent with the going rate for roadside accommodation demand nationally. The upper entries — Miki (3 target properties), Yamakita, Oyama, Otofuke and Kirishima — are all markets that include resort and hot-spring demand, and with few target properties their levels should be read with a wide margin.
Nodes Thin on Rooms Relative to the Weight of Demand — Normalising by Rooms per 10,000 Residents
Absolute room counts alone cannot separate sparsely inhabited mountain areas from suburbs that have population but no accommodation function. So the figures are normalised by the weight of demand. The metric used is rooms within 5km per 10,000 residents within 5km. Computed on the same basis (OTA-confirmed operating basis, 1,266,986 rooms), the national average works out to about 103 rooms per 10,000 residents, against a median of 34.9 rooms across the 50 sites under construction — roughly one third of the national figure.
Well served Top right: both population and rooms
Kemigawa-Masago (Mihama Ward, Chiba), Kofu-Chuo, Oya (Utsunomiya) and others. The accommodation cluster of the established built-up area falls inside the 10km radius. New entry here tends to mean head-on competition with incumbents.
Gap 1 Bottom right: population but no rooms
Joyo, Togo (Nisshin), Mibu PA, Hachihonmatsu, Sasazaka PA and others. Between 50,000 and 240,000 people live within 5km, yet rooms are close to zero. The accommodation function has been externalised to a neighbouring city.
Gap 2 Bottom left: thin on both population and rooms
Shintoku, Kake, Odaka, Awa-Ichiba and others. As a vessel for purely tourism or industrial demand, this territory is hard to make work unless the format is small and low-capex. Compressing the initial investment of a roadside format is the precondition.
The next table ranks the nodes with at least 50,000 residents within 5km by rooms per 10,000 residents, lowest first. Nodes where the weight of demand is verifiable but the accommodation function alone is thin are the easiest development opportunities to read.
| Smart IC (provisional name) | Location | Population 5km | Rooms 5km | Rooms 10km | Rooms per 10,000 residents | 2040 population change | Est. settled ADR |
|---|---|---|---|---|---|---|---|
| Sasazaka PA | Kasaoka, Okayama | 53,268 | 0 | 733 | 0.0 | -19.1% | ¥7,531 |
| Hachihonmatsu | Higashihiroshima, Hiroshima | 52,347 | 0 | 1,391 | 0.0 | +2.7% | ¥7,556 |
| Koyo | Hiroshima, Hiroshima | 221,726 | 4 | 13,623 | 0.2 | -8.8% | ¥6,834 |
| Togo | Nisshin, Aichi | 214,759 | 18 | 592 | 0.8 | +2.3% | — |
| Joyo | Joyo, Kyoto | 243,742 | 35 | 426 | 1.4 | -14.9% | — |
| Shin-Meishin Otsu | Otsu, Shiga | 87,260 | 59 | 2,615 | 6.8 | +3.0% | ¥12,484 |
| Yamakita | Yamakita, Kanagawa | 70,858 | 55 | 508 | 7.8 | -15.1% | ¥17,147 |
| Hasuda | Hasuda, Saitama | 299,085 | 375 | 2,621 | 12.5 | -5.5% | — |
| Kurume-Minami | Kurume, Fukuoka | 133,443 | 183 | 2,497 | 13.7 | -9.2% | ¥6,938 |
| Shingu | Shingu, Fukuoka | 113,359 | 164 | 1,397 | 14.5 | -1.2% | — |
| Gaikan-Yashio | Yashio, Saitama | 431,573 | 699 | 2,475 | 16.2 | +4.3% | — |
| Shimotsuke | Shimotsuke, Tochigi | 95,701 | 177 | 380 | 18.5 | -11.2% | — |
| Miki | Miki, Hyogo | 52,068 | 171 | 527 | 32.8 | -21.4% | ¥24,633 |
| Owari-Ichinomiya PA | Ichinomiya, Aichi | 282,129 | 971 | 2,144 | 34.4 | -7.6% | ¥6,222 |
Sasazaka PA (Kasaoka, Okayama) and Hachihonmatsu (Higashihiroshima, Hiroshima) at the head of the table, together with Mibu PA (Mibu, Tochigi) — whose 5km population of 49,648 falls just below this table’s 50,000 threshold — all have around 50,000 residents within 5km and zero rooms within that radius. Koyo (Asakita Ward, Hiroshima) has 4 rooms against a 5km population of 222,000; Togo (Nisshin, Aichi) has 18 against 215,000; Joyo (Joyo, Kyoto) has 35 against 244,000 — all extraordinarily thin for their population size. These are, however, on the fringes of large cities, and at a 10km radius the picture diverges sharply: 13,623 rooms at Koyo against 426 at Joyo. Note that in Koyo’s case the 10km radius simply captures the accommodation cluster of central Hiroshima; near the interchange itself the ground is empty. Joyo and Togo, by contrast, remain at 400-600 rooms even at 10km — thin both nearby and across the wider area.
The direction of future population is shown alongside. Of the 50 sites under construction, only 7 are projected to have a larger 5km population in 2040 than in 2025: Tsukubamirai (+10.7%), Moriya SA (+6.9%), Gaikan-Yashio (+4.3%), Shin-Meishin Otsu (+3.0%), Hachihonmatsu (+2.7%), Togo (+2.3%) and Tsuchiura (+0.7%). Thirteen, conversely, face declines of 20% or more. Accommodation is a 20-to-30-year asset, and while the trend in residential population sits on a different axis from corporate and construction demand, it cannot be ignored as a guide to an area’s staying power.
The map shows the residential population mesh around Joyo Smart IC (provisional name). Some 78,574 people live within a 3km radius (2025 estimate), and the continuity of the built-up area is visually apparent. Against a built-up area of that density, room stock within 10km stands at 426 and the largest property in the catchment at 109 rooms. It is not that nobody lives there; the natural reading is that accommodation demand is structured to flow toward Kyoto and Uji. If the Shin-Meishin opens along its full length and development around the Joyo junction proceeds, that flow could change.
The Supply Pipeline Has Barely Moved — 778 Rooms Since 2024 Across 52 Catchments
Next, the supply side. Across the 1,406 properties inside the 10km catchments of all 52 sites, opening dates confirmable from OTA listings show that new openings since 2024 amount to 778 rooms in total, spread over just 8 catchments (Kofu-Chuo 150 rooms, Kirishima 150, Hasuda 126, Oya 119, Oyama 90, Koyo 55, Tsuchiura 44 and Koda 44). In the remaining 44 catchments, not a single new room over the past two and a half years can be confirmed on OTA platforms. For a view of how much new supply is stacking up against existing stock area by area, see Hotel Supply Pressure Ranking 2026-2027.
⚠ How to read the new-opening data: Opening dates are on an OTA-listing-confirmed basis, and because listings appear only a few months before opening, the most recent and forthcoming periods are structurally undercounted. “778 rooms since 2024” is a lower bound on what is currently observable; the true figure may be higher. The same applies to the planning pipeline based on MLIT’s Building Construction Dynamics Statistics Survey: because building confirmation applications are normally filed one to two years before opening, the further into the future the year, the more it is understated. Treat both as observations that grow with the passage of time.
That supply is not moving does not prove that demand is absent. It reads rather as a state in which the supply side has not yet reacted to places whose transport conditions are about to change. A new interchange is one of the few exogenous events that alters the relative value of a site, and conditions for retail, logistics and accommodation shift discontinuously around the moment it opens. Because several years pass between project approval and opening, this window is also a period with time to spare for acquiring and planning a site. For how long construction actually takes from groundbreaking to completion, Hotel Build Times gives observed figures for 67 planned projects — a useful basis for working backwards from an opening date aligned to the interchange.
The Benefits MLIT Cites Concentrate on Industrial Parks, Logistics and Corporate Attraction
The most reliable guide to the nature of demand is the set of benefits MLIT itself publishes. In the press release of 5 December 2025, “Project Approval to Expressway Companies and Commencement of Preparatory-Stage Studies for Smart Interchanges,” four new project approvals (Otama, Owari-Ichinomiya PA, Koyo and Shingu) and one new preparatory-stage study (Sakamoto PA) were decided. The benefits MLIT cites for each are as follows.
| Site (provisional name) | Connection point | Benefits cited by MLIT (summary) | Rooms 10km |
|---|---|---|---|
| Otama | Tohoku Expressway Motomiya IC – Nihonmatsu IC | Promotion of corporate attraction, job creation and logistics efficiency accompanying development of the new industrial park at the “Otama Gateway” industrial cluster. Expansion of the regional development facility (farm shop) and improved access to Forest Park Adatara | 514 rooms |
| Owari-Ichinomiya PA | Meishin Expressway Komaki IC – Ichinomiya IC | Nearby businesses gain expressway access while bypassing a congestion point, improving logistics efficiency and productivity. Promotion of corporate siting at the Iwakura Kawaiinoyori industrial land (a large logistics facility was completed within the zone in May 2024) | 2,144 rooms |
| Koyo | Sanyo Expressway Hiroshima-Higashi IC – Hiroshima IC | Access from central Koyo to the nearest interchange cut from about 19 minutes to about 8. Strengthened centrality and settlement promotion for housing estates now 40 years past first sale. Improved wide-area disaster response through better links with the Hiroshima Prefectural Fire Academy | 13,623 rooms |
| Shingu | Kyushu Expressway Koga IC – Fukuoka IC | Attraction of logistics firms and food plants to the Miyoshiro land readjustment project (about 35.2ha). Improved project potential for the Tachibanaguchi district smart-interchange area development (a private-sector plan for large logistics and industrial park development, with land acquisition already begun) | 1,397 rooms |
| Sakamoto PA (preparatory-stage study) | Kyushu Expressway Yatsushiro IC – Hitoyoshi IC | Newly entered preparatory-stage study as of 5 December 2025 | 1,025 rooms |
At four of the five sites, the leading benefit cited is an industrial park, a logistics facility or corporate attraction. For Shingu the release states explicitly that attracted firms will “begin operating in step with the opening of Shingu Smart IC,” and for Otama a new industrial park is scheduled. This matters for accommodation operators. The start-up of an industrial park or logistics hub generates two stages of demand: construction-crew demand during the build (long stays of several months to several years), and business travel, maintenance and training demand once operations begin (short, repeated stays). The first turns on consecutive-night rates and kitchen and laundry facilities; the second on corporate contracts and breakfast service. Neither matches the location or the fittings implied by the existing structure of business hotels clustered in front of railway stations.
Koyo is different in character. The benefits cited there are convenience for residents, strengthened centrality and settlement promotion in ageing housing estates, and improved wide-area disaster response (the Hiroshima Prefectural Fire Academy serves as a staging ground for wide-area relief operations). As accommodation demand, this is less industrial than tied to disaster capacity and to exchange within the community. Even among smart interchanges, reading the benefits MLIT anticipates shows the quality of demand varies considerably.
Sizing the Gap Nodes — Two-Axis ADR x Occupancy Sensitivity and Three Scenarios (Reference Calculation)
This section is a reference calculation. The analysis in this article covers room stock and the weight of surrounding demand; it does not observe actual occupancy at any node. What follows fixes only the ADR axis to the going range of estimated settled ADR verified in this article, and places assumptions on occupancy, room count and opening timing. Read it as a framework for grasping orders of magnitude and swing, not as an earnings forecast for any specific site. Costs, investment amounts and yields are not addressed.
The previous sections identified nodes where demand has weight but rooms are thin. The next question is how large a project it would take to fill that gap. The estimated settled ADR obtained here clusters, across the 38 municipalities, in a middle band of ¥7,000-¥9,000 (full range ¥5,291-¥24,633). Placing that going range on the horizontal axis and annual occupancy on the vertical, annual room revenue per room moves as follows.
| Estimated settled ADR \ Annual occupancy (assumed) | 50% | 55% | 60% | 65% | 70% |
|---|---|---|---|---|---|
| ¥6,000 | 1,095 | 1,205 | 1,314 | 1,424 | 1,533 |
| ¥7,000 | 1,278 | 1,405 | 1,533 | 1,661 | 1,788 |
| ¥8,000 | 1,460 | 1,606 | 1,752 | 1,898 | 2,044 |
| ¥9,000 | 1,642 | 1,807 | 1,971 | 2,135 | 2,300 |
| ¥10,000 | 1,825 | 2,008 | 2,190 | 2,372 | 2,555 |
The centre cell (ADR ¥8,000 with annual occupancy set at 60%) gives about ¥1.75mn per room per year. A ¥1,000 move in ADR shifts it by roughly ¥220,000; a 5-point move in occupancy by roughly ¥150,000. In this price band, securing ¥1,000 of ADR does more work than 5 points of occupancy — which is precisely why, in a roadside format, the conditions that fill rooms without discounting (large-vehicle parking, fittings for consecutive nights, handling late-night arrivals) carry weight.
Next, the shape of the demand ramp, split into scenarios. In this analysis, 72% of nodes have a largest property within 10km of 250 rooms or fewer, so the realistic format at a gap node is small. Sixty rooms is used here as a worked example. What determines the swing is how closely the opening date aligns with the start-up of nearby industrial parks and land readjustment projects.
| Scenario | Est. settled ADR | Annual occupancy | RevPAR | Room revenue ¥ thousand / room / year | 60 rooms total ¥ million / year | Demand assumption |
|---|---|---|---|---|---|---|
| Pessimistic | ¥6,500 | 50% | ¥3,250 | 1,186 | 71.2 | The opening is delayed, or the start-up of nearby industrial parks and land readjustment slips past it. Early trading is limited to passing demand and marginal local corporate demand. |
| Central | ¥7,800 | 60% | ¥4,680 | 1,708 | 102.5 | The opening and the first phase of the industrial park broadly coincide. Long stays during construction get going, and repeat business travel after start-up provides the floor. |
| Optimistic | ¥9,000 | 68% | ¥6,120 | 2,234 | 134.0 | Demand from crews on surrounding works arises before the opening, and business travel and training demand from attracted firms overlaps after start-up. Consecutive-night stays dominate and day-of-week swing is small. |
The spread between optimistic and pessimistic is about ¥63mn a year on 60 rooms — reaching roughly +/-30% against the central case. Most of that width is set by when demand ramps, that is, by how closely the opening aligns with the start-up of the firms being attracted. What most deserves precision at the site-planning stage is therefore not the room count but the work of matching the opening year published by the project body against the start-up timing set out in the business plans for nearby land readjustment and industrial parks. The checklist in the next section sets out where to confirm each of these.
An Investment Checklist — Five Questions Room Count Alone Cannot Settle
This analysis answers only the question of how many rooms sit inside the catchment. Actual site decisions turn decisively on local conditions that public data cannot capture. To close, here are the items to confirm when considering accommodation development around a smart interchange. On the alternative of building on leased rather than owned land, Leasehold Hotel Development works backwards to supportable ground rent across nine markets.
| Item to confirm | Why it matters | Where and how to check |
|---|---|---|
| Distance from the exit and number of traffic lights | The choice of a roadside property is settled almost entirely by “how many minutes after leaving the expressway.” At the same distance, three sets of lights can nearly double perceived travel time. Whether a right turn is required to enter also bears directly on occupancy | Drive it. Because some smart interchanges are ETC-only with restricted entry and exit directions, confirm in the project approval documents whether access is full (4/4) or one-directional |
| Whether large vehicles can park | Capturing logistics and construction demand presupposes parking and turning space for large vehicles and van-class vehicles. Bay dimensions and the gradient at the entrance matter as much as the number of spaces | Site shape and the width of the abutting road. Also check how nearby existing properties handle large vehicles |
| Zoning and urbanisation control area status | Land around planned smart interchanges is often within an urbanisation control area, so whether hotel use can be built and whether development permission is required is the first fork in the road | The municipal urban planning department. Screen first with the zoning data in MLIT’s Real Estate Information Library, then confirm at the counter without fail |
| Scheduled opening year | Several years pass between project approval and opening, and whether the hotel opening can be aligned changes first-year occupancy. Construction-crew demand can peak before the interchange opens | MLIT’s tables do not give a scheduled opening year, so check case by case in material published by the project body (the municipality or the expressway company) |
| Nearby construction and logistics demand | Progress on the industrial parks and land readjustment projects cited as benefits largely determines the demand curve in the opening period. Grasping the start-up timing of attracted firms and the construction programme is essential | The municipal urban planning master plan, the business plan for the land readjustment project, and MLIT’s new-approval material (the annex on benefits) |
One obvious point is also worth confirming: thin room stock does not by itself guarantee that demand exists. Shintoku Smart IC (Shintoku, Hokkaido), with 11 rooms within 10km, has a 5km population of 2,541 projected to fall 28.9% by 2040 — the base of accommodation demand is itself small. A “gap” only means something where the weight of demand (population, employment, industrial siting) and an improvement in transport conditions can be confirmed at the same time. That is why Table B sets rooms per 10,000 residents alongside the raw counts.
Employment data from the Economic Census was also consulted for the surrounding area, but at 10 of the 50 sites under construction the relevant mesh is not covered and returned no value. This means “not recorded,” not “zero employment,” so employment data is not used here as evidence of demand.
How This Sits Against Our Earlier Work — A Different Demand Base From Stations, Airports and New Rail Lines
HotelBank has quantified the relationship between transport nodes and room stock from several angles. This article differs from that earlier work on three counts: subject, time horizon and demand base.
The transport mode is the car
Our earlier work measured room stock per passenger at 43 major railway stations, and investment headroom at airport-adjacent hotels across five airports. The demand base here is rental cars, private cars, freight haulage and construction crews, which calls for different fittings and a different route through the building.
These junctions have yet to open
Naniwasuji & Haneda Access Lines 2031 dealt with the time horizon of new railway lines. The 52 sites here are not junctions already in service but ones under construction or in preparatory-stage study — nodes before opening.
Not the same ground as low-capex formats
Our earlier reassessment of roadside-hotel schemes for idle land approached the question from the scheme side. This article cuts the population from the location side, identifying where the gaps are first.
Conclusion
Within a 10km radius of the 50 smart interchanges MLIT lists as under construction, there is a median of just 1,130 guest rooms. Twenty-two sites hold fewer than 1,000; six have not a single room within 5km. Business hotels built on the assumption of a station-front location account for 60.7% of the mix, and rooms laid out for guests arriving by car are not identifiable. New openings since 2024 come to 778 rooms across 8 sites out of all 52 catchments — the supply side has not begun to react.
At the same time, the benefits MLIT publishes for each site concentrate on industrial parks, logistics facilities and corporate attraction, so the demand that emerges will take a form existing stock is not good at serving: long stays during construction, then repeat business travel after start-up. Nodes such as Mibu PA, Sasazaka PA, Hachihonmatsu, Togo and Joyo — where roughly 50,000 to 240,000 people live within 5km yet rooms are close to zero — are the territory where the weight of demand and an improvement in transport conditions can be confirmed together. The time available for site planning is only the few years before these interchanges open.
Related Reading
- Naniwasuji & Haneda Access Lines 2031: Hotel Investment Timelines
- Obon Road Trips: Why Car Travelers Pick Expressway-IC Hotels
- Parking-Review Ranking Across Car-Dependent Japan + EV Charging Edge
- Hotel Supply Pressure Ranking 2026-2027: Ozu Kumamoto Tops at 30.8%
- Hotel Build Times: 2.80-Year Median, 1.96 Solo vs 4.00 Mixed-Use
- Leasehold Hotel Development: 1.38x Land Price Reach Across 9 Markets
- 226k Hotel Rooms in 32 Regional Cities: 42.7% Built Before 1996
References & Sources
■ Data sources
The subjects are the 50 sites under construction and 2 sites in preparatory-stage study — 52 in total, including the 2 full-access upgrades at Hasuda and Kake — published by the MLIT Road Bureau in “Development of Smart Interchanges” (as of 5 July 2026). Accommodation supply in each catchment was aggregated within 5km and 10km radii of the 52 nodes, with duplicates removed, from a population of 27,249 properties and 1,266,986 rooms whose operation can be confirmed on OTA platforms (1,406 properties and 88,622 rooms fell inside the catchments). Estimated settled ADR is the 12-month average from August 2025 to July 2026 at municipality level; residential population is the sum within the radius of future population projections by 250m mesh (National Institute of Population and Social Security Research 2024 projection).
■ Calculation assumptions
Positions were estimated from the municipalities and district names in published material (actual SA/PA positions for 5 sites; nearest point on the expressway from the district centre for 29; from the municipal centre for 18). No site was excluded for want of a position. For estimated settled ADR, months with fewer than 3 target properties were excluded, and the 12 municipalities missing all 12 months are not shown. Tables E and F under “Sizing the gap nodes” are reference calculations: only the ADR axis is fixed to the going range verified in this article (middle band ¥7,000-¥9,000), while annual occupancy, the 60-room count and the timing of the demand ramp are assumptions. Room revenue is the arithmetic of ADR x occupancy x 365 days alone; ancillary revenue, costs, investment amounts and yields are not addressed.
■ Limitations and caveats
(1) Among the position estimates, the 18 sites derived from municipal centres can carry errors of several kilometres, so figures within a 5km radius are sensitive to that error (the reason this article treats the 10km radius as its primary metric). (2) New openings are on an OTA-listing-confirmed basis, so recent periods are structurally undercounted and the figure is a lower bound. (3) Employment data based on the Economic Census is not used as evidence of demand because the mesh is not covered at 10 of the 52 sites (“not recorded” is not “zero”). (4) Residential population excludes daytime, staying and passing population. (5) This article does not observe actual occupancy at any node; every statement about occupancy is an assumption. (6) Estimated settled ADR is an estimate and differs from each property’s actual transacted prices or accounting figures.
■ Market data
- MetroEngines Research & Consulting — property and room master on an OTA-confirmed operating basis (27,249 properties, 1,266,986 rooms), estimated settled ADR, and aggregation within 5km and 10km radii of the 52 sites (1,406 properties and 88,622 rooms inside the catchments)
■ Government statistics and public data
- MLIT Road Bureau, “Development of Smart Interchanges” (as of 5 July 2026: 166 open to traffic / 50 under construction / 2 in preparatory-stage study, with PDF summary tables for sites under construction and sites in preparatory-stage study)
- MLIT, “Project Approval to Expressway Companies and Commencement of Preparatory-Stage Studies for Smart Interchanges” (5 December 2025, Expressway Division, Road Bureau)
- MLIT, “Project Approval to Expressway Companies and Commencement of Preparatory-Stage Studies for Smart Interchanges” (6 September 2024)
- MLIT National Land Numerical Information, “Future Population Projections by 250m Mesh (National Institute of Population and Social Security Research 2024 projection)” — residential population within 1.5km, 3km and 5km radii and 2040 projections
- Ministry of Internal Affairs and Communications and Ministry of Economy, Trade and Industry, “Economic Census for Business Activity (2021)” / boundaries from the 2020 Population Census small-area data (e-Stat Statistical GIS) — establishments and employees within a 1km radius
- Statistics Bureau of Japan, “Population Estimates” (provisional figures as of 1 October 2025: total population 123.21 million)
■ Map and geographic data
- Geospatial Information Authority of Japan place-name search API (coordinates for municipalities and districts)
- Open road-alignment data (ODbL licence; credit displayed on the map) — used to estimate smart interchange positions
- Map tiles (credit displayed on the map)