

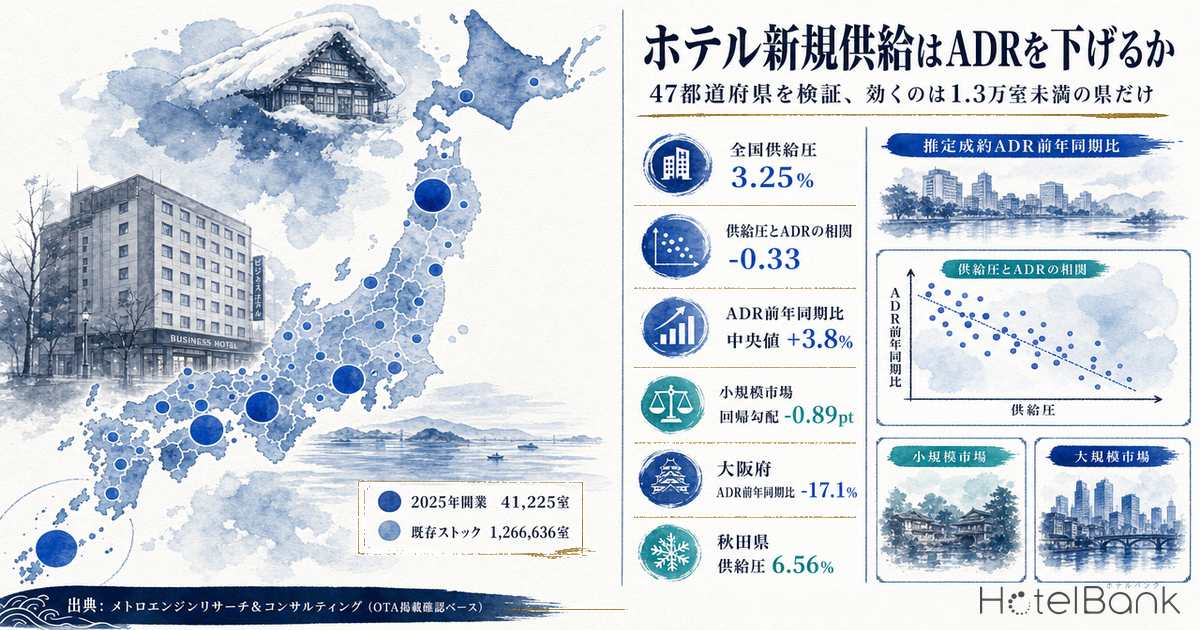
“Areas that add new supply see room rates fall” is one of the most widely shared assumptions in Japanese hotel investment. Yet almost no published analysis has put all 47 prefectures on the same two axes to check whether that assumption holds with equal force everywhere. This article pairs, for every prefecture, a “supply pressure” ratio — the 1,731 properties and 41,225 rooms that opened in calendar 2025 divided by each prefecture’s existing room stock — against the year-on-year change in estimated settled ADR for January-June 2026, and separates the conditions under which supply does and does not push rates down.
Metric Definitions Used in This Article
- ADR (average daily rate): an estimated settled rate (tax-excluded equivalent), derived by applying a category-specific adjustment factor to the lowest publicly listed plan level each property shows on OTAs (double occupancy, per-room rate, tax-included). Cross-checked against property-level results disclosed by listed hotel REITs, the median error is approximately 7%. These are estimates and differ from each property’s actual transacted prices or accounting figures. Area-level ADR is the median across the covered properties (the level of a typical property in that area).
- OCC (occupancy): the share of sold rooms against total rooms in the area (an estimate based on OTA sales inventory; consistency checks against REIT monthly disclosures confirm accuracy of roughly a few percentage points).
- Supply pressure: the total rooms of properties confirmed to have opened in the prefecture during calendar 2025, divided by the total rooms in that prefecture for which active operation can be confirmed.
- Data source: MetroEngines Research & Consulting (based on confirmed OTA listings)
- — National supply pressure is 3.25% (41,225 rooms opened in 2025 ÷ 1,266,636 rooms of existing stock). By prefecture the range runs from 0.59% to 6.56% — an 11.1x spread.
- — The correlation between supply pressure and ADR YoY is r=-0.328, R-squared 0.108. The sign is negative, but supply pressure explains only about one tenth of the variance in ADR growth.
- — Split into tertiles by existing stock, the sign flips. Small markets r=-0.439 / mid-sized r=-0.044 / large r=+0.294: the assumption holds only in prefectures with fewer than 13,000 total rooms.
- — Supply is not being absorbed through occupancy. The correlation between supply pressure and estimated June 2026 OCC is r=-0.003, effectively zero. Only 5 of 47 prefectures posted an ADR decline.
- — Screening on supply pressure improves the yield by just 0.46pt (5.07% → 5.53%), roughly half the 0.87pt impact of construction-cost inflation. Few markets justify making supply-pipeline scrutiny the top decision criterion.
National supply pressure is 3.25% — an 11x spread from 0.59% to 6.56% across 47 prefectures
Start by aligning the numerator and the denominator. Within the scope where MetroEngines Research & Consulting confirmed OTA listings, 1,731 lodging properties with 41,225 rooms opened nationwide in calendar 2025. Over the same scope, the existing stock with confirmed OTA activity totals 27,248 properties and 1,266,636 rooms. Their ratio — national supply pressure — is 3.25%.
That 3.25% is low by international standards. JLL put Japan’s new supply at roughly 1.5% of existing stock as of the end of April 2025, far below the Asia-Pacific average of 6.6% (the levels are not directly comparable because the sample and reference date differ). It is consistent with the same firm’s view that soaring construction costs are holding back new supply.
National averages, however, explain almost nothing about individual prefectures. Supply pressure is highest in Akita at 6.56% and lowest in Tokushima at 0.59% — an 11.1x gap. The 15 prefectures with the highest supply pressure are shown below.
| Prefecture | Properties opened 2025 | Rooms | Existing stock (rooms) | Supply pressure | ADR Jan-Jun 2025 | ADR Jan-Jun 2026 | YoY | OCC Jun 2026 | Market size |
|---|---|---|---|---|---|---|---|---|---|
| Akita | 11 | 711 | 10,839 | 6.56% | ¥7,538 | ¥7,666 | +1.7% | 88.9% | Small |
| Kagawa | 45 | 710 | 10,870 | 6.53% | ¥7,540 | ¥7,978 | +5.8% | 81.8% | Small |
| Osaka | 55 | 5,502 | 93,041 | 5.91% | ¥11,300 | ¥9,370 | -17.1% | 83.9% | Large |
| Tottori | 7 | 447 | 7,893 | 5.66% | ¥8,394 | ¥8,256 | -1.6% | 84.5% | Small |
| Ibaraki | 18 | 884 | 16,041 | 5.51% | ¥6,647 | ¥7,032 | +5.8% | 86.2% | Mid-sized |
| Toyama | 8 | 615 | 11,884 | 5.18% | ¥7,294 | ¥7,389 | +1.3% | 78.7% | Small |
| Saga | 12 | 347 | 6,926 | 5.01% | ¥12,830 | ¥11,927 | -7.0% | 83.3% | Small |
| Okinawa | 127 | 2,074 | 42,577 | 4.87% | ¥9,932 | ¥11,714 | +17.9% | 87.3% | Large |
| Kagoshima | 52 | 925 | 20,514 | 4.51% | ¥6,594 | ¥6,839 | +3.7% | 74.8% | Mid-sized |
| Kumamoto | 37 | 823 | 18,377 | 4.48% | ¥10,420 | ¥10,380 | -0.4% | 82.2% | Mid-sized |
| Yamaguchi | 17 | 570 | 12,764 | 4.47% | ¥7,201 | ¥7,436 | +3.3% | 85.5% | Small |
| Gunma | 33 | 903 | 20,514 | 4.40% | ¥11,519 | ¥11,851 | +2.9% | 80.6% | Mid-sized |
| Fukui | 20 | 391 | 9,096 | 4.30% | ¥11,227 | ¥11,401 | +1.5% | 85.0% | Small |
| Okayama | 18 | 641 | 14,951 | 4.29% | ¥8,058 | ¥8,162 | +1.3% | 84.5% | Mid-sized |
| Gifu | 33 | 736 | 17,408 | 4.23% | ¥10,442 | ¥10,812 | +3.5% | 82.2% | Mid-sized |
One caveat on the opening data: it is based on confirmed OTA listings. Because listings typically appear several months before opening, the most recent months may grow as further listings appear. Calendar 2025 is far enough in the past, from this study’s vantage point of August 2026, for observations to have accumulated — which is why this article fixes 2025 as the supply-shock year and measures the response in first-half 2026 ADR.
The full scatter of supply pressure against ADR change — r=-0.33, explaining about one tenth
The chart below places all 47 prefectures on a horizontal axis of supply pressure (%) and a vertical axis of estimated settled ADR YoY (%). Bubble size is existing stock rooms; color marks the market-size tertile.
The regression is y = -1.030x + 7.22, with a correlation coefficient of r=-0.328 and an R-squared of 0.108. The sign is indeed negative, so the direction — ADR growth slows as supply increases — is not refuted. But an R-squared of 0.108 means supply pressure accounts for only about one tenth of the variance in prefecture-level ADR growth. The other nine tenths are driven by something else.
The correlation also leans heavily on a single point. Excluding Osaka (supply pressure 5.91%, ADR YoY -17.1%) drops the correlation to r=-0.227 and R-squared to 0.052. As discussed below, Osaka’s decline is driven mainly by a base effect from a demand event in the first half of 2025 rather than by supply, which makes it an awkward observation to treat as evidence on supply pressure.
Cut supply pressure into quartiles and ADR growth decays monotonically
Correlation coefficients are fragile against outliers. So the 47 prefectures were sorted by supply pressure into quartiles and the median ADR YoY compared across groups. Because these are order statistics, they are less sensitive to extreme values such as Osaka.
| Supply-pressure quartile | Supply-pressure range | Prefectures | Median ADR YoY | Mean | Prefectures below LY | Median OCC Jun 2026 |
|---|---|---|---|---|---|---|
| Q1 (12 lowest-supply prefectures) | 0.59-1.87% | 12 | +5.3% | +5.4% | 0 | 85.0% |
| Q2 | 2.01-3.44% | 12 | +4.3% | +4.4% | 1 | 83.8% |
| Q3 | 3.55-4.40% | 12 | +3.5% | +4.0% | 0 | 84.5% |
| Q4 (11 highest-supply prefectures) | 4.47-6.56% | 11 | +1.7% | +1.2% | 4 | 83.9% |
The medians decay monotonically — +5.3% (Q1) → +4.3% (Q2) → +3.5% (Q3) → +1.7% (Q4) — leaving a 3.6pt gap between the lowest and highest supply-pressure groups. Four of the five prefectures that fell below last year (Osaka, Tottori, Saga, Kumamoto) sit in Q4, and the fifth (Tochigi) sits at the top of Q2’s range. Even excluding Osaka, Q4’s median is +2.5%, still 2.8pt below Q1.
In other words, supply pressure does not erase ADR growth, but it reliably shaves off part of it. In a phase where ADR is rising nationwide, rates above last year are the norm even in high-supply areas, and outright declines are confined to cases where supply pressure coincides with some other factor. That is the reading most faithful to the measurements. On the same first-half 2026 ADR YoY, incidentally, the way signs line up varies widely by prefecture once results are split by hotel category; that distribution is analyzed in ADR YoY across 47 prefectures and 4 hotel categories.
Where the sign flips — supply depresses rates only in markets under 13,000 rooms
This is the core of the analysis. The 47 prefectures were divided into tertiles by existing stock rooms, and the relationship between supply pressure and ADR change was re-measured within each group.
| Market size | Existing stock | Prefectures | Correlation | Regression slope (per +1pt supply pressure) | Median ADR YoY | Median OCC Jun 2026 |
|---|---|---|---|---|---|---|
| Small markets | 6,406-13,223 rooms | 15 | -0.439 | -0.89pt | +3.3% | 83.6% |
| Mid-sized markets | 13,906-20,514 rooms | 16 | -0.044 | -0.09pt | +3.2% | 82.2% |
| Large markets | 24,673-160,289 rooms | 15 | +0.294 | +0.95pt | +5.9% | 87.2% |
In small markets (existing stock 6,406-13,223 rooms, 15 prefectures) the correlation is r=-0.439 and the regression slope -0.89pt. An area with 1pt more supply pressure shows ADR YoY 0.9pt lower. In this size band, the assumption that added supply depresses rates is clearly visible in the numbers.
In mid-sized markets (13,906-20,514 rooms, 16 prefectures), however, the relationship all but vanishes: r=-0.044, slope -0.09pt. And in large markets (24,673-160,289 rooms, 15 prefectures excluding Osaka) the sign flips to r=+0.294 and a slope of +0.95pt — the higher the supply pressure, the stronger the ADR growth. Large markets also post a median ADR YoY of +5.9%, 2.6pt above the +3.3% of small markets.
It is important not to misread the direction of causation behind this sign flip. Supply and ADR rising together in large markets is better explained by operators investing ahead of anticipated demand growth than by supply pushing rates up. Okinawa (supply pressure 4.87%, ADR +17.9%), Fukuoka (2.76%, +12.0%) and Hokkaido (3.89%, +8.6%) all fit this pattern. Put differently, in large markets high supply pressure works as a signal of demand strength, and using it as an avoidance criterion means passing over growth markets.
Without excluding Osaka, the large-market correlation falls to r=-0.349. It must be stated plainly that this is a fragile relationship — a single observation changes its sign. Even so, the gap between small markets at r=-0.439 and mid-sized markets at r=-0.044 does not depend on whether Osaka is included. At minimum, the ordering — the smaller the market, the stronger the negative effect of supply pressure — survives any outlier treatment.
Supply is not absorbed through occupancy — the correlation with OCC is zero
When supply increases, does the market absorb it by giving up occupancy or by giving up rate? The distinction matters for investment decisions: absorption through occupancy leaves a mild impact on RevPAR, while absorption through rate hits it directly.
The correlation between estimated June 2026 OCC and supply pressure is r=-0.003 — effectively zero. Akita and Kagawa, both above 6% supply pressure, show OCC of 88.9% and 81.8% (as of June 2026), while Tokushima, Niigata and Nagano, all below 1%, show 83.7%, 87.3% and 85.5%. High and low occupancy appear on both sides. Median OCC by quartile is similarly flat at 85.0%, 83.8%, 84.5% and 83.9% (June 2026, N=47 prefectures).
ADR YoY and OCC, meanwhile, correlate weakly but positively at r=+0.287: prefectures with rising rates also tend to run higher occupancy, as one would expect. Taken together, added new supply leaves almost no trace on OTA inventory absorption, and whatever effect appears shows up on the rate side. The earlier finding that supply pressure shaves rates in small markets is the mirror image of this — price, not occupancy, is the adjustment valve.
The geography of supply pressure — concentrated in small and mid-sized markets on the Sea of Japan coast and in Kyushu
The map plots supply pressure and ADR change for all 47 prefectures. Circle size represents supply pressure; color shows the direction of ADR YoY.
The high-supply-pressure group is populated by small and mid-sized markets with 16,000 rooms or fewer of existing stock — Akita, Kagawa, Tottori, Ibaraki, Toyama and Saga. In these prefectures, even a few hundred rooms opening in 2025 pushes supply pressure above 5% because the denominator is small. Tokyo, by contrast, saw 114 properties and 5,092 rooms open in 2025 yet registers supply pressure of only 3.18% against a denominator of 160,000 rooms. The same “5,000 rooms of supply” lands on the market with an impact that differs by an order of magnitude depending on the denominator. How Tokyo’s openings break down by hotel category is covered in detail in our breakdown of Tokyo’s 2026 openings by category.
This distribution carries a practical implication for investment decisions. Development in regional small and mid-sized markets moves overall supply-demand balance even when the absolute room count is small, making price competition with incumbents more likely. In major metropolitan areas, supply of the same scale barely registers.
Osaka’s -17.1% is not a consequence of supply — it is a demand-event base effect
Osaka combines supply pressure of 5.91% (12.93% when 2024 is added in, among the highest nationwide) with ADR YoY of -17.1%, the only double-digit decline among the 47 prefectures. On the scatter plot it sits 18.2pt below the regression line — an extreme observation.
Reading that decline as a consequence of supply would be a mistake. The comparison period, January-June 2025, overlapped with a major international event in Osaka, and estimated settled ADR stood at ¥11,300, the 11th highest level nationwide. The ¥9,400 of January-June 2026 is better interpreted as a return toward the pre-event norm. OCC has held at 83.9%, around the national average, so demand itself has not collapsed.
In practical investment analysis, separating this kind of event base effect from structural oversupply is essential. Occupancy is the clue. Where oversupply is depressing rates, occupancy usually loosens too, or at minimum the rate decline persists across multiple years. When ADR alone falls sharply in a single year while occupancy holds, a base effect should be the first suspicion.
Reconciliation with listed hotel REIT monthly results — metro-weighted portfolios are below last year
The estimates in this article are cross-checked against monthly operating results published by listed hotel REITs. The figures each disclosed for June 2026 are as follows.
| Investment corporation | Disclosure scope | OCC | ADR | RevPAR | ADR YoY | OCC YoY |
|---|---|---|---|---|---|---|
| Invincible Investment Corporation | 103 domestic hotels | 82.2% | ¥12,306 | ¥10,118 | -5.0% | -0.9pt |
| Japan Hotel REIT Investment Corporation | 29 hotels with variable rent structures | 81.2% | ¥18,509 | ¥15,023 | +1.6% | +0.1pt |
| Hoshino Resorts REIT | Entire portfolio | 74.2% | ¥18,478 | ¥13,716 | -4.0% | -2.0pt |
| Ichigo Hotel REIT Investment Corporation | Entire portfolio | 80.6% | ¥8,872 | ¥7,147 | -5.9% | -3.3pt |
Three of the four posted negative ADR YoY, the opposite direction from the +3.8% median across the 47 prefectures shown here. Portfolio composition explains the gap. Listed hotel REIT holdings are concentrated in major metropolitan areas, which exposes them strongly to the Osaka base effect. The aggregation windows also differ: this article averages six months of January-June 2026, while the REIT disclosures are a single month, June 2026.
In practice, REIT monthly results are the most reliable primary source as portfolio-weighted actuals, while the prefecture-level estimates here serve as complementary data for capturing the national distribution as a surface. The two are not contradictory; they cover different populations.
The floor of the confirmed pipeline — 3,216 rooms from 2027 on a building-permit basis
To look forward, planned and under-construction hotel projects were checked against MLIT’s “Building Construction Statistics Survey.” The 68 projects and 15,115 rooms visible as of the survey date break down by expected completion year into 5,304 rooms in 2025, 4,967 in 2026, 3,216 in 2027, 1,428 in 2028 and 200 from 2029 onward. By prefecture, Tokyo leads with 18 projects and 3,646 rooms, followed by Chiba with 5 projects and 2,164 rooms and Hokkaido with 8 projects and 1,740 rooms.
An essential caveat applies here. Building permit applications are normally filed one to two years before opening, so counts for future years are structurally undercounted. The thinning figures from 2028 onward do not mean the pipeline is drying up; they mean plans not yet filed will be added later. This data reflects permit applications as of the survey date, project and room counts are expected to rise as further applications come in, and it should therefore be read as the floor of the currently confirmed pipeline.
Something can still be read from it. The confirmed portion of the pipeline is skewed toward large markets — Tokyo, Chiba, Hokkaido, Kanagawa and Osaka. In light of this analysis, those are the size bands where no negative relationship between supply pressure and ADR is observed, so pipeline concentration there does not automatically imply rate declines. More noteworthy from an investment-opportunity standpoint is that the permit-based pipeline is thin in exactly the small markets where the negative effect of supply pressure does show up. How far construction-cost inflation and labor shortages are cutting into 2027-2029 supply plans is organized region by region in Construction +41% and the labor crunch erasing Japan’s 2027-2029 hotel supply.
Testing the assumption — screening on supply pressure moves yield less than construction-cost inflation does
Translating the analysis into the language of investment yield: choosing low-supply-pressure areas buys an ADR growth differential of, on a quartile basis, Q1’s median +5.3% against Q4’s median +1.7% — 3.6pt per year. What that does to yield is modeled below for a hypothetical 100-room, accommodation-focused new development.
■ Model assumptions
100 rooms; 28 sqm (8.47 tsubo) of gross floor area per room; first-year ADR ¥12,000 (estimated settled, tax-excluded equivalent); OCC 85% (full-year average, an assumed input); GOP margin 35%. Construction cost applies the 2025 national steel-frame unit cost of ¥2.405mn per tsubo from MLIT’s Building Construction Statistics Survey, giving ¥20.37mn per room. Land, FF&E and soft costs are added at 35% of construction cost, for a total investment of ¥2.75bn. The 35% GOP margin is set conservatively against the 38.9% actual (FY December 2024) disclosed by Invincible Investment Corporation for its 91 MHM-operated properties, allowing for the ramp-up period of a new opening. The “high-supply small market, ADR +2.3% per year” scenario is the level obtained by substituting supply pressure of 4.47% (the lower bound of supply-pressure quartile Q4) into the small-market regression (slope -0.89pt). This is a simplified model; actual investment decisions require a detailed feasibility study.
| Scenario | Construction cost per room | Total investment | ADR in year 3 | GOP in year 3 | Yield on total investment |
|---|---|---|---|---|---|
| [2025 cost basis] High-supply small market (ADR +2.3%/yr) | ¥20.37mn | ¥2.75bn | ¥12,847 | ¥139.5mn | 5.07% |
| [2025 cost basis] National median (ADR +3.8%/yr) | ¥20.37mn | ¥2.75bn | ¥13,421 | ¥145.7mn | 5.30% |
| [2025 cost basis] Low-supply market (ADR +5.3%/yr) | ¥20.37mn | ¥2.75bn | ¥14,011 | ¥152.1mn | 5.53% |
| [Post-inflation] High-supply small market (ADR +2.3%/yr) | ¥24.60mn | ¥3.32bn | ¥12,847 | ¥139.5mn | 4.20% |
| [Post-inflation] National median (ADR +3.8%/yr) | ¥24.60mn | ¥3.32bn | ¥13,421 | ¥145.7mn | 4.39% |
| [Post-inflation] Low-supply market (ADR +5.3%/yr) | ¥24.60mn | ¥3.32bn | ¥14,011 | ¥152.1mn | 4.58% |
The result is unambiguous. Holding the construction-cost assumption constant, choosing a low-supply-pressure area improves the yield by just 0.46pt (5.07% → 5.53%). Pricing in construction-cost inflation, by contrast, cuts the yield by 0.87pt (5.07% → 4.20%, and even in the low-supply scenario 5.53% → 4.58%). The difference made by construction timing is therefore about twice the difference made by area screening on supply pressure.
That result reopens the question of how highly the “avoid areas adding supply” assumption should rank. Area screening is not meaningless. But its effect size is small next to managing construction-cost timing, and, as shown here, the negative effect is actually observed only in small markets with under 13,000 rooms of existing stock. Applying the assumption mechanically in large markets offers no screening benefit and can backfire by steering capital away from markets where demand is growing.
Implications for investment decisions — three conditional branches
Condition A In small markets the assumption holds
Existing stock under 13,000 rooms, 15 prefectures
Correlation r=-0.439, regression slope -0.89pt. An area with 1pt more supply pressure shows ADR growth 0.9pt lower. In this size band, money spent scrutinizing the supply pipeline pays for itself. When evaluating development here, always compute your own project’s ratio against existing stock.
Condition B In mid-sized markets the relationship disappears
Existing stock 14,000-21,000 rooms, 16 prefectures
Correlation r=-0.044, regression slope -0.09pt. Supply pressure explains almost none of the variation in ADR. In this size band it is more rational to anchor decisions on demand-side indicators — inbound share, event attraction, transport access improvements — than on supply pressure.
Condition C In large markets the sign flips
Existing stock 24,000+ rooms, 15 prefectures (excluding Osaka)
Correlation r=+0.294, median ADR YoY +5.9%. Supply pressure works as a signal of demand strength; using it as an avoidance criterion means passing over growth markets. That said, the relationship is fragile enough for a single observation to flip its sign, so demand-side corroboration is a prerequisite.
Risk factors and the limits of this analysis
| Factor | Description | Treatment in this article |
|---|---|---|
| Observation lead time | OTA listings appear several months before opening, so recent months undercount openings | The supply-shock year is fixed at calendar 2025 and only periods with accumulated observations are used |
| Additional permit filings | Future years on a Building Construction Statistics Survey basis will grow with later filings | Presented as the floor of the confirmed pipeline and not used to assert future supply |
| Demand-event base effect | Markets that hosted a large event the prior year show ADR below last year regardless of supply | Osaka is separated out of the correlation and the base effect is identified via occupancy |
| Single-cycle observation | This article observes only one cycle: 2025 supply into first-half 2026 ADR | Re-verification across multiple years is required; the sign of the correlation may change by year |
| ADR estimation error | Estimated settled ADR has a median error of about 7% against disclosed results | Comparisons use the YoY difference rather than absolute levels, offsetting the systematic component of the error |
| Construction cost volatility | If realized construction-cost inflation exceeds the forecast, yields fall further | Modeled in two stages (2025 actual cost / inflation priced in) to make sensitivity explicit |
In addition, the denominator of supply pressure — existing stock with confirmed activity — is limited to properties whose OTA listings could be confirmed. Ryokan, minshuku and simple lodging houses not listed on OTAs are excluded, so supply pressure may be overstated in markets where those account for a large share. This analysis is a full count within the scope MetroEngines Research & Consulting covers, not a census.
Summary
Placing all 47 prefectures on the same two axes confirms that the assumption “more new supply means lower room rates” holds only conditionally. The overall correlation is r=-0.328 with an R-squared of 0.108, so supply pressure explains only about one tenth of the variance in ADR change. By quartile, ADR growth decays monotonically as supply pressure rises, yet only 5 of 47 prefectures actually fell below last year.
The decisive condition is market size. Small markets with under 13,000 rooms of existing stock show a clear negative relationship at r=-0.439, mid-sized markets of 14,000-21,000 rooms show none, and large markets of 24,000 rooms or more flip the sign. Supply leaves almost no trace on occupancy; where it registers, it registers on rate.
Translated into yield, the gap produced by area screening on supply pressure is 0.46pt of year-3 yield on total investment — about half the 0.87pt gap produced by differences in construction start timing. Scrutinizing the supply pipeline remains necessary work, but on the measurements, the markets where it deserves to be the top decision criterion are limited.
Related reading
- 1,002 New Japan Openings H1 2026: ADR 1.14x, Ryokan Lag +18.8pt
- Japan’s Second Cities: 21 Prefectures Where the Capital Isn’t #1
- Okinawa 2026: 2,842 New Rooms, 0.6% Business vs 22.1% City Inventory
- Shizuoka’s 67 New 2026 Hotels: 1,089 Rooms, 64% One-Room Villas
- Hiroshima 2026: 1,003 New Rooms, City Settled ADR Turns -4.1% in July
- Tokyo 2026: 2,055 New Rooms, 55.6% Business Hotels, ADR Turns Negative
- Construction +41% & Labor Crunch Erase Japan’s 2027-2029 Hotel Supply
- H1 2026 ADR YoY: 16 Prefectures Aligned, 31 Split Across 4 Categories
- June 2026 Occupancy 56.2%: Guest-Nights per Room in 47 Prefectures
References and sources
■ Data sources
The numerator of supply pressure is the 1,731 properties and 41,225 rooms that opened in calendar 2025 within the scope of confirmed OTA listings. The denominator is the 27,248 properties and 1,266,636 rooms with confirmed OTA activity in the same scope. ADR is the monthly median estimated settled ADR for each of the 47 prefectures, averaged over six months for January-June 2025 and January-June 2026, with the ratio taken as the YoY change (122-1,135 properties per prefecture in the ADR calculation). OCC is the estimated occupancy for June 2026 (OTA sales inventory basis). Construction cost is the 2025 national steel-frame cost per tsubo from MLIT’s “Building Construction Statistics Survey.” REIT results are the June 2026 monthly operating results as disclosed by each investment corporation.
■ Model assumptions
Supply pressure = rooms opened in the prefecture in 2025 ÷ total rooms with confirmed activity in that prefecture. Correlation coefficients and regression slopes come from a simple regression treating each of the 47 prefectures as one observation (the market-size analysis uses 46 prefectures, excluding Osaka). Market-size tertiles are split on existing stock rooms, with boundaries of 6,406-13,223 rooms (small), 13,906-20,514 (mid-sized) and 24,673-160,289 (large). The yield model assumes 100 rooms, accommodation-focused, 28 sqm of gross floor area per room, first-year ADR ¥12,000 (estimated settled, tax-excluded equivalent), OCC 85% (full-year average, an assumed input), a 35% GOP margin, and land, FF&E and soft costs added at 35% of construction cost. See “Model assumptions” in the body for details.
■ Limitations and caveats
This article observes only one cycle — 2025 supply into first-half 2026 ADR — and the sign of the correlation may change by year. Because estimated settled ADR carries a median error of about 7% against listed hotel REIT disclosures, comparisons use the YoY difference rather than absolute levels, offsetting the systematic component of the error. Opening data is based on confirmed OTA listings, so the most recent months are undercounted. The denominator of existing stock is likewise limited to OTA-listed properties, so supply pressure may be overstated in markets with a high share of ryokan, minshuku and simple lodging houses not listed on OTAs. Osaka’s decline below last year is a demand-event base effect, not a consequence of supply. This is a full count within the covered scope rather than a census, and investment decisions require an individual feasibility study.
■ Market data
- MetroEngines Research & Consulting — opening data based on confirmed OTA listings (1,731 properties / 41,225 rooms in 2025), stock with confirmed activity (27,248 properties / 1,266,636 rooms), monthly estimated settled ADR by prefecture (July 2024 – August 2026), and estimated occupancy (June 2026)
■ Government statistics and public data
- MLIT “Building Construction Statistics Survey” (construction starts statistics, construction cost per tsubo, and planned hotel projects)
- e-Stat, Statistical Survey on Building Construction Starts
■ REIT and industry reports
- Invincible Investment Corporation, “Monthly Operating Status for June 2026”
- Japan Hotel REIT Investment Corporation, monthly operating results
- Hoshino Resorts REIT, IR library
- Ichigo Hotel REIT Investment Corporation, “Monthly Operating Status for June 2026”
- Invincible Investment Corporation, portfolio (GOP results for MHM-operated properties)
- JLL, “Japan Hotel Investment Market 2025”
■ News and commentary
- Latest trends in Japan’s hotel market: relatively inexpensive in global terms, with new supply limited by soaring construction costs (Travel Voice, December 8, 2025)
- JLL forecasts an expanding global hotel investment market in 2026 (PR TIMES)
- archi-book, 2025 edition, construction cost per tsubo by structure type