

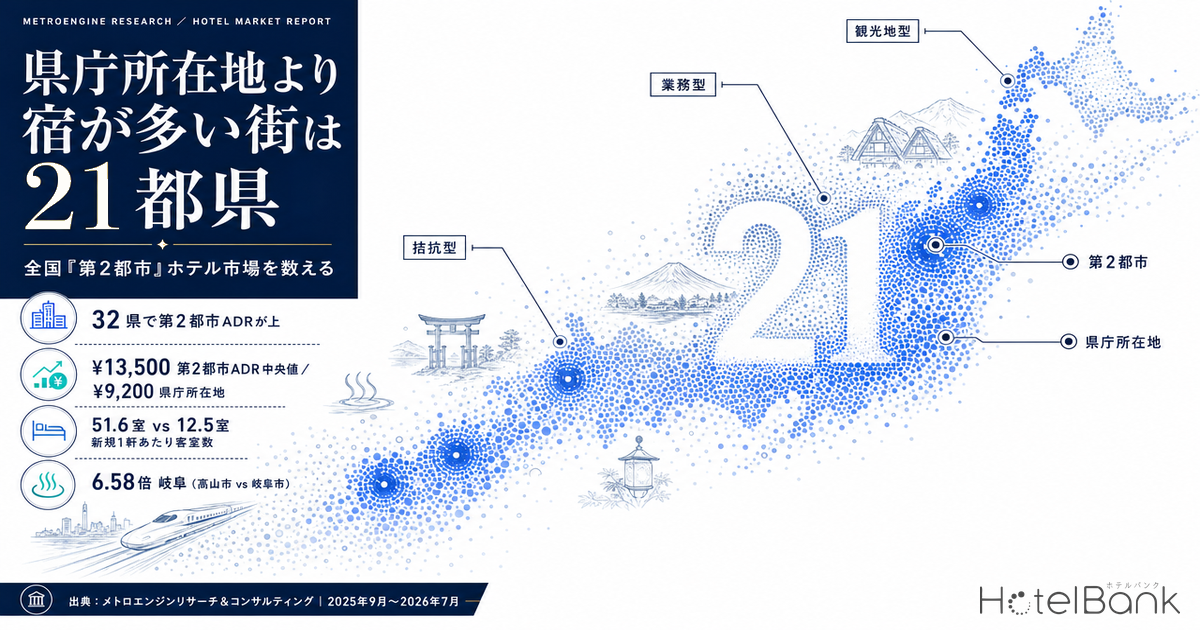
“The prefectural capital is the city with the most hotels in its prefecture” — in Japan’s accommodation market, that holds true only about half the time. When MetroEngines Research & Consulting tallied accommodation property counts municipality by municipality across all 47 prefectures, the capital city ranked first in property count in only 26 prefectures; in the remaining 21, a different city led. This article ranks Japan’s municipalities mechanically and compares, side by side, the property counts, room rates and new supply of prefectural capitals against the rival accommodation cluster we call the “second city.”
Metric Definitions Used in This Article
- ADR (average daily rate): An estimated settled rate (tax-exclusive equivalent) calculated by applying category-specific adjustment coefficients to each property’s lowest published plan level on OTAs (double occupancy, per-room rate, tax-inclusive). Cross-checked against property-level results disclosed by listed hotel REITs, the median error is approximately 7%. These are estimates and differ from each property’s actual transacted prices and accounting figures. Area-level ADR is the median across the target properties (the level of a typical property in that area).
- Property count: The monthly median, over the 11 confirmed months from September 2025 to July 2026, of the number of properties with sellable inventory observable on OTAs in each municipality.
- Second city: In prefectures where the capital ranks first in property count, the second-ranked municipality; in prefectures where the capital does not rank first, the top-ranked municipality.
- Data source: MetroEngines Research & Consulting
- — The prefectural capital led its prefecture in accommodation property count in only 26 prefectures. In the remaining 21, another city takes the top spot.
- — In Gifu, Takayama’s 237 properties are 6.58x Gifu City’s 36; in Oita, Yufu’s 264 are 5.87x Oita City’s 45 — administrative and accommodation centers have separated entirely.
- — On estimated settled ADR too, the second city exceeds the capital in 32 prefectures (second-city median ¥13,500 vs. capitals at ¥9,200).
- — The national median ratio of No. 2 to No. 1 property counts is 0.64. Prefectures range from extreme concentration (Osaka 0.05, Kyoto 0.09) to even two-pole balance (Akita and Chiba at 1.00).
- — New openings favor second cities by property count — 1,364 vs. 1,223 for capitals — but by room count the split is 17,049 vs. 63,113 rooms. A mid-scale gap remains in second cities.
The capital is not always the hotel city — the leader changes in 21 prefectures
We first ranked Japan’s municipalities mechanically by the number of properties with sellable inventory observable on OTAs. The coverage period is the 11 confirmed months from September 2025 through July 2026, using each municipality’s monthly median property count as the representative value. Because data for government-designated cities is split by administrative ward, the 20 designated cities were consolidated back to the city level before comparison (Tokyo’s 23 special wards are treated at the ward level, since they are independent basic municipalities both legally and statistically).
The result: the capital city ranked first within its prefecture in 26 cases. In the remaining 21, another city led — and the gaps are not narrow. In Gifu Prefecture, Takayama’s 237 properties are 6.6 times Gifu City’s 36. Oita Prefecture shows Yufu at 264 against Oita City’s 45 (5.9x), and Yamanashi shows Fujikawaguchiko at 257 against Kofu’s 45 (5.7x). In these prefectures the administrative center and the accommodation center have separated completely.
That said, the reasons the leader changes are not uniform. Alongside decisive wins by resort destinations such as Takayama, Yufu, Fujikawaguchiko, Nasu, Kusatsu, Hakone and Hakuba, there are prefectures where two business-demand cities compete closely and the order flips: Okayama (Kurashiki 74 vs. Okayama City 71), Tottori (Yonago 52 vs. Tottori City 45) and Fukushima (Iwaki 96 vs. Fukushima City 75). In Akita, Semboku and Akita City tied at 36 properties each.
| Prefecture | Top municipality | Properties | ADR | Prefectural capital | Properties | ADR | Ratio |
|---|---|---|---|---|---|---|---|
| Gifu | Takayama | 237 | ¥17,000 | Gifu City | 36 | ¥8,300 | 6.58x |
| Oita | Yufu | 264 | ¥23,800 | Oita City | 45 | ¥6,900 | 5.87x |
| Yamanashi | Fujikawaguchiko | 257 | ¥17,400 | Kofu | 45 | ¥7,700 | 5.71x |
| Shizuoka | Ito | 394 | ¥20,300 | Shizuoka City | 96 | ¥7,800 | 4.10x |
| Tochigi | Nasu | 214 | ¥19,400 | Utsunomiya | 58 | ¥7,300 | 3.69x |
| Mie | Shima | 111 | ¥18,300 | Tsu | 35 | ¥7,600 | 3.17x |
| Gunma | Kusatsu | 133 | ¥17,500 | Maebashi | 45 | ¥7,400 | 2.96x |
| Wakayama | Shirahama | 128 | ¥14,600 | Wakayama City | 56 | ¥7,200 | 2.29x |
| Kanagawa | Hakone | 295 | ¥26,200 | Yokohama | 131 | ¥12,600 | 2.25x |
| Nagano | Hakuba | 241 | ¥14,400 | Nagano City | 114 | ¥11,000 | 2.11x |
| Chiba | Minamiboso | 113 | ¥14,600 | Chiba City | 57 | ¥10,500 | 1.98x |
| Yamaguchi | Shimonoseki | 57 | ¥9,500 | Yamaguchi City | 32 | ¥8,000 | 1.78x |
| Tokyo | Taito Ward | 256 | ¥14,700 | Shinjuku Ward | 152 | ¥16,400 | 1.68x |
| Niigata | Yuzawa | 98 | ¥15,100 | Niigata City | 71 | ¥9,200 | 1.38x |
| Shiga | Takashima | 78 | ¥7,500 | Otsu | 58 | ¥12,500 | 1.34x |
| Fukushima | Iwaki | 96 | ¥6,500 | Fukushima City | 75 | ¥8,300 | 1.28x |
| Hyogo | Awaji | 199 | ¥16,200 | Kobe | 158 | ¥18,500 | 1.26x |
| Saitama | Chichibu | 45 | ¥13,500 | Saitama City | 36 | ¥9,600 | 1.25x |
| Tottori | Yonago | 52 | ¥7,200 | Tottori City | 45 | ¥7,900 | 1.16x |
| Okayama | Kurashiki | 74 | ¥8,300 | Okayama City | 71 | ¥8,000 | 1.04x |
| Akita | Semboku | 36 | ¥12,400 | Akita City | 36 | ¥7,300 | 1.00x |
Concentrated or balanced — sorting prefectures by the No. 2 / No. 1 property ratio
Next, taking the ratio of the No. 2 to the No. 1 municipality by property count reveals the “shape” of each prefecture’s accommodation market. The closer to 1, the more evenly balanced the two poles; the closer to 0, the more concentrated. The median across all 47 prefectures was 0.64.
At the balanced end sit Akita (Semboku 36 / Akita City 36 = 1.00), Chiba (Minamiboso 113 / Tateyama 113 = 1.00) and Iwate (Morioka 47 / Hachimantai 46 = 0.98). Okinawa also reaches 0.95, with Naha at 268 properties against Miyakojima’s 256 — the prefectural capital and an island resort forming accommodation clusters of almost identical size.
At the concentrated extreme are Osaka (Osaka City 682 / Izumisano 35 = 0.05) and Kyoto (Kyoto City 1,357 / Kyotango 119 = 0.09). Nara at 0.17 and Fukuoka at 0.17 likewise show accommodation capacity pulled strongly toward the prefectural capital. Fukuoka is distinctive in that its No. 2, Kitakyushu, holds just 71 properties — one-sixth of Fukuoka City’s 408 — despite being a government-designated city itself.
In prefectures with more than one government-designated city, the method of consolidating administrative wards affects the result. In Kanagawa, even after consolidating Yokohama, Kawasaki and Sagamihara to the city level, Hakone’s 295 properties still exceeded Yokohama’s 131. Osaka consolidates Osaka City and Sakai, Shizuoka consolidates Shizuoka City and Hamamatsu, and Fukuoka consolidates Fukuoka City and Kitakyushu. One caveat: where ward names are duplicated within the same prefecture (for example Midori Ward and Minami Ward in both Yokohama and Sagamihara), assignment of a ward to its city is not always unique, so the property counts for designated cities in those prefectures may come out slightly conservative.
Two rate profiles for second cities — resort type in 32 prefectures, business type in 15
Shifting the axis to room rates: comparing each prefecture’s second-city estimated settled ADR against its capital, the second city was higher in 32 of 47 prefectures. This is not a surprising result. Japan’s prefectural capital accommodation markets are centered on business hotels, where rates are held down in exchange for weekday occupancy. Most second cities, by contrast, are hot-spring or resort destinations, where the nightly rate is higher. On how far rates diverge between municipalities within a single prefecture, Japan Intra-Prefecture ADR Gaps Reach 5.2x: 368 Municipalities Ranked sets out the measured ranges nationwide.
Oita is the extreme resort-type case. Yufu’s ADR of roughly ¥23,800 is 3.45 times Oita City’s ¥6,900. Minamiaso Village in Kumamoto (about ¥25,600) is 2.88 times Kumamoto City, and Nasu in Tochigi (about ¥19,400) is 2.66 times Utsunomiya. Hakone in Kanagawa is also high at roughly ¥26,200. The highest estimated settled ADR among all 47 second cities was Kyotango in Kyoto Prefecture, at approximately ¥28,200.
| Resort type — second-city ADR exceeds the prefectural capital (top 12 prefectures) | ||||||
|---|---|---|---|---|---|---|
| Prefecture | Second city | Properties | ADR | Prefectural capital | ADR | Ratio |
| Oita | Yufu | 264 | ¥23,800 | Oita City | ¥6,900 | 3.45x |
| Kumamoto | Minamiaso Village | 64 | ¥25,600 | Kumamoto City | ¥8,900 | 2.88x |
| Tochigi | Nasu | 214 | ¥19,400 | Utsunomiya | ¥7,300 | 2.66x |
| Shizuoka | Ito | 394 | ¥20,300 | Shizuoka City | ¥7,800 | 2.60x |
| Mie | Shima | 111 | ¥18,300 | Tsu | ¥7,600 | 2.39x |
| Gunma | Kusatsu | 133 | ¥17,500 | Maebashi | ¥7,400 | 2.35x |
| Yamanashi | Fujikawaguchiko | 257 | ¥17,400 | Kofu | ¥7,700 | 2.26x |
| Kagoshima | Kirishima | 87 | ¥14,300 | Kagoshima City | ¥6,700 | 2.13x |
| Kanagawa | Hakone | 295 | ¥26,200 | Yokohama | ¥12,600 | 2.08x |
| Gifu | Takayama | 237 | ¥17,000 | Gifu City | ¥8,300 | 2.05x |
| Wakayama | Shirahama | 128 | ¥14,600 | Wakayama City | ¥7,200 | 2.03x |
| Ishikawa | Kaga | 58 | ¥19,800 | Kanazawa | ¥10,200 | 1.94x |
Conversely, 15 prefectures had a lower-rate second city. Kitakyushu in Fukuoka (about ¥7,600, 0.51x Fukuoka City), Hakodate in Hokkaido (about ¥8,300, 0.56x Sapporo) and Takashima in Shiga (about ¥7,500, 0.60x Otsu) are among them. These are less hot-spring destinations than practical accommodation markets absorbing business demand and wide-area through traffic. A low rate is a characteristic of the market, not a verdict on its quality. If anything, a segment whose room rates are restrained relative to its urban scale retains room for rate growth once demand accumulates — that is, upside. For designated- and core-city-class markets sitting in this position, such as Kitakyushu and Niigata, Hotel Investment in Japan’s “Second-Tier” Cities digs into the investment headroom across ADR, supply and yield.
| Business type — second-city ADR falls below the prefectural capital (bottom 12 prefectures) | ||||||
|---|---|---|---|---|---|---|
| Prefecture | Second city | Properties | ADR | Prefectural capital | ADR | Ratio |
| Fukuoka | Kitakyushu | 71 | ¥7,600 | Fukuoka City | ¥15,100 | 0.51x |
| Hokkaido | Hakodate | 149 | ¥8,300 | Sapporo | ¥15,000 | 0.56x |
| Shiga | Takashima | 78 | ¥7,500 | Otsu | ¥12,500 | 0.60x |
| Aomori | Hachinohe | 34 | ¥6,500 | Aomori City | ¥9,400 | 0.69x |
| Osaka | Izumisano | 35 | ¥8,200 | Osaka City | ¥11,400 | 0.73x |
| Ehime | Imabari | 61 | ¥7,200 | Matsuyama | ¥9,900 | 0.73x |
| Nagasaki | Goto | 60 | ¥7,500 | Nagasaki City | ¥9,900 | 0.76x |
| Miyazaki | Nichinan | 34 | ¥6,300 | Miyazaki City | ¥8,100 | 0.78x |
| Fukushima | Iwaki | 96 | ¥6,500 | Fukushima City | ¥8,300 | 0.79x |
| Yamagata | Tsuruoka | 56 | ¥9,600 | Yamagata City | ¥12,200 | 0.79x |
| Kochi | Shimanto | 26 | ¥6,700 | Kochi City | ¥7,700 | 0.87x |
| Hyogo | Awaji | 199 | ¥16,200 | Kobe | ¥18,500 | 0.88x |
Depth as a transport node — second cities seen through station passenger volumes
Accommodation clusters tend to follow transport nodes. Matching the central station of each prefectural capital against the representative station of its second city, using station-level daily boarding and alighting figures (FY2023) from the MLIT Real Estate Information Library, one pattern stands out: even where property counts are close, passenger volumes can differ enormously.
| Prefecture | Capital central station | Passengers/day | Second-city station | Passengers/day | Ratio |
|---|---|---|---|---|---|
| Hokkaido | Sapporo Station | 168,030 | Hakodate Station | 4,386 | 3% |
| Fukuoka | Hakata Station | 239,124 | Kokura Station | 64,146 | 27% |
| Shizuoka | Shizuoka Station | 107,931 | Ito Station | 13,032 | 12% |
| Oita | Oita Station | 33,898 | Yufuin Station | 2,682 | 8% |
| Kanagawa | Yokohama Station | 724,696 | Hakone-Yumoto Station | 9,279 | 1% |
| Ehime | Matsuyamashi Station | 17,439 | Imabari Station | 4,178 | 24% |
| Yamaguchi | Shin-Yamaguchi Station | 14,996 | Shimonoseki Station | 17,280 | 115% |
| Shimane | Matsue Station | 7,296 | Izumoshi Station | 4,580 | 63% |
What is striking is how far the correlation between property count and station passenger volume breaks down in second cities. Yufuin Station handles just 2,682 passengers a day, yet Yufu holds 264 properties — the most in its prefecture. Hakone likewise carries 295 properties against Hakone-Yumoto Station’s 9,279. Demand there arrives by private car, tour bus and airport access rather than rail capacity. Conversely, Kitakyushu (Kokura Station, 64,146) and Shimonoseki (Shimonoseki Station, 17,280) have real depth as transport nodes yet restrained property counts — a different balance of urban function and accommodation supply than in the capitals.
New supply: property count goes to second cities, room count to the capitals
Finally, new supply. Aggregating properties confirmed as opening between January 2023 and June 2026, split between prefectural capitals and second cities, second cities led on property count with 1,364 openings against the capitals’ 1,223. On room count, however, the capitals took 63,113 rooms against second cities’ 17,049 — a 3.7-fold gap. Average rooms per opening was 51.6 in capitals and 12.5 in second cities. What is being added in second cities is mostly small-format supply — rental villas, cottages and small guesthouses — while supply at meaningful room scale remains concentrated in the capitals.
This asymmetry can be reread from an investment perspective. Second cities have the property-count density, and in the resort type they also command higher rates than the capitals. Yet almost no mid-scale or larger supply with meaningful room counts is being added. In other words, there is an accommodation cluster with real depth as a demand catchment, but a thin layer of properties able to work economies of scale. That is where the headroom lies. On which size band to target, 582 Hotels Opening 2026: 30-Room Luxury vs 200+ Scale Polarization examines the split between the 30-room high-ADR format and the 300-room scale-efficiency format; read alongside the second-city/capital asymmetry here, the outline sharpens.
Resort-type second cities
Yufu, Nasu, Hakone, Minamiaso and the like. Rates run two to three times the prefectural capital. Property counts are high but average just 12.5 rooms per opening — small-format dominated, with thin supply in the mid-scale band.
Business-type second cities
Kitakyushu, Hakodate, Iwaki, Hachinohe and the like. Real depth as transport nodes, yet restrained rates — a segment retaining rate upside once demand accumulates.
Balanced prefectures
Akita, Chiba, Iwate, Okinawa, Okayama and others where the No. 2 / No. 1 property ratio exceeds 0.9. Demand is split across two hubs, and looking at only one of them misreads the market.
Pricing the scale gap — rooms per property × estimated settled ADR
The figures so far describe second cities as markets that are dense in properties and high in rate, but small in rooms per property. To size that difference in monetary terms, we convert it using only figures already presented in this article. The conversion is a single unit calculation — full-occupancy nightly room revenue = rooms per property × estimated settled ADR — with no occupancy rate and no costs assumed. It is not a forward revenue projection; it simply places the scale gap and the rate gap on the same yardstick.
| Full-occupancy nightly room revenue as rooms per property varies in second cities | ||||
|---|---|---|---|---|
| Scenario | Rooms per property | Estimated settled ADR | Full-occupancy nightly room revenue | Basis for room count |
| Downside | current second-city average | 12.5 rooms | ¥13,500 | ¥168,750 | Unchanged at 12.5 rooms per new opening |
| Mid | midpoint of the two | 32.1 rooms | ¥13,500 | ¥433,350 | Midpoint of 12.5 and 51.6 rooms |
| Upside | capital-equivalent scale | 51.6 rooms | ¥13,500 | ¥696,600 | Capitals’ new-opening average of 51.6 rooms |
Placing new openings in the capitals on the same yardstick gives 51.6 rooms × ¥9,200 = ¥474,720. If second cities could secure the capitals’ 51.6 rooms, they would reach ¥696,600 — a difference of ¥221,880 (+46.7%). At the current 12.5 rooms, however, they stop at ¥168,750, which is -64.5% against the capital level. Even with a 1.47x rate advantage, that advantage does not survive a room scale one-fourth as large — this is the monetary meaning of the “mid-scale gap” described here.
| Rooms per property \ Estimated settled ADR | ¥9,200 Capital median | ¥13,500 Second-city median | ¥17,400 Fujikawaguchiko | ¥20,300 Ito | ¥25,600 Minamiaso Village |
|---|---|---|---|---|---|
| 12.5 rooms | ¥115,000 | ¥168,750 | ¥217,500 | ¥253,750 | ¥320,000 |
| 22.3 rooms | ¥205,160 | ¥301,050 | ¥388,020 | ¥452,690 | ¥570,880 |
| 32.1 rooms | ¥295,320 | ¥433,350 | ¥558,540 | ¥651,630 | ¥821,760 |
| 41.9 rooms | ¥385,480 | ¥565,650 | ¥729,060 | ¥850,570 | ¥1,072,640 |
| 51.6 rooms | ¥474,720 | ¥696,600 | ¥897,840 | ¥1,047,480 | ¥1,320,960 |
Reading the grid vertically, raising rooms per property from 12.5 to 51.6 has a larger effect than raising the ADR level from ¥13,500 to ¥25,600. Resort-type second cities already sit toward the right of the horizontal axis, so their remaining headroom lies on the vertical axis — that is, in mid-scale supply. Business-type second cities, by contrast, retain room on both axes, with the rate upside on demand accumulation as described in the previous section.
Conclusion — drop the assumption that the capital is the accommodation center
Recounting all 47 prefectures mechanically, the prefectural capital led on accommodation property count in only 26. And not only on property count: in 32 prefectures the second city also commands a higher rate than the capital. Japan’s accommodation market broadly carries a structure in which the administrative center and the accommodation center do not coincide.
The Japan Tourism Agency’s Accommodation Travel Statistics Survey points the same way: in 2025, foreign overnight stays in non-metropolitan areas grew 19.1% year on year, outpacing the three major metropolitan areas and confirming the regional dispersion of demand. Evaluating areas against a baseline set at the prefectural capital means missing the cities where accommodation is actually accumulating. In looking at the market, there is value in recounting at the municipal level rather than by prefecture or by capital.
The supply-side asymmetry — property counts rising in second cities while room scale stays weighted toward the capitals — also indicates that a mid-scale gap remains in second cities. In resort-type second cities, where high rates and property density coexist, that gap is especially wide.
On data coverage: The property counts and ADRs in this article are aggregated from approximately 27,000 properties and around 1.26 million rooms whose activity can be confirmed on OTAs, drawn from the roughly 168,000 domestic properties tracked by MetroEngines Research & Consulting. This is not a complete census; ryokan, minshuku and simple lodging businesses not listed on OTAs are excluded. Property counts are monthly medians for each municipality, smoothing seasonal variation in listings.
Related reading
- Hotel Investment in Japan’s “Second-Tier” Cities: ADR, Supply & Yield Across 5 Markets
- Japan Intra-Prefecture ADR Gaps Reach 5.2x: 368 Municipalities Ranked
- 582 Hotels Opening 2026: 30-Room Luxury vs 200+ Scale Polarization
- Supply Absorption Capacity in 8 Regional Core Cities — GW2026 Sellout Rate × New Openings Map
References and Sources
■ Data sources
Municipality-level accommodation property counts and estimated settled ADR are compiled by MetroEngines Research & Consulting from publicly available OTA information, covering the 11 confirmed months from September 2025 to July 2026. New-opening data is on the same firm’s confirmed-OTA-listing basis for January 2023 to June 2026. Station-level boarding and alighting passenger figures are from the MLIT Real Estate Information Library (FY2023, maximum by line). Foreign overnight stay figures are from the Japan Tourism Agency’s Accommodation Travel Statistics Survey.
■ Calculation assumptions
Property count is the median of each municipality’s monthly property count; area ADR is the estimated settled rate (tax-exclusive equivalent) obtained by averaging the median across target properties over the coverage period. Government-designated cities have ward-level data consolidated to the city level, while Tokyo’s 23 special wards are treated at the ward level. “Second city” is defined as the second-ranked municipality in prefectures where the capital ranks first in property count, and the top-ranked municipality in prefectures where the capital does not rank first. The full-occupancy nightly room revenue in the sensitivity section is a unit conversion of “rooms per property × estimated settled ADR” and is not a revenue projection including occupancy or costs. Both axes are kept inside the measured values presented in this article.
■ Limitations and caveats
Because the scope covers properties whose activity is confirmable on OTAs rather than a complete census, ryokan, minshuku and simple lodging businesses not listed on OTAs are excluded. Where government-designated cities within the same prefecture share duplicate ward names (for example Midori Ward and Minami Ward in both Yokohama and Sagamihara), the assignment of a ward to its city is not uniquely determined, so property counts for designated cities in those prefectures may come out slightly conservative. ADR is an estimate and differs from each property’s actual transacted prices and accounting figures (cross-checked against listed hotel REIT disclosures, the median error is approximately 7%). Property counts, ADR and new-opening counts are all snapshots as of the time of writing and will shift with subsequent OTA listing updates. New openings for 2026 are a partial tally covering January–June.
■ Market data
- MetroEngines Research & Consulting — Municipality-level accommodation property counts and estimated settled ADR (September 2025–July 2026), new-opening data (confirmed OTA listing basis, January 2023–June 2026)
■ Government statistics and public data
- MLIT Real Estate Information Library — station-level boarding and alighting passengers (FY2023)
- Japan Tourism Agency, “Accommodation Travel Statistics Survey,” January–December 2025 (annual confirmed figures) press release
- Japan Tourism Agency, “Accommodation Travel Statistics Survey”
■ Reference articles