

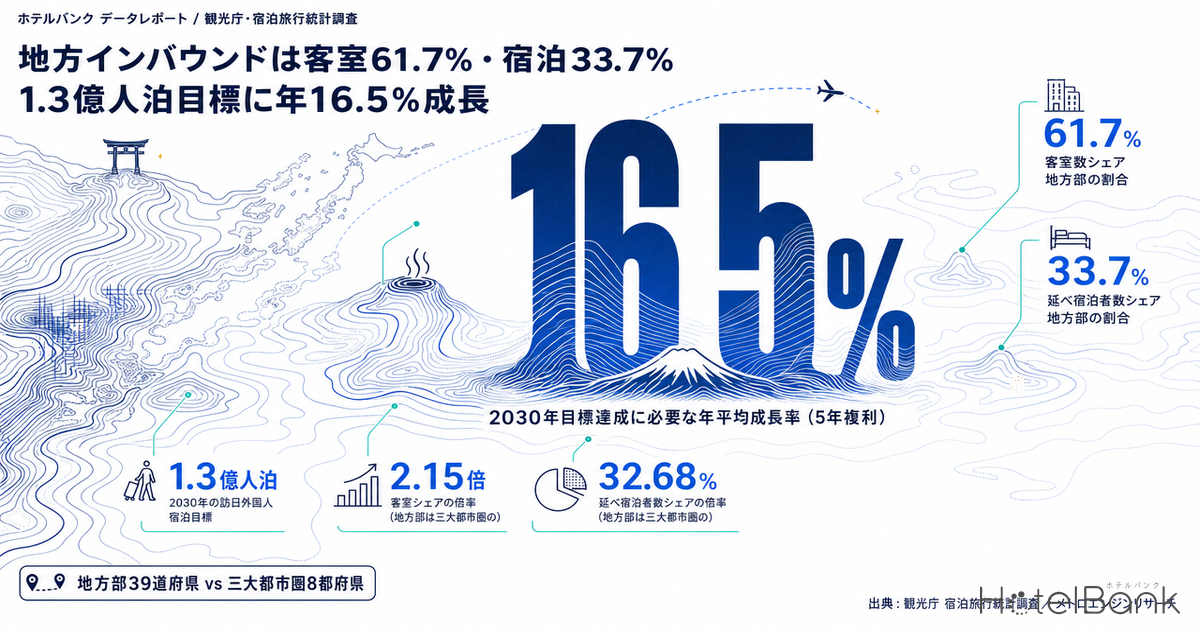
Discussion of inbound travel gravitates toward “how many came.” But for municipalities, DMOs and regional lodging operators, the number that really bites is where those visitors slept. Aggregating the Japan Tourism Agency’s Overnight Travel Statistics Survey from the primary workbook, the regional share in May 2026 was 32.68% — up 1.91pt from the same month a year earlier, the fourth consecutive year of gains.
Meanwhile, the 5th Basic Plan for Promoting a Tourism-Oriented Country, approved by the Cabinet in March 2026, set a target of 130 million foreign guest nights in regional Japan by 2030, putting the regions on a 1:1 footing with the three major metropolitan areas. That is 2.15x the current level. This article works backward from that gap in guest-night terms and counts, prefecture by prefecture, how far the room stock of the 39 regional prefectures could absorb it.
Metric Definitions Used in This Article
- Three major metropolitan areas: the 8 prefectures of Saitama, Chiba, Tokyo, Kanagawa, Aichi, Kyoto, Osaka and Hyogo. This is exactly the definition used in the Basic Plan for Promoting a Tourism-Oriented Country and in the Tourism Vision Supporting Tomorrow’s Japan.
- Regional areas: the 39 prefecturesother than the 8 above. It is a residual definition — “areas outside the three major metropolitan areas” — so major destinations such as Hokkaido, Okinawa and Fukuoka are also counted as regional.
- Guest nights: number of guests x nights stayed. One person staying two nights counts as two guest nights. Official aggregate from the JTA Overnight Travel Statistics Survey.
- Annual foreign guest nights per room: each prefecture’s 2025 foreign guest nights (JTA) divided by its room count (facilities with confirmed operation tracked by MetroEngines Research). It expresses the density of inbound demand relative to stock.
- Occupancy rate (OCC): published figures from the JTA Overnight Travel Statistics Survey (all accommodation types). This article uses the simple average for January-May 2026; prefecture-level aggregates are weighted by room count.
- Data sources: JTA Overnight Travel Statistics Survey trend workbook, JTA Basic Plan for Promoting a Tourism-Oriented Country (5th), MetroEngines Research
- — The regional share in May 2026 was32.68% (+1.91pt YoY), a fourth straight year of gains. The pace has eased, though, from the +3-4pt range in 2025 to +1-2pt — cruising rather than accelerating.
- — The 2030 target of130 million guest nights is 2.15x the 60.56 million recorded in 2025. The required CAGR of +16.5% is roughly three times the +5.8% actually achieved from 2019 to 2025.
- — Regional Japan holds61.7% (781,974 rooms) of the national room stock but takes only 33.7% of foreign guest nights. The Japanese-guest share of 62.6% almost exactly matches the stock distribution: it is only foreign demand that is skewed toward the cities.
- — At the target level, density would be166.2 guest nights per room — two-thirds of the 246.3 the three major metropolitan areas already handle today. The constraint is not the volume of physical stock but how demand reaches it.
- — Inside regional Japan too,four prefectures (Hokkaido, Yamanashi, Fukuoka, Okinawa) take 55.6% of guest nights on 24.5% of the rooms. The upside remains in “large stock x low density” prefectures such as Shizuoka, Nagano, Niigata, Miyagi and Fukushima.
First, fix the definition — “regional” means 39 prefectures, Hokkaido and Okinawa included
The most misunderstood term in this field is “regional areas.” The JTA’s regional category for target-setting is not about depopulated districts or places outside prefectural capitals. It refers toall 39 prefectures left after excluding the 8 that make up the three major metropolitan areas. A footnote in the Basic Plan states explicitly that “‘regional areas’ in the targets of the Basic Plan and the Tourism Vision means areas other than the three major metropolitan areas (Saitama, Chiba, Tokyo, Kanagawa, Aichi, Kyoto, Osaka and Hyogo).”
So Hokkaido, Okinawa, Fukuoka and Hiroshima are all “regional” in the statistics. When a headline says “the regional share is above 30%,” it has to be read as: a substantial part of that 30% is Sapporo, Naha and Hakata. Conversely, the definition is a clean instrument for measuring concentration in Tokyo, Osaka, Kyoto and Aichi, but too coarse to capture conditions in mountainous districts and small towns. That is why the second half of this article breaks down the gradient inside regional Japan.
One more point. The three major metropolitan areas include Chiba (Narita, Maihama) and Hyogo (Kobe, Kinosaki). Their character as destinations differs considerably from central Tokyo, yet for target purposes they are counted on the urban side. This asymmetry matters when interpreting the goal, and is worth keeping in mind.
The regional share was 32.68% in May 2026, rising for a fourth straight year
The chart below aggregates foreign guest nights by prefecture from the JTA trend workbook and plots the 39 regional prefectures’ share of the national total by month. Years are overlaid so that seasonality and level shifts can be read at the same time.
The shape is almost identical every year: highest in January-February, falling through March-June, lifting again in October and December. The main driver of those peaks and troughs is not the foreign side butJapanese-side seasonality. In winter, ski and onsen demand thickens foreign volumes in the regions while urban foreign demand relatively softens. What matters is not the shape but the fact that the line shifts upward year after year.
Source: JTA Overnight Travel Statistics Survey trend workbook and MetroEngines Research; compiled by the HotelBank Editorial Team (N=27,249 facilities, 1,266,986 rooms)
Now the levels. For each month from January to May, the year-on-year change in the regional share is as follows.
| Month | 2026 regional share | Same month 2025 | YoY change |
|---|---|---|---|
| January 2026 | 40.22% | 39.18% | +1.04pt |
| February 2026 | 41.42% | 39.99% | +1.43pt |
| March 2026 | 34.58% | 32.73% | +1.85pt |
| April 2026 | 33.78% | 30.83% | +2.95pt |
| May 2026 | 32.68% | 30.77% | +1.91pt |
Source: JTA Overnight Travel Statistics Survey trend workbook; compiled by the HotelBank Editorial Team
All five months came in above the prior year. The size of the gains, however, was larger in 2025: the 2024→2025 changes were +4.15pt in January, +3.63pt in February and +3.60pt in March, against +1.04pt, +1.43pt and +1.85pt for 2025→2026. Growth continues, but it reads as cruising rather than accelerating.
Note also that, from the January 2026 survey, the JTA changed the stratification basis of its sample design from “number of employees” to “number of rooms.” The agency itself cautions that “year-on-year comparisons and year-on-year differences may include the effect of this revision,” solevel comparisons of guest-night counts can contain a break. That is why this article is built on shares rather than growth rates in guest nights: a share is a composition ratio within the same survey and the same month, so numerator and denominator carry the same design change, making it more robust than a level comparison.
The target: 130 million guest nights, 1:1 with the metros — 2.15x today, +16.5% a year
The 5th Basic Plan for Promoting a Tourism-Oriented Country (plan period FY2026-2030), approved by the Cabinet on 27 March 2026, kept the existing goals of 60 million inbound visitors and ¥15tn in spending by 2030 and added a new target for regional visitor attraction. Goal 6 in the summary document reads: “aim to raise inbound guest nights in regional areas to 130 million and make them equal (1:1) with the three major metropolitan areas.” On the funding side, the FY2026 tax reform outline sets out raising the International Tourist Tax from ¥1,000 to ¥3,000 from 1 July 2026, with the proceeds directed at regional visitor attraction, demand dispersion and overtourism countermeasures.
So where do things stand today? Aggregating the JTA’s 2025 annual figures (final), the 39 regional prefectures recorded60.56 million guest nights, against119.36 million guest nights in the 8 metropolitan prefectures. The regional share is 33.66%, a ratio of 1 to 1.97 against the urban side.
Source: JTA Overnight Travel Statistics Survey trend workbook and MetroEngines Research; compiled by the HotelBank Editorial Team (N=27,249 facilities, 1,266,986 rooms)
Working backwards from there:
Distance to the 130 million guest-night target (from the 2025 final figures)
- Additional guest nights required: 130 million − 60.56 million = 69.44 million guest nights
- Multiple:2.15x(vs 2025)
- CAGR required to reach 2030:+16.5%(5-year compound)
- For reference: regional Japan recorded 43.09 million guest nights in 2019; the actual 2019→2025 CAGR was +5.8%
Holding +16.5% for five years is close to three times the +5.8% actually achieved — an ambitious level, and worth stating plainly. At the same time, the target assumes the metropolitan side stays at 130 million guest nights (currently 119.36 million), so with little headroom set for the cities, policy resources tilt toward the regions. Tripling the International Tourist Tax rate is the funding behind that.
The Japanese-guest target is worth reading alongside it. The same plan sets 320 million Japanese guest nights in regional areas, against 301 million achieved in 2025 — essentially flat. Total guest nights in regional Japan therefore go from 362 million in 2025 to 450 million in 2030,+24.4%. For lodging operators, the practical planning figure is not “inbound x2.15” but “total guests up about 1.25x over five years.”
Capacity — regional Japan holds 61.7% of national rooms and 33.7% of foreign guest nights
This is the heart of the matter. Can the regional room stock absorb 1.25x the total guest nights?
Of the roughly 168,000 domestic facilities tracked by MetroEngines Research, 27,249 facilities with 1,266,986 rooms can be confirmed as operating on OTAs and other booking sites (as of the survey date). Split between the metropolitan areas and the regions, the 39 regional prefectures hold 19,534 facilities and781,974 rooms, or61.7% of the national room stock. The three major metropolitan areas hold 484,671 rooms, or 38.3%.
Setting that 61.7% next to three demand-side shares makes the structure clear.
Source: JTA Overnight Travel Statistics Survey trend workbook and MetroEngines Research; compiled by the HotelBank Editorial Team (N=27,249 facilities, 1,266,986 rooms)
The regional share of Japanese guest nights is 62.6%, almost identical to the 61.7% room-stock share. Japanese guests stay broadly in line with where the stock is. Foreign guests, by contrast, account for only 33.7%.On the same room stock, Japanese demand is distributed almost evenly and only foreign demand is skewed toward the cities — that is the core of the regional inbound question.
Restated as density: annual foreign guest nights per room in regional Japan are77.4 guest nights, versus246.3 guest nights in the three major metropolitan areas — a 3.2x gap. Even if the regions reached the 130 million guest-night target, per-room density would be 166.2 guest nights, still short of what the metropolitan areas handletoday.In other words, the density needed to hit the target is two-thirds of what urban Japan already processes as a matter of routine.It does not read as a story in which physical stock binds first.
This per-room guest-night lens applied to all 47 prefectures is set out inJune 2026 Occupancy 56.2%: Guest-Nights per Room in 47 Prefectures, where the headroom on a total-demand basis including Japanese guests can also be checked.
Occupancy tells the same story. Weighting January-May 2026 occupancy by room count, the 39 regional prefectures come to52.8%, against68.8%, and the 8 metropolitan prefectures to 68.8% — a 16.0pt gap. If regional guest nights rose the planned +24.4% and occupancy moved at the same rate, 52.8% would become 65.7%, still below where the metropolitan areas are today. Taking the foreign component alone, absorbing the additional 69.44 million guest nights at 1.6 guests per room works out to roughly +15.2pt of annual occupancy (+16.2pt at 1.5 guests, +13.5pt at 1.8).
This is of course an annual-average argument, while real demand concentrates at the peaks. As shown in our earlier articleWinter Schedule Oct 25: Do 20 Regional Airports Have Enough Rooms?, the picture of spare capacity changes once you narrow the frame to airport catchments. Even so, at prefecture-level macro resolution the conclusion holds: the regional upside lies not in the volume of rooms but in how demand reaches them.
Inside regional Japan — four prefectures hold 55.6%
Treating “regional Japan” as one block leads to misreading. Sorting the 39 prefectures into four tiers by annual foreign guest nights per room reveals an extreme skew.
| Density tier | Prefectures | Rooms | Share of regional rooms | 2025 foreign guest nights | Share of regional guest nights | Prefectures in tier |
|---|---|---|---|---|---|---|
| Under 25 guest nights/room | 12 | 175,623 rooms | 22.5% | 3,137,940 | 5.2% | Fukui, Yamaguchi, Akita, Shimane, Fukushima, Gunma, Kochi, Mie, Ibaraki, Yamagata, Miyazaki, Tochigi |
| 25-60 guest nights/room | 15 | 288,335 rooms | 36.9% | 11,697,500 | 19.3% | Tottori, Iwate, Shiga, Niigata, Toyama, Kagoshima, Tokushima, Saga, Miyagi, Aomori, Nagasaki, Ehime, Okayama, Shizuoka, Nagano |
| 60-120 guest nights/room | 8 | 126,540 rooms | 16.2% | 12,041,040 | 19.9% | Wakayama, Nara, Hiroshima, Oita, Kumamoto, Kagawa, Ishikawa, Gifu |
| 120 guest nights/room or more | 4 | 191,476 rooms | 24.5% | 33,685,950 | 55.6% | Hokkaido, Yamanashi, Fukuoka, Okinawa |
Source: JTA Overnight Travel Statistics Survey trend workbook and MetroEngines Research; compiled by the HotelBank Editorial Team (N=27,249 facilities, 1,266,986 rooms)
The top tier — Hokkaido, Yamanashi, Fukuoka and Okinawa alone — holds 24.5% of regional rooms while taking55.6% of regional foreign guest nights. The bottom 12 prefectures hold 22.5% of the rooms but only5.2% of the guest nights. Nearly the same volume of room stock carries roughly a tenfold difference in density.
In a scatter plot the structure shows up directly as a separation between top-right and bottom-left. The horizontal axis is room stock, the vertical axis annual foreign guest nights per room.
Source: JTA Overnight Travel Statistics Survey trend workbook and MetroEngines Research; compiled by the HotelBank Editorial Team (N=27,249 facilities, 1,266,986 rooms)
Two dotted lines are drawn. The lower one (166.2 guest nights/room) is the level implied by allocating the 130 million guest-night target evenly across the 39 regional prefectures; the upper one (246.3) is where the three major metropolitan areas stand today. Only Okinawa is above the target line at present. Hokkaido, Fukuoka and Yamanashi approach it, and the remaining 35 prefectures all sit below.The absolute volume of growth headroom is concentrated in the prefectures with large room stock in the lower left — that is what the chart shows. Prefectures with big inventories such as Shizuoka (47,250 rooms, 47.2 guest nights/room), Nagano (45,283 rooms, 55.4), Niigata (28,039 rooms, 30.3), Miyagi (27,547 rooms, 36.5) and Fukushima (24,673 rooms, 14.6) still sit low on density.
The map confirms the same structure. Circle size is room count and colour is foreign guest nights per room.
Source: JTA Overnight Travel Statistics Survey and MetroEngines Research; compiled by the HotelBank Editorial Team
Dark (high-density) circles are limited to Hokkaido, Fukuoka, Okinawa, Yamanashi, Ishikawa and Gifu; the Sea of Japan coast of Honshu, Tohoku, northern Kanto and inland Shikoku are pale throughout. The paler the colour relative to the size of the circle, the more room there is to add demand on top of existing stock.
All 39 regional prefectures — stock, density and occupancy
The full set of prefecture figures follows, sorted in ascending order of annual foreign guest nights per room. The higher up the table, the lower the density of inbound demand against existing stock — and the larger the headroom.
| Prefecture | Rooms | 2025 foreign guest nights | Guest nights/room | OCC Jan-May 2026 | Foreign share Jan-May 2026 |
|---|---|---|---|---|---|
| Fukui | 9,096 | 108,550 | 11.9 | 42.2% | 4.1% |
| Yamaguchi | 12,764 | 162,210 | 12.7 | 57.1% | 5.1% |
| Akita | 10,839 | 148,370 | 13.7 | 44.1% | 5.4% |
| Shimane | 8,330 | 114,300 | 13.7 | 50.9% | 3.5% |
| Fukushima | 24,673 | 359,740 | 14.6 | 48.1% | 5.9% |
| Gunma | 20,514 | 360,270 | 17.6 | 47.2% | 6.0% |
| Kochi | 7,639 | 140,780 | 18.4 | 53.5% | 6.5% |
| Mie | 19,712 | 380,320 | 19.3 | 53.6% | 4.1% |
| Ibaraki | 16,041 | 312,000 | 19.5 | 55.5% | 4.6% |
| Yamagata | 13,906 | 312,550 | 22.5 | 43.6% | 11.6% |
| Miyazaki | 11,703 | 263,050 | 22.5 | 53.9% | 7.2% |
| Tochigi | 20,406 | 475,800 | 23.3 | 51.6% | 5.6% |
| Tottori | 7,893 | 203,600 | 25.8 | 44.4% | 8.4% |
| Iwate | 16,320 | 449,750 | 27.6 | 49.9% | 10.6% |
| Shiga | 10,228 | 307,990 | 30.1 | 54.9% | 8.2% |
| Niigata | 28,039 | 848,870 | 30.3 | 43.8% | 12.7% |
| Toyama | 11,884 | 386,900 | 32.6 | 54.3% | 11.3% |
| Kagoshima | 20,514 | 708,960 | 34.6 | 51.1% | 10.6% |
| Tokushima | 6,406 | 230,080 | 35.9 | 49.2% | 9.7% |
| Saga | 6,926 | 251,600 | 36.3 | 55.8% | 13.0% |
| Miyagi | 27,547 | 1,005,110 | 36.5 | 56.3% | 12.7% |
| Aomori | 14,426 | 542,890 | 37.6 | 49.6% | 12.3% |
| Nagasaki | 17,445 | 764,770 | 43.8 | 53.1% | 12.4% |
| Ehime | 13,223 | 580,840 | 43.9 | 59.0% | 14.9% |
| Okayama | 14,951 | 678,880 | 45.4 | 52.1% | 13.4% |
| Shizuoka | 47,250 | 2,228,920 | 47.2 | 53.4% | 8.5% |
| Nagano | 45,283 | 2,508,340 | 55.4 | 38.7% | 18.9% |
| Wakayama | 11,416 | 877,250 | 76.8 | 46.8% | 15.8% |
| Nara | 6,675 | 520,110 | 77.9 | 51.9% | 14.2% |
| Hiroshima | 25,385 | 2,115,660 | 83.3 | 62.8% | 20.4% |
| Oita | 17,768 | 1,491,590 | 83.9 | 52.7% | 24.2% |
| Kumamoto | 18,377 | 1,762,060 | 95.9 | 51.8% | 21.9% |
| Kagawa | 10,870 | 1,127,050 | 103.7 | 55.9% | 22.1% |
| Ishikawa | 18,641 | 2,142,820 | 115.0 | 57.5% | 24.4% |
| Gifu | 17,408 | 2,004,500 | 115.1 | 51.9% | 28.9% |
| Hokkaido | 82,855 | 13,302,630 | 160.6 | 55.2% | 33.5% |
| Yamanashi | 16,911 | 2,750,510 | 162.6 | 40.7% | 27.9% |
| Fukuoka | 49,133 | 8,421,120 | 171.4 | 70.3% | 37.7% |
| Okinawa | 42,577 | 9,211,690 | 216.4 | 57.2% | 27.6% |
Source: JTA Overnight Travel Statistics Survey trend workbook and MetroEngines Research; compiled by the HotelBank Editorial Team (N=27,249 facilities, 1,266,986 rooms)
The rightmost column, “foreign share,” is foreigners as a proportion of that prefecture’s total guest nights. Even within regional Japan, Fukuoka at 37.7%, Hokkaido at 33.5% and Gifu at 28.9% look close to the metropolitan mix, while in Shimane (3.5%), Mie (4.1%) and Fukui (4.1%) Japanese guests account for almost everything. The same label “regional” covers completely different business structures. Prefecture-level differences in inbound length of stay are covered separately inInbound Stay Length Varies 2.0x: Tokyo 2.32 vs Yamanashi 1.16 Nights.
Which prefectures are actually growing now — Ibaraki, Ehime, Kochi, Fukushima, Tottori
Finally, recent momentum. As noted, the 2026 stratification change can put a break into level comparisons with the prior year, so the ranking here uses“relative growth” — each prefecture’s year-on-year change minus the national year-on-year change. The design change common to the whole country largely cancels out in the subtraction, leaving a form that can be read as a ranking across prefectures. The window is the cumulative January-May 2026 figures, limited to prefectures with at least 60,000 guest nights in that period to avoid thin samples.
Source: JTA Overnight Travel Statistics Survey trend workbook and MetroEngines Research; compiled by the HotelBank Editorial Team (N=27,249 facilities, 1,266,986 rooms)
Ibaraki stands out (+59.1pt versus the national rate). It recorded 165,030 guest nights in January-May 2026, and against a stock of 16,041 rooms that is still only 19.5 guest nights per room. The driver cited is the airport. On 7 August 2025 the Ministry of Land, Infrastructure, Transport and Tourism lifted the restrictions on international service into Ibaraki Airport, opening the way to new routes and added frequencies. Ibaraki Airport handled a record 830,000 passengers in FY2025, with scheduled Korean services reported as the main lift to international traffic. The Higashi-Kanto Expressway Mito Line (Hokota-Itako), due to open in 2026, should further improve airport access. Sitting on the outer edge of the Tokyo metropolitan area, where demand spills out from the centre, also helps.
Ehime (+43.5pt) is continuing a run that began earlier. Its foreign guest nights as of 2024 were +109.1% against 2019, the second-highest growth rate among the prefectures. Matsuyama Airport’s international network is three Asian routes — Taipei, Seoul and Busan — with Taiwan and South Korea reported to account for around 60% of inbound visitors. The route count is limited, but that makes the target clear, and prefectural visitor-attraction investment and overseas influencer campaigns have compounded. At 43.9 guest nights per room and 59.0% occupancy (January-May 2026 average), it has climbed into the middle of the regional pack.
Kochi (+42.9pt), Fukushima (+42.2pt) and Tottori (+35.2pt) belong to the same family. All have repeatedly been named in monthly commentary on tourism statistics as prefectures that grew off charter flights or newly launched international services. What they share is: (1) a small base, so a single route moves the share materially; (2) slack in room stock (Fukushima 24,673 rooms at 48.1% occupancy for January-May 2026; Tottori 7,893 rooms at 44.4% over the same period); and (3) locations that can take both group business and rental-car touring. Miyagi (+28.2pt, 27,547 rooms), Aomori (+30.8pt, 14,426 rooms) and Nagasaki (+26.3pt, 17,445 rooms) fit the same pattern, all retaining slack that can be layered onto existing stock.
Conversely, the high-density prefectures have been relatively quiet of late. Okinawa, Hokkaido and Fukuoka tracked at or slightly below the national rate for cumulative January-May 2026. A large base makes growth rates harder to post — the flip side of a high level. The prefecture-level distribution by nationality is covered inUS Now Tops Japan Inbound at 13.5% — Prefecture Host Map 2026, and the seasonal movement of foreign share inOnly 6 of 47 Prefectures Peak in Autumn: Japan’s Inbound Share Map.
Three cases for the distance to the target — at +5.8% a year, 2030 lands at 62% of the goal
Everything above rests on a single point estimate: the +16.5% annual growth the target requires. Because the gap against the actual +5.8% is wide, it is worth laying out how much the 2030 landing point swings with the growth rate. The inputs are only the three values already fixed in this article (60.56 million guest nights in 2025, the 130 million 2030 target, and 781,974 regional rooms); no new assumptions are introduced.
| Case | CAGR | 2030 guest nights | Per room | Share of target reached | Basis |
|---|---|---|---|---|---|
| Pessimistic | +5.8% | 80.28 million guest nights | 102.7 guest nights | 62% | The actual 2019→2025 CAGR simply continues through 2030 |
| Middle | +11.2% | 102.97 million guest nights | 131.7 guest nights | 79% | Placed exactly midway between the actual CAGR and the rate the plan requires |
| Optimistic | +16.5% | 130 million guest nights | 166.2 guest nights | 100% | The plan target of 130 million guest nights is reached exactly |
Source: JTA Overnight Travel Statistics Survey trend workbook, JTA Basic Plan for Promoting a Tourism-Oriented Country (5th), and MetroEngines Research; compiled by the HotelBank Editorial Team (N=27,249 facilities, 1,266,986 rooms)
If the achieved CAGR merely continues, 2030 comes to 80.28 million guest nights — 62% of the target. Put the other way, the 49.72 million guest-night shortfall is the volume that policy and visitor-attraction investment have to add. In every case, however, per-room density falls short of the 246.3 guest nights the metropolitan areas record today.Wherever the growth rate is set, what binds first is not the volume of stock — that conclusion of this article does not change.
It is worth putting a range around the occupancy effect as well. The body of the article treated the additional 69.44 million guest nights at 1.6 guests per room as roughly +15.2pt of annual occupancy. Extending the same calculation across cases and per-room party sizes gives the following.
| Guests per room | Pessimistic +5.8% | Middle +11.2% | Optimistic +16.5% |
|---|---|---|---|
| 1.4 guests | +4.9pt | +10.6pt | +17.4pt |
| 1.5 guests | +4.6pt | +9.9pt | +16.2pt |
| 1.6 guests | +4.3pt | +9.3pt | +15.2pt |
| 1.8 guests | +3.8pt | +8.3pt | +13.5pt |
| 2.0 guests | +3.5pt | +7.4pt | +12.2pt |
Source: JTA Overnight Travel Statistics Survey trend workbook and MetroEngines Research; compiled by the HotelBank Editorial Team (N=27,249 facilities, 1,266,986 rooms)
The optimistic case at 1.6 guests per room gives +15.2pt. Added simply to regional Japan’s current occupancy of 52.8% (January-May 2026 average), that is 68.0% — essentially level with the 68.8% the metropolitan areas record today (January-May 2026 average). The pessimistic case gives +4.3pt, stopping at 57.1%.Only when the target is met does regional occupancy reach where urban Japan is today — and that distance is the starting point for capacity planning.
Summary — the upside sits in the lower left of the stock chart
Lining up the numbers in this article, the picture of regional inbound looks like this.
- The regional share was 32.68% in May 2026, +1.91pt year on year. It has risen for four consecutive years, but by less than in 2025 — the phase is cruising.
- The 5th Basic Plan’s target of 130 million guest nights is 2.15x the 2025 level and requires +16.5% annual growth to 2030 — an ambitious level well above the +5.8% actually achieved from 2019 to 2025.
- Capacity is not tight. Regional Japan holds 61.7% of national rooms and takes 62.6% of Japanese guest nights, but only 33.7% of foreign ones. Even at the target, density of 166.2 guest nights/room falls short of the 246.3 the metropolitan areas record today.
- The skew inside regional Japan is large. Hokkaido, Yamanashi, Fukuoka and Okinawa take 55.6% of regional guest nights on 24.5% of the rooms, while the bottom 12 prefectures hold 22.5% of the rooms for 5.2% of the guest nights.
- The absolute volume of headroom sits in prefectures with large room stock and low density — Shizuoka, Nagano, Niigata, Miyagi, Fukushima, Tochigi, Gunma, Mie, Kagoshima and the like.
For municipalities and DMOs, the +16.5% a year in the target is a level that “doing what the metros do” will not reach. That the prefectures getting there share new international routes, charters and wide-area touring design is what the recent momentum in Ibaraki, Ehime, Kochi, Fukushima and Tottori shows. A single route or sea link can move a prefecture’s share precisely because the base is small — which also means the elasticity per unit of investment is larger than in the metropolitan areas.
For lodging operators, the practical planning figure is not “inbound x2.15” but “regional total guest nights up about 1.25x over five years, worth roughly +13pt of annual occupancy.” That is a scale absorbable within existing stock, and it reads as a phase in which reception-side work — multilingual service, payments, referral paths — pays off before new investment does. For investors, prefectures with thick room stock and low density remain the area with the greatest leverage per unit when demand does arrive.
Methodology and sources
Foreign guest nights, total guest nights and occupancy rates were aggregated directly by prefecture and month from the trend workbook of the JTA Overnight Travel Statistics Survey. Data from January 2026 onward use the new series (sheets 1-1, 3-1, 4-1); data through December 2025 use the old series (sheets old 1-2, old 3-2). The 2025 annual figures are final; January-May 2026 are preliminary. The split between metropolitan and regional areas follows the definition in the Basic Plan for Promoting a Tourism-Oriented Country: 8 prefectures versus the other 39.
Room and facility counts are facilities with confirmed operation within the scope tracked by MetroEngines Research (27,249 facilities, 1,266,986 rooms), aggregated by prefecture; this is not a complete census. Ryokan, minshuku and simple lodgings that cannot be confirmed as selling on OTAs and other booking sites are excluded, so the scope differs from the JTA survey population. “Annual foreign guest nights per room” is a ratio whose numerator (JTA) and denominator (our aggregation) come from different populations; it is intended for relative comparison across prefectures. Please interpret the absolute values with that in mind.
Note on statistical continuity:From the January 2026 survey the JTA changed the stratification basis of its sample design from “number of employees” to “number of rooms,” and notes that “year-on-year comparisons and differences may include the effect of this revision.” This article is built on composition ratios (shares) and relative comparison across prefectures rather than level comparison against the prior year, but where growth rates in guest nights themselves are cited, please read them on the premise that this break exists.
Frequently asked questions
Which areas does the JTA mean by “regional areas”?
All 39 prefectures left after excluding the 8 that make up the three major metropolitan areas (Saitama, Chiba, Tokyo, Kanagawa, Aichi, Kyoto, Osaka and Hyogo). This is exactly the definition in the Basic Plan for Promoting a Tourism-Oriented Country, so major destinations such as Hokkaido, Okinawa and Fukuoka are also counted as regional in the statistics. It does not mean depopulated districts or places outside prefectural capitals.
What is the regional share of inbound guest nights right now?
32.68% as of May 2026, up 1.91pt from the same month a year earlier and rising for a fourth consecutive year. The 2025 annual final figure was 33.66%, a ratio of 1 to 1.97 against the three major metropolitan areas. The size of the gain has eased, though, from the +3-4pt range in 2024→2025 to +1-2pt in 2025→2026, which reads as cruising rather than accelerating.
How far is it to the 130 million guest-night target for 2030?
Regional Japan recorded 60.56 million guest nights in 2025, so the target is 2.15x the current level and requires an additional 69.44 million. Reaching it in five years needs +16.5% average annual growth, roughly three times the +5.8% actually achieved from 2019 to 2025. If the achieved CAGR simply continues, 2030 lands at 80.28 million guest nights — 62% of the target.
Can regional room stock absorb that demand?
In volume terms, yes, with room to spare. The 39 regional prefectures hold 781,974 rooms, 61.7% of the national stock. Even at the 130 million guest-night target, that is 166.2 annual guest nights per room — two-thirds of the 246.3 the three major metropolitan areas record today. On occupancy, regional Japan is at 52.8% (January-May 2026 average) against 68.8% for the metropolitan areas (same period), a 16.0pt gap. The constraint is not the volume of rooms but how demand reaches them.
Which regional prefectures have the most headroom?
Those with large room stock but low foreign guest nights per room. Shizuoka (47,250 rooms, 47.2 guest nights/room), Nagano (45,283 rooms, 55.4), Niigata (28,039 rooms, 30.3), Miyagi (27,547 rooms, 36.5) and Fukushima (24,673 rooms, 14.6) are the representative cases. At the other end, Hokkaido, Yamanashi, Fukuoka and Okinawa take 55.6% of regional foreign guest nights on 24.5% of the rooms and already sit in the high-density tier.
What should I watch when comparing 2026 figures with the prior year?
From the January 2026 survey the JTA changed the stratification basis of its sample design from “number of employees” to “number of rooms,” and the agency itself notes that year-on-year comparisons and differences may include the effect of the revision. Because level comparisons of guest-night counts can contain a break, this article is built on shares — composition ratios within the same survey and the same month.
Related reading
- US Now Tops Japan Inbound at 13.5% — Prefecture Host Map 2026
- Inbound Stay Length Varies 2.0x: Tokyo 2.32 vs Yamanashi 1.16 Nights
- Winter Schedule Oct 25: Do 20 Regional Airports Have Enough Rooms?
- Only 6 of 47 Prefectures Peak in Autumn: Japan’s Inbound Share Map
- June 2026 Occupancy 56.2%: Guest-Nights per Room in 47 Prefectures
- Gifu 8.3% vs Wakayama 29.7%: Overnight Stay Rates in 20 Prefectures
- City Hotels: 45.9% of Guest Nights Are Foreign — Ryokan +3.7%
- Inbound Share vs Weekday Gap: −0.13 Across Japan’s 47 Prefectures
References and sources
■ Data sources
Foreign guest nights, total guest nights and occupancy rates were aggregated directly by prefecture and month from the trend workbook of the JTA Overnight Travel Statistics Survey (statistics table no. 002002831). Data from January 2026 onward use the new series (sheets 1-1 / 3-1 / 4-1); data through December 2025 use the old series (sheets old 1-2 / old 3-2). 2025 figures are annual finals; January-May 2026 are preliminary. Room and facility counts were aggregated by prefecture from facilities with confirmed operation tracked by MetroEngines Research.
■ Calculation assumptions
Regional areas follow the definition in the Basic Plan for Promoting a Tourism-Oriented Country: the 39 prefectures other than the 8 metropolitan ones. Occupancy is the simple average of January-May 2026 by prefecture, weighted by room count for the regional and metropolitan aggregates. The CAGR required to reach the 130 million guest-night target is 5-year compounding from the 2025 result. The occupancy uplift is calculated as “additional guest nights ÷ guests per room ÷ room count ÷ 365 days,” the same formula that yields the +15.2pt at 1.6 guests per room cited in the body. The three-case projection uses only the three values fixed in the body (2025 result, 2030 target, regional room count) and introduces no new assumptions.
■ Limitations and caveats
“Annual foreign guest nights per room” is a ratio whose numerator (JTA) and denominator (our aggregation) come from different populations; it is intended for relative comparison across prefectures. Our aggregation is limited to facilities that can be confirmed as selling on booking sites and is not a complete census, so absolute values should be interpreted with care. The JTA changed the stratification basis of its sample design from the January 2026 survey, so level comparisons of guest nights against the prior year can contain a break. All occupancy discussion here is on an annual or period-average basis, while actual demand concentrates at seasonal and day-of-week peaks; tightness at the peaks is not visible at prefecture-level macro resolution.
■ Government statistics and policy documents
- JTA “Overnight Travel Statistics Survey”(trend workbook, statistics table no. 002002831, sheets 1-1 / 3-1 / 4-1 / old 1-2 / old 3-2)
- JTA “Cabinet approves the Basic Plan for Promoting a Tourism-Oriented Country” (27 March 2026)
- Basic Plan for Promoting a Tourism-Oriented Country (summary) PDF — Goal 6, “130 million guest nights in regional areas”
- JTA “Overnight Travel Statistics Survey (April 2026 second preliminary, May 2026 first preliminary, and 2025 annual final)”
- Ibaraki Prefecture, “Ibaraki Airport Future Vision (draft)” (Ibaraki Airport review committee)
■ Press coverage and industry reports
- Nikkei, “Regional inbound guest nights ‘on par with the cities’ — JTA target funded by a higher departure tax”
- Travel Voice, “Government and ruling parties to raise the departure tax to ¥3,000, written into the FY2026 tax reform outline”
- Nikkei, “Ibaraki Airport FY2025 passengers up 7.5% to 830,000, a record high”
- LOGI-BIZ online, “MLIT lifts restrictions on international service into Ibaraki Airport” (7 August 2025)
- Yamatogokoro, “March 2026 inbound guest nights down 4% to 14.28 million; the three major metropolitan areas fall while Tottori, Ibaraki and other regions grow”
- Yamatogokoro, “Foreign guest nights in 2024 up 40% to 160 million; Ishikawa and Ehime more than double — why the regions surged”
■ Proprietary data
- MetroEngines Research — rooms and facilities by prefecture (27,249 facilities with confirmed operation, 1,266,986 rooms, as of the survey date)