

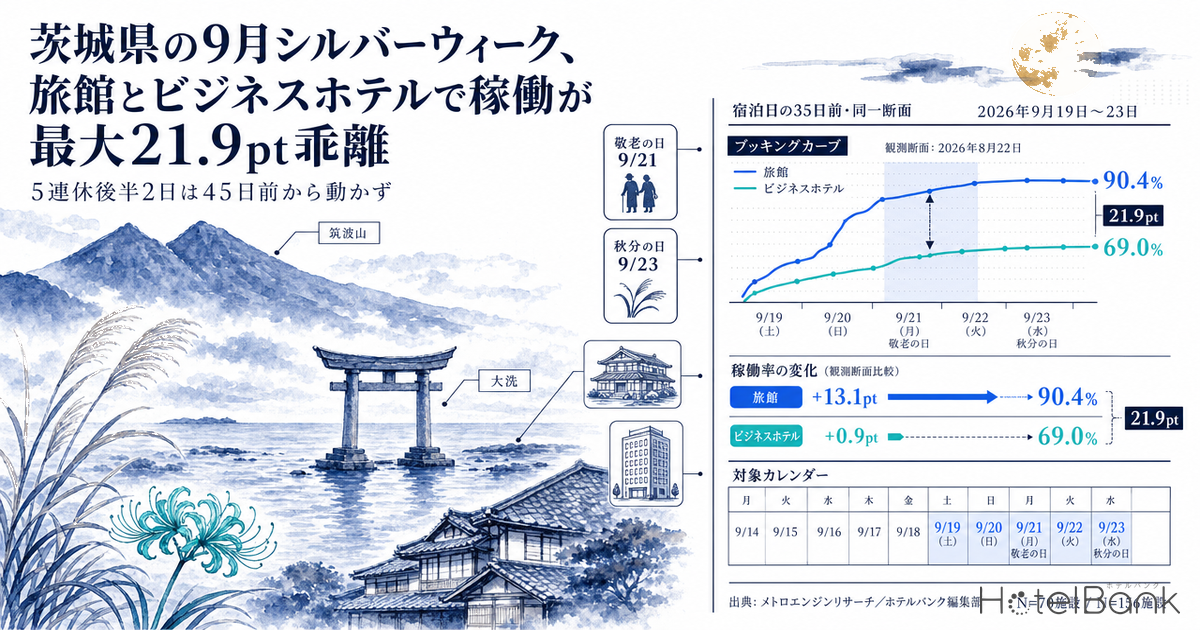
For the five-day holiday running Saturday, September 19 through Wednesday, September 23, 2026, lining up booking progress for Ibaraki’s business hotels and ryokan at the same observation point shows the two property types moving in opposite directions. At 35 days out from the stay date, estimated occupancy for ryokan reaches 90.4% on Sunday, September 20, the middle day of the break (70 properties observed), while business hotels sit at 69.0% on the same date (156 properties observed). The gap is 21.4 points, and it widens to 21.9 points on Monday, September 21 (Respect for the Aged Day). Yet on Saturday, September 5 — an ordinary weekend in the same month — business hotels are at 65.3% and ryokan at 63.5%, essentially level. Only the holiday pulls the two apart. And over the back half of the break, Tuesday, September 22 and Wednesday, September 23, pickup from T-45 to the latest reading is just +2.0 and +0.9 points for business hotels and +3.5 and +1.7 points for ryokan — barely any movement at all.
About the data in this article/Scope: business hotels in Ibaraki Prefecture (160 listed properties, 13,647 rooms in total) and ryokan (72–74 listed properties, roughly 1,500 rooms in total). N = the number of observed properties is shown with each chart and table. The price metric used here is estimated settled ADR (the transacted price level estimated from OTA and other sales data, tax-excluded equivalent); occupancy is an estimate based on OTA-listed inventory. Both definitions appear at the end of the article. Data as of August 22, 2026.
- — At the common reading 35 days before the stay date, ryokan estimated OCC hits 90.4% on September 20, the middle day of the break, against 69.0% for business hotels. The gap widens to 21.9 points on September 21.
- — On the ordinary weekend of September 5, business hotels sit at 65.3% and ryokan at 63.5% — essentially level. Only the holiday separates the two types; on ordinary weekends they compete for the same guests.
- — On the back half, September 22 and 23, pickup from T-45 to the latest reading is only +0.9 to +3.5 points. Unlike the first three days (+4.9 to +13.1 points), no inflow is happening inside 45 days.
- — Applying the measured remaining-inventory sell-through rate (June–July 2026, N=61 stay dates), even September 23 lands at 81.1% for business hotels and 84.0% for ryokan in the median case. The back two days are not “dates that stay empty” but dates that depend on the final 30 days.
- — In the May–July 2026 actuals, Tuesday through Thursday hold business hotels at 88–90%, but when those weekdays fall on holidays they drop to 55–64%. Days need to be classified by the presence or absence of corporate demand, not by day of week.
First, the calendar — September 2026 is a five-day break, not a three-day weekend
Before getting into the analysis, it is worth settling the calendar. The Cabinet Office’s list of national holidays shows that in September 2026, Monday the 21st is Respect for the Aged Day and Wednesday the 23rd is Autumnal Equinox Day, with Tuesday the 22nd falling between them as a National Holiday under the Public Holidays Act. It is the first time since 2015 — 11 years — that the Act has produced such a day in September (press coverage following the National Astronomical Observatory of Japan’s calendar announcement described it as a four-day break beginning Sunday the 20th). Counting Saturday the 19th, the stretch from Saturday, September 19 through Wednesday, September 23 becomes five consecutive days off. To match the way inventory is actually sold, this article treats September 19–23 as a single five-day holiday.
In a market like Ibaraki, where corporate-demand clusters such as Mito, Tsukuba and Hitachi sit in the same prefecture as leisure destinations such as Oarai, Fukuroda and Mount Tsukuba, how these five days should be handled differs sharply by property type. For business hotels, three weekdays (Monday, Tuesday and Wednesday) are replaced wholesale by holidays; for ryokan, it is one of the strongest demand windows of the year. What follows breaks the five days out date by date rather than treating them as one block. For September in Ibaraki, Ibaraki September Booking Curves: Peak Sep 19-21, which compared booking curves by property type at the T-45 reading, also found demand concentrated in the first half of the break.
One caveat: a prefecture-level aggregate cannot isolate the contribution of any specific event or festival. This article does not attribute demand to individual events; it deals only with the demand shape observed on each date.
September day by day — level on ordinary weekends, 21.9pt apart only during the holiday
First, the basis for comparison. Lining up occupancy when each stay date has a different number of days remaining will naturally make later dates look less filled; that is not a comparison of demand shape. The chart below therefore takes every stay date from September 5 to September 25 and extracts only the reading at a single common lead time — 35 days before the stay date. Every point is observed under the same condition.
Source: compiled by the HotelBank Editorial Team from MetroEngines Research/Observed properties: business hotels 137–157, ryokan 50–73
The shape is clear. Through the ordinary weeks of early September, business hotels run slightly higher Tuesday to Thursday and ease off on Friday and Saturday, while ryokan show only modest peaks on Saturday and Tuesday–Wednesday; the difference between them stays within a few points. On Saturday, September 5, business hotels are at 65.3% against 63.5% for ryokan — business hotels are actually 1.8 points higher. On Saturday, September 12 it is 61.0% versus 64.4%, a gap of just 3.4 points. On an ordinary Ibaraki weekend, occupancy sits at roughly the same level regardless of property type.
From September 19, that relationship breaks down entirely. Ryokan jump to 80.7% on Saturday the 19th, 90.4% on Sunday the 20th and 85.8% on Monday the 21st (Respect for the Aged Day) — 17 to 27 points above the 63.5% of the ordinary weekend of September 5. Business hotels also rise, to 70.8% on the 19th, but then drift down to 69.0% on the 20th and 63.9% on the 21st as the break progresses. The gap between the two therefore reaches 21.4 points on the 20th and 21.9 points on the 21st.
The peak then collapses quickly over the back half. On Tuesday the 22nd (National Holiday) ryokan are at 69.0% and business hotels at 59.9%; on Wednesday the 23rd (Autumnal Equinox Day) it is 60.2% and 55.3%. Ryokan fall 30.2 points in just three days, from 90.4% on the middle day to 60.2% on the 23rd. Business hotels drop 15.5 points, from 70.8% on the 19th to 55.3% on the 23rd. It may be a five-day break, but demand is effectively riding on the first three days.
What happens after the break is equally contrasting. On Thursday, September 24 both are low — business hotels 55.9%, ryokan 59.2% — but by Friday, September 25 business hotels recover to 65.1% while ryokan slip to 56.1%, the only 9-point reversal in the whole period. The day corporate demand returns is the same day leisure demand drains away: that is what “opposite phases inside one prefecture” looks like in practice. For reference, the lowest September reading for business hotels is 48.1% on Monday the 14th and for ryokan 56.1% on Friday the 25th — the two troughs are 11 days apart. This pattern of a holiday prising the property types apart is not unique to Ibaraki: Hokkaido Silver Week: Sep 20 Peaks, Only Business Dips shows the same asymmetry, with only business hotels falling on September 21.
Fixed-point comparison across the five holiday days — T-45, T-35 and the latest reading
Next, progress on each of the five holiday days at three points: 45 days out, 35 days out and the latest reading. The latest reading shares a common observation date (August 21, 2026), so later stay dates have more days remaining (September 19 has 29 days left, September 23 has 33). That has to be discounted when reading the table, but combined with the fixed T-45 and T-35 readings it is enough to show when demand arrived on each date.
| Stay date | Property type | T-45 | T-35 | Latest | T-45 → latest | Sold-out rate (latest) | N (latest) |
|---|---|---|---|---|---|---|---|
| Sep 19 (Sat) | Business | 68.4% | 70.8% | 73.3% | +4.9pt | 30.6% | 158 |
| Sep 19 (Sat) | Ryokan | 79.3% | 80.7% | 84.3% | +5.0pt | 50.0% | 71 |
| Sep 20 (Sun) | Business | 57.9% | 69.0% | 71.0% | +13.1pt | 26.9% | 157 |
| Sep 20 (Sun) | Ryokan | 85.8% | 90.4% | 93.6% | +7.8pt | 72.2% | 71 |
| Sep 21 (Mon, Respect for the Aged Day) | Business | 53.9% | 63.9% | 65.3% | +11.4pt | 19.4% | 157 |
| Sep 21 (Mon, Respect for the Aged Day) | Ryokan | 81.4% | 85.8% | 88.4% | +7.0pt | 54.2% | 71 |
| Sep 22 (Tue, National Holiday) | Business | 58.7% | 59.9% | 60.7% | +2.0pt | 11.9% | 157 |
| Sep 22 (Tue, National Holiday) | Ryokan | 67.2% | 69.0% | 70.7% | +3.5pt | 32.4% | 71 |
| Sep 23 (Wed, Autumnal Equinox Day) | Business | 55.0% | 55.3% | 55.9% | +0.9pt | 5.0% | 157 |
| Sep 23 (Wed, Autumnal Equinox Day) | Ryokan | 59.5% | 60.2% | 61.2% | +1.7pt | 27.8% | 72 |
Source: compiled by the HotelBank Editorial Team from MetroEngines Research/Latest reading observed August 21, 2026 (29–33 days remaining)
The striking column is the third from the right — pickup from T-45 to the latest reading. Over the first three days (the 19th to the 21st), business hotels add +4.9, +13.1 and +11.4 points and ryokan +5.0, +7.8 and +7.0 points: clear accumulation. Business hotels on the 20th and 21st are the clearest case, starting from 57.9% and 53.9% at T-45 — ordinary-weekend levels — and being pushed to around 70% by double-digit pickup. For the first half of the break, bookings arriving inside 45 days are plainly doing the work.
The back two days (the 22nd and 23rd), by contrast, add only +2.0 and +0.9 points for business hotels and +3.5 and +1.7 points for ryokan. The 23rd is the extreme case: already at 55.0% for business hotels and 59.5% for ryokan at T-45, it sits in almost the same place today, at 55.9% and 61.2%. The natural reading is not that demand has yet to arrive on these two days, but that inflow inside 45 days is simply not happening the way it is over the first half. For how the back half of the break is behaving nationally, Silver Week 2026 Back Half at T-47, which asks the same question at a T-47 reading, is a useful comparison.
Source: compiled by the HotelBank Editorial Team from MetroEngines Research/Based on observations from 45 days before the stay date to the latest reading
The booking curves make the difference sharper still. On the middle day, September 20, ryokan build without interruption from 85.8% to 93.6%, and business hotels step up between 38 and 37 days out before settling around 70%. On September 23, both property types are essentially flat from T-45 onward, ryokan holding in the 58–61% range and business hotels in the 54–56% range. Two days inside the same holiday, and the slope of the curve is completely different.
Source: compiled by the HotelBank Editorial Team from MetroEngines Research/Based on observations from 45 days before the stay date to the latest reading
Sold-out rate and day-of-week structure — holidays remove the corporate-demand floor
Worth reading alongside estimated occupancy is the sold-out property rate — the estimated share of properties for which no bookable inventory could be found on OTAs and similar channels at the time of observation. At the latest reading, the ryokan sold-out rate reaches 72.2% on September 20 (71 properties observed), followed by 54.2% on the 21st and 50.0% on the 19th. For ryokan over the first half of the break, more than half the properties in the prefecture show no available inventory. The 23rd, by contrast, falls to 27.8% and the 22nd to 32.4%.
For business hotels the sold-out rate declines almost monotonically as the break progresses: 30.6% on the 19th, 26.9% on the 20th, 19.4% on the 21st, 11.9% on the 22nd and 5.0% on the 23rd. That 5.0% is barely different from September’s ordinary-weekday troughs at the same T-35 reading — 2.5% on Monday the 14th and 4.4% on Thursday the 10th. Public holiday or not, a Wednesday stripped of corporate demand looks exactly like an ordinary weekday trough.
As a check on that reading, here are the actuals from months already elapsed. Averaging daily results for the three months from May to July 2026 (92 days) by day of week gives the following.
| Day of week | Business hotels, est. OCC | Ryokan, est. OCC | Gap (ryokan − business) | Days |
|---|---|---|---|---|
| Mon | 85.5% | 85.5% | 0.0pt | 13 |
| Tue | 89.0% | 86.0% | −3.0pt | 13 |
| Wed | 88.8% | 85.3% | −3.5pt | 13 |
| Thu | 89.8% | 84.0% | −5.8pt | 13 |
| Fri | 84.9% | 86.2% | +1.3pt | 14 |
| Sat | 88.6% | 90.9% | +2.3pt | 13 |
| Sun | 79.1% | 88.3% | +9.2pt | 13 |
Source: compiled by the HotelBank Editorial Team from MetroEngines Research/Actuals for elapsed months May–July 2026 (92 days). Observed properties: business hotels 136–163, ryokan 46–72
Business hotels peak Tuesday to Thursday at 88–90%, with Sunday the only trough at 79.1% — a 10.7-point spread that leaves Sunday conspicuously the weakest of the seven days. Ryokan run 84–86% Monday to Thursday and build a gentle weekend peak at 90.9% on Saturday and 88.3% on Sunday. The Sunday gap between the two property types is 9.2 points, the widest of any day of the week.
Apply that structure to the five-day break and Monday the 21st, Tuesday the 22nd and Wednesday the 23rd — days of the week that normally hold business-hotel occupancy up — lose their corporate-demand floor because they are holidays. In the actuals, Monday to Wednesday deliver 85–89% for business hotels; during the break, the same weekdays sit at 63.9%, 59.9% and 55.3% at T-35. Demand is being set by whether the day is a holiday, not by the day of the week. On the ryokan side too, the 22nd and 23rd — past Sunday — no longer carry weekend-type demand and fall to 69.0% and 60.2%.
Reference: monthly estimated settled ADR (year-on-year for confirmed months)
Daily price levels are outside the scope of this article, but monthly estimated settled ADR is worth reviewing as an input to pricing decisions. The comparison below is confirmed against confirmed — both the prior year and the current year on a confirmed basis.
| Month | Business 2025 | Business 2026 | YoY | Ryokan 2025 | Ryokan 2026 | YoY |
|---|---|---|---|---|---|---|
| January | ¥6,186 | ¥6,665 | +7.7% | ¥8,054 | ¥9,538 | +18.4% |
| February | ¥6,292 | ¥6,656 | +5.8% | ¥6,651 | ¥8,680 | +30.5% |
| March | ¥6,311 | ¥6,700 | +6.2% | ¥6,208 | ¥8,617 | +38.8% |
| April | ¥6,633 | ¥6,662 | +0.4% | ¥6,960 | ¥7,908 | +13.6% |
| May | ¥6,886 | ¥7,076 | +2.8% | ¥8,570 | ¥8,608 | +0.4% |
| June | ¥6,410 | ¥6,660 | +3.9% | ¥6,611 | ¥6,566 | −0.7% |
| July | ¥6,506 | ¥6,501 | −0.1% | ¥7,598 | ¥6,913 | −9.0% |
Source: compiled by the HotelBank Editorial Team from MetroEngines Research/N = business hotels 177–187, ryokan 92–104 (confirmed values)
Business hotels ran +6% to +8% year on year from January to March, then growth slowed from April and returned to flat (−0.1%) in July. On a simple January–July average, ADR moved from ¥6,500 to ¥6,700, up 3.8%. Ryokan swing far more widely: +38.8% in March against −9.0% in July. The January–July average went from ¥7,200 to ¥8,100, up 12.2%.
For September 2026, the figures currently derived from present sales conditions are ¥9,700 for business hotels (N=175) and ¥9,300 for ryokan (N=91). Because these are estimates on a different basis from confirmed values, they are not compared directly with the prior-year confirmed figure; the September year-on-year read should wait for month-end confirmation.
Landing scenarios and sensitivity — how far the latest reading predicts final occupancy
So far this has been a comparison between observation points, but in practice the question is where the current pace lands. To answer it, we measured, across the 61 stay dates from June 1 to July 31, 2026 that have already passed, what share of the inventory still available 30 days out was sold by the day before the stay (the remaining-inventory sell-through rate), and applied that distribution to the latest reading for the five-day break. Simply adding pickup points would push occupancy past 100%, so the calculation works on the share of remaining rooms sold.
The measured sell-through rates were 50.3% pessimistic (first quartile), 57.1% median and 67.1% optimistic (third quartile) for business hotels, and 53.1%, 58.7% and 63.2% for ryokan (both N=61 stay dates). The table below applies these to the latest reading (observed August 21, 2026, 29–33 days remaining).
| Stay date | Business hotels | Ryokan | ||||||
|---|---|---|---|---|---|---|---|---|
| Latest | Pessimistic | Median | Optimistic | Latest | Pessimistic | Median | Optimistic | |
| Sep 19 (Sat) | 73.3% | 86.7% | 88.5% | 91.2% | 84.3% | 92.6% | 93.5% | 94.2% |
| Sep 20 (Sun) | 71.0% | 85.6% | 87.5% | 90.5% | 93.6% | 97.0% | 97.4% | 97.6% |
| Sep 21 (Mon, Respect for the Aged Day) | 65.3% | 82.7% | 85.1% | 88.6% | 88.4% | 94.6% | 95.2% | 95.7% |
| Sep 22 (Tue, National Holiday) | 60.7% | 80.5% | 83.1% | 87.1% | 70.7% | 86.3% | 87.9% | 89.2% |
| Sep 23 (Wed, Autumnal Equinox Day) | 55.9% | 78.1% | 81.1% | 85.5% | 61.2% | 81.8% | 84.0% | 85.7% |
Source: compiled by the HotelBank Editorial Team from MetroEngines Research/Latest reading observed August 21, 2026. Sell-through rates are the measured distribution across 61 stay dates from June 1 to July 31, 2026 (first quartile, median, third quartile)
Two things follow. First, the back two days will not simply finish empty. September 23 sits low at the latest reading, at 55.9% and 61.2%, but the median scenario builds to 81.1% for business hotels and 84.0% for ryokan. The fact established in the previous sections, that these dates have not moved since T-45, is an observation about the timing of inflow, not about the absolute volume of demand. The correct reading is that, unlike the first three days, the back two depend structurally on the final 30 days.
Second, the spread between scenarios varies sharply by date. Ryokan on September 20 range only from 97.0% pessimistic to 97.6% optimistic, a band of 0.6 points, while business hotels on September 23 span 78.1% to 85.5%, a band of 7.4 points. Dates that are already full have essentially fixed outcomes; the more rooms remain, the more the result depends on how the final stretch is sold. The room to act and see an effect is largest precisely on the slow-moving dates.
So that you can plug in your own numbers, the grid below shows landing occupancy on two axes: estimated OCC at the latest reading and the remaining-inventory sell-through rate. The cell where your current position (vertical) meets your own historical late-stage sell-through (horizontal) is the current benchmark for where you land.
| Latest OCC \ Sell-through | 30% | 45% | 60% | 70% | 85% |
|---|---|---|---|---|---|
| 55% | 68.5% | 75.2% | 82.0% | 86.5% | 93.2% |
| 65% | 75.5% | 80.8% | 86.0% | 89.5% | 94.8% |
| 75% | 82.5% | 86.2% | 90.0% | 92.5% | 96.2% |
| 85% | 89.5% | 91.8% | 94.0% | 95.5% | 97.8% |
| 95% | 96.5% | 97.2% | 98.0% | 98.5% | 99.2% |
Source: compiled by the HotelBank Editorial Team/Landing estimated OCC = latest OCC + remaining-inventory sell-through × (100 − latest OCC). Measured range: business hotels 30–69%, ryokan 48–70% (first to ninth decile)
The key to reading the grid is that the higher the latest OCC, the less the landing figure moves as sell-through varies. The 85% row runs from 89.5% at 30% sell-through to 97.8% at 85%, a spread of only 8.3 points. The 55% row spans 68.5% to 93.2%, a spread of 24.7 points. Dates like September 22 and 23, currently in the 55–70% range, sit in the upper rows of this grid, which means late-stage inventory and pricing decisions still have meaningful room to shift where they land.
* These scenarios are projections for a prefecture- and property-type-level market aggregate and do not guarantee the outcome for any individual property. The sell-through distribution is measured from June–July 2026, and there is no guarantee that September holiday demand follows the same distribution. On dates already near 90% at the latest reading — ryokan on September 20 and 21, for example — few rooms remain, so variation in sell-through has correspondingly less effect on the final figure.
For revenue managers running business hotels and ryokan in Ibaraki — implications and an action plan
(1) Are you designing the five-day break as a single inventory unit? At the common T-35 reading, ryokan go from 90.4% on September 20 to 60.2% on the 23rd, and business hotels from 70.8% on the 19th to 55.3% on the 23rd — falls of 30.2 and 15.5 points inside the same holiday. Treating the first three days and the back two as different in both demand depth and reason for travel is closer to reality. If September 19–23 currently carry the same rate structure and the same selling conditions on your calendar, that is the first thing to break apart.
(2) The back two days are not “still to come” — they have not moved since T-45. Pickup from T-45 to the latest reading is +4.9 to +13.1 points for business hotels and +5.0 to +7.8 points for ryokan over the first three days, but only +2.0 and +0.9 points for business hotels and +3.5 and +1.7 points for ryokan on the 22nd and 23rd. If the market as a whole has this slope, your own pace on the same dates is likely to have the same shape. An inventory plan that assumes waiting until the last moment is worth revisiting for these two days.
(3) Whether the neighbouring property type is a competitor changes between ordinary weekends and holidays. On Saturday, September 5 business hotels and ryokan sit at much the same level, 65.3% and 63.5%, but on September 20 and 21 they are 21.4 and 21.9 points apart. On ordinary weekends the two types compete for the same guests across the category line, whereas first-half holiday demand for ryokan barely spills over to business hotels. On Friday, September 25 the order reverses, 65.1% against 56.1%. If your comp set is fixed for the whole year, the holiday period needs a different view.
(4) Classify days by whether corporate demand disappears, not by whether they are public holidays. In the May–July actuals, business hotels ran 88–90% Tuesday to Thursday, with Sunday the single trough at 79.1%. During the five-day break, however, Monday, Tuesday and Wednesday sit at 63.9%, 59.9% and 55.3% at T-35. Occupancy is set by holiday status, not by day of week. The 5.0% business-hotel sold-out rate on September 23 is at much the same level as the ordinary-weekday troughs (2.5% on September 14, 4.4% on September 10).
| Time frame | Action | Decision trigger | Objective |
|---|---|---|---|
| Today–this week | Split September 19–23 into two blocks — the first three days and the back two — and audit the inventory and rate calendar accordingly | If your pace on September 22 and 23 remains below the market’s T-35 reading (business 59.9% and 55.3%; ryokan 69.0% and 60.2%) | Make it possible to treat trough days as an independent selling unit |
| Today–this week | Check whether minimum-length-of-stay restrictions can be limited to the first three days | If your pickup since T-45 on September 22 and 23 is running flat as it is in the market (business +0.9 to +2.0pt; ryokan +1.7 to +3.5pt) | Avoid losing single-night demand on the back two days |
| Within two weeks | Release held-back inventory and offline allocations for September 22 and 23 in stages | If your September 23 pace trails your September 20 pace by roughly the market’s margin (about 30pt for ryokan, about 15pt for business hotels) | Increase sellable rooms on trough days |
| Within two weeks | Review the applicable dates for corporate contract rates over September 21–23 | If September 21–23, all holidays, are still held as corporate allocation and going unsold (the market business-hotel sold-out rate is 5.0% on September 23) | Redirect allocation on days without corporate demand to general demand |
| Ahead of the post-holiday week | Review the selling plan for Thursday, September 24 and Friday, September 25 separately, in line with property-type characteristics | The market reverses on September 25 (business 65.1%, ryokan 56.1%), so check whether your September 25 pace is running ahead of September 24 | Capture the difference in how quickly demand recovers after the break |
| Ahead of next month | Compare your own price band against the monthly estimated settled ADR range and revisit the pricing calendar | If your level remains well away from the market’s confirmed values (July 2026: business ¥6,501, ryokan ¥6,913) | Improve pricing accuracy on ordinary, non-holiday dates |
None of these guarantee a result; they are presented as options to weigh against your own booking position and contract terms.
Summary — three yardsticks to take away
Yardstick 1: split a holiday by slope, not by length. If pickup from T-45 to the latest reading is in double digits, demand is flowing in; if it is 1 to 3 points, inflow has stopped. In Ibaraki’s five-day break, the first three days and the back two divide cleanly on that test. It is worth splitting your own calendar the same way — by pickup, rather than lumping the holiday together by number of days.
Yardstick 2: measure the holiday effect as a difference from ordinary weekends. The two ordinary weekend dates (September 5 and 12) average 64.0% for ryokan and 63.2% for business hotels. Against that baseline, the first three holiday days add +16.7 to +26.4 points for ryokan but only +0.7 to +7.6 points for business hotels. Judging how much the holiday actually benefits your property type is less error-prone measured as a difference from ordinary weekends than as an absolute level.
Yardstick 3: classify days by the presence or absence of corporate demand, not by day of week. On an actuals basis, Tuesday to Thursday hold business hotels at 88–90%, but when those weekdays become holidays they fall to 55–64%. Overlaying a public-holiday calendar directly onto a day-of-week table leads to misreadings. Re-flagging days by holiday status is the shortest route to better forecast accuracy in any month containing a long break.
About the data
| Item | Detail |
|---|---|
| Definition of estimated OCC | Occupancy on an OTA-listed-inventory basis = 100 − 100 × rooms still listed on OTAs ÷ total rooms. It is an estimate based on how listed inventory is being sold down and is defined differently from actual room occupancy (it reads higher). This article labels it “estimated OCC (OTA-listed-inventory basis)” and states the target month and observation window with each chart and table. |
| Booking curve | Based on observations from 45 days before the stay date to the latest reading. Stay dates covered are September 5–25, 2026; the latest reading was observed on August 21, 2026 (29–33 days remaining depending on the stay date). |
| Sold-out property rate | The estimated share of properties for which no bookable inventory could be confirmed on OTAs and similar channels at the time of observation. |
| Definition of estimated settled ADR | The transacted price level (tax-excluded equivalent) estimated from OTA and other sales data (lowest-plan level × property-type coefficient, ensembled across multiple channels). Past months are confirmed values; the current and future months are estimates based on present sales conditions. Median error of 6.6% when reconciled against published operating results. |
| Breakdown of N | Booking curves: Ibaraki business hotels, 160 listed properties with 13,647 rooms in total (137–158 observed); ryokan, 72–74 listed properties with 1,491–1,544 rooms in total (50–73 observed). Day-of-week actuals: 92 days across May–July 2026, with 136–163 business hotels and 46–72 ryokan observed. Estimated settled ADR: N for confirmed months is 177–187 business hotels and 92–104 ryokan; N for the September 2026 estimate is 175 business hotels and 91 ryokan. |
| Caveats | Because the aggregate is at prefecture level, the contribution of any specific event cannot be isolated. Data as of August 22, 2026. Sales conditions and inventory change daily, so the figures here are a snapshot at the time of retrieval. |
References and sources
■ Data sources
Inventory and price observation data for 160 business hotels (13,647 rooms in total) and 72–74 ryokan (1,491–1,544 rooms in total) listed on OTAs and similar channels in Ibaraki Prefecture (MetroEngines Research; HotelBank Editorial Team research). Booking curves run from 45 days before the stay date to the latest reading (observed August 21, 2026); day-of-week actuals cover 92 days across May–July 2026; monthly estimated settled ADR uses confirmed January–July values for 2025 and 2026. The calendar follows the Cabinet Office’s list of national holidays.
■ Calculation assumptions
The landing scenarios measure the remaining-inventory sell-through rate (= (OCC on the day before − OCC at 30 days out) ÷ (100 − OCC at 30 days out)) across the 61 stay dates from June 1 to July 31, 2026 that have already passed, and apply the first quartile, median and third quartile as the pessimistic, median and optimistic cases to the latest reading. Landing estimated OCC = latest OCC + sell-through rate × (100 − latest OCC). Simply adding pickup points would push occupancy above 100%, so the calculation is expressed as a share of remaining rooms.
■ Limitations and caveats
Estimated OCC is an estimate on an OTA-listed-inventory basis and is defined differently from actual room occupancy (it reads higher). Because the aggregate is at prefecture level, the contribution of any specific event cannot be isolated, and this article does not attribute demand to individual events. The landing scenarios are projections for a market aggregate and do not guarantee the outcome for any individual property; there is no guarantee that the sell-through distribution applies unchanged to September holiday demand. Estimated settled ADR has a median error of 6.6% when reconciled against published operating results. Sales conditions and inventory change daily, so the figures here are a snapshot as of August 22, 2026.
| Source | Referenced for |
|---|---|
| Cabinet Office, “About National Holidays” | September 21, 2026 Respect for the Aged Day; September 22 National Holiday; September 23 Autumnal Equinox Day (holiday list CSV) |
| Nikkei, “Four-day break in September 2026, first in 11 years under the Public Holidays Act — National Astronomical Observatory of Japan” | Report that a National Holiday under the Public Holidays Act falls in September 2026 |
| MetroEngines Research; HotelBank Editorial Team research | Booking curves, estimated OCC, sold-out property rate and estimated settled ADR for Ibaraki Prefecture |
Related reading
- Ibaraki Sep Booking Curves: Peak Sep 19-21 at 74.9%, Sep 23 55.7%
- Silver Week 2026 Back Half at T-47: Sep 23 Matches a Normal Wednesday
- Hokkaido Silver Week: Sep 20 Peaks, Ryokan 96.4%, Only Business Dips
- Osaka Sep 2026 Holiday: Demand Peaks First 2 Nights, Sep 23 at 58.0%
- Nagano September: Wed 58.7% vs Holiday Sat 93.0%, 34pt Gap Holds
- Booking Curves Across 47 Prefectures: +4.1pt Median Pickup from T-45