

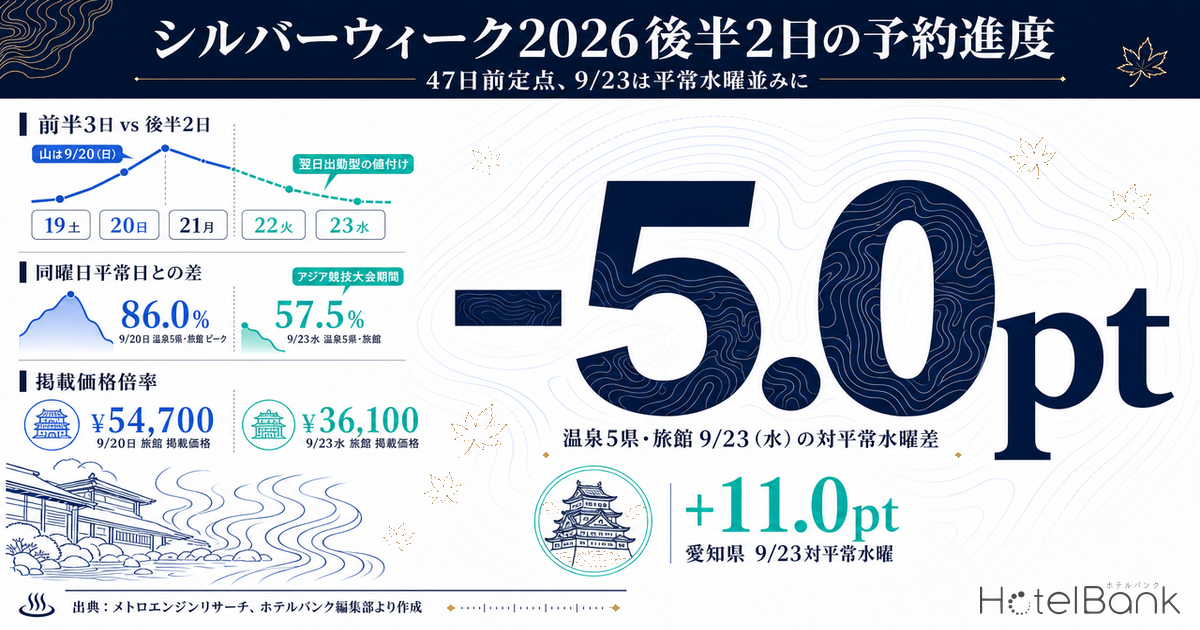
Japan’s Silver Week 2026 runs as a five-day break from Saturday, September 19 through Wednesday, September 23. Respect for the Aged Day on Monday, September 21 and Autumnal Equinox Day on Wednesday, September 23 sandwich Tuesday, September 22, which therefore becomes a “Citizens’ Holiday” — a configuration that has not occurred since 2015, eleven years ago. Because the break stretches to five days, lodging demand splits into two distinct characters: the “first three days” and the “back two days.” This article uses a fixed snapshot taken in early August 2026 (47 days before check-in) to examine how booking progress on the back two days (September 22 and 23) differs from the first three days, across five onsen and resort prefectures, four urban prefectures, and by property type.
Metric Definitions Used in This Article
- OCC (occupancy): the share of sold rooms against the total room count within an area (an estimate based on OTA-listed inventory). It is an estimate derived from how listed inventory is being sold down on OTAs, and differs from a property’s actual overall occupancy. This article refers to it as “estimated occupancy.”
- LT (lead time): the number of days until check-in. LT0 = same day. This article uses two fixed cross-sections, LT47 (47 days out) and LT65 (65 days out).
- Listed price: the average of publicly listed selling prices on OTAs and similar channels (double occupancy, per-room rate, tax included, averaged across all plans from room-only to meal-inclusive). It differs from actual transacted rates. This article does not deal with estimated settled ADR.
- Normal same-weekday baseline: the average of two non-holiday days of the same weekday within the same month (Sat = Sep 5 and Sep 12; Sun = Sep 6 and Sep 13; Mon = Sep 7 and Sep 14; Tue = Sep 8 and Sep 15; Wed = Sep 9 and Sep 16). This is the reference used to separate the holiday effect from the day-of-week effect.
- Data source: MetroEngines Research
- — Ryokan across the five onsen prefectures sit at 81.0% for the first three days but 62.1% for the back two — a gap of 18.9pt, roughly three times the gap seen at urban city hotels (6.4pt).
- — On Tuesday, September 22 all nine areas run above their normal same-weekday baseline (+2.3 to +16.4pt), but on Wednesday, September 23 only Okinawa (+3.2pt) and Aichi (+11.0pt) stay positive.
- — Pricing is built around “back to work tomorrow,” not around “long weekend.” Listed prices at business hotels in the four urban prefectures run 2.27x a normal Sunday on September 20, but only 1.03x on September 23.
- — Aichi’s elevated level is not a holiday effect but the Asian Games (September 19 to October 4, 16 days). At the 65-days-out snapshot it stays high right through the Games and falls to 66.2% on October 7, after they end.
- — Over the 18 days from 65 days out to 47 days out, the back two days at onsen ryokan moved only +1.8pt and +1.6pt — which also makes them the dates with the most room left to move in the remaining 47 days.
Demand across the five days peaks on Sunday and troughs on the final day
Start with daily estimated occupancy at the 47-days-out snapshot, broken out by property type. Ryokan in the five onsen and resort prefectures (Kanagawa, Gunma, Tochigi, Shizuoka, Okinawa) peak at 86.0% on Sunday, September 20, then decline to 66.7% on Tuesday, September 22 and 57.5% on Wednesday, September 23. The spread across the five days reaches 28.5pt. Resort hotels in those same five prefectures run from 84.4% on September 20 down to 68.3% on September 23, a spread of just 16.1pt. City hotels in the four urban prefectures (Tokyo, Osaka, Aichi, Fukuoka) are flatter still, moving from 86.8% on September 19 to 76.9% on September 23 — a range of 9.9pt.
In other words, even within the same five-day break, how sharply the curve peaks differs completely by property type. Ryokan trace a sharp peak with demand concentrated in the middle of the break; urban properties look closer to a trapezoid. That difference is what determines how the back two days fill.
Source: MetroEngines Research; compiled by the HotelBank Editorial Team
Line them up against a normal Tuesday and Wednesday, and the September 23 holiday effect nearly vanishes
Looking only at daily absolute values invites the reading that “the back half is weak” — but Tuesdays and Wednesdays run below weekends even in normal times. To isolate the holiday effect alone, you have to line the dates up against normal days of the same weekday and take the difference. Using the average of two non-holiday days of the same weekday in September as the baseline, the picture changes considerably.
Tuesday, September 22 runs above a normal Tuesday across every property type: +5.0pt for ryokan in the five onsen prefectures, +7.8pt for resort hotels there, and +8.3pt for business hotels in the four urban prefectures. On Wednesday, September 23, however, ryokan in the five onsen prefectures fall 5.0pt below a normal Wednesday. Business hotels in those same five prefectures come in at -1.3pt and urban city hotels at -0.5pt — both at or slightly below a normal Wednesday. The numbers show that having the day off as a holiday and staying overnight that night are two different things.
The only segments that clearly hold their holiday effect through both back-half days are resort hotels in the five onsen prefectures (+1.9pt on September 23) and business hotels in the four urban prefectures (+0.9pt). The former is supported by stay-oriented multi-night demand centered on Okinawa; the latter by business and event travel that pulls post-holiday movement forward.
Source: MetroEngines Research; compiled by the HotelBank Editorial Team
The first-three-days versus back-two-days gap varies nearly threefold by property type
Taking the difference between the first-three-day average (September 19 to 21) and the back-two-day average (September 22 to 23) by property type: ryokan in the five onsen prefectures go from 81.0% to 62.1%, or -18.9pt, while city hotels in the four urban prefectures go from 85.0% to 78.6%, or -6.4pt. The size of the drop differs by roughly a factor of three. Resort hotels, which carry stay-oriented products (-9.7pt), and urban business hotels (-7.1pt) sit in between.
| Area group / property type | Sat 9/19 | Sun 9/20 | Mon 9/21 | Tue 9/22 | Wed 9/23 | First 3 days | Back 2 days | Back − First |
|---|---|---|---|---|---|---|---|---|
| 5 onsen prefectures / ryokan | 74.5% | 86.0% | 82.5% | 66.7% | 57.5% | 81.0% | 62.1% | -18.9pt |
| 5 onsen prefectures / resort hotels | 77.0% | 84.4% | 83.1% | 75.4% | 68.3% | 81.5% | 71.9% | -9.7pt |
| 5 onsen prefectures / business hotels | 76.1% | 78.3% | 75.1% | 70.8% | 63.5% | 76.5% | 67.2% | -9.4pt |
| 4 urban prefectures / city hotels | 86.8% | 85.7% | 82.5% | 80.3% | 76.9% | 85.0% | 78.6% | -6.4pt |
| 4 urban prefectures / business hotels | 78.4% | 78.0% | 72.8% | 72.3% | 66.4% | 76.4% | 69.4% | -7.1pt |
LT47 snapshot (observed August 3–7, 2026). Observed property counts: 5 onsen prefectures — ryokan 981–1,080, resort 477–485, business 768–785; 4 urban prefectures — city 246–254, business 1,842–1,886. Observed property counts for the normal same-weekday baseline range 787–1,104 for ryokan and 247–256 for city hotels.
Source: MetroEngines Research; compiled by the HotelBank Editorial Team
Pricing is built around “back to work tomorrow,” not around the long weekend
Next, compare listed prices against the normal same-weekday baseline. A multiple of 1.00 means “priced the same as a normal day of that weekday”; 1.50 means a 50% premium.
At ryokan in the five onsen prefectures, Sunday, September 20 runs at 1.54x a normal Sunday (¥54,700) and Monday, September 21 at 1.57x. But Tuesday, September 22 drops to 1.45x and Wednesday, September 23 to 1.11x (¥36,100). Business hotels in the four urban prefectures are more extreme still: 2.27x on September 20 (¥31,000) against just 1.03x on September 23 (¥15,700) — effectively the same pricing as a normal Wednesday. On an all-property basis, Tokyo’s September 23 multiple is 0.98x, slightly below a normal Wednesday.
In short, the market’s pricing is not built as “holiday rates across all five days” but along the line of “is tomorrow a day off?” Tuesday, September 22 carries a premium as the eve of the September 23 holiday; Wednesday, September 23 carries none because September 24 is a working day. The direction matches the movement in estimated occupancy on the demand side, so price and demand readings are not badly out of step.
There are differences by property type, though. Resort hotels in the five onsen prefectures hold a 1.20x listed-price multiple on September 23 while keeping estimated occupancy +1.9pt above the normal baseline — holding price with demand following. Ryokan in those same five prefectures, by contrast, price at 1.11x while estimated occupancy runs 5.0pt below a normal Wednesday, leaving a slight mismatch between price and demand on the final day. That reads as room for upside depending on product design.
Source: MetroEngines Research; compiled by the HotelBank Editorial Team
By area — only Okinawa and Aichi stay positive on the final day
Taking the back-two-day difference against the normal same-weekday baseline for each of the nine areas makes the split clear. On Tuesday, September 22 all nine areas are positive (+2.3pt to +16.4pt). But on Wednesday, September 23 only two areas stay positive — Okinawa (+3.2pt) and Aichi (+11.0pt) — while the onsen areas near the Kanto region swing negative: Gunma -4.1pt, Tochigi -4.6pt, Kanagawa -3.2pt. The related question of whether property types with higher occupancy at the 45-days-out snapshot have less room left to grow in the final stretch is examined for that prefecture in Tochigi Booking Curves by Type: Resort 81.1% at T-45, Only +2.6pt Left.
Source: MetroEngines Research; compiled by the HotelBank Editorial Team
| Area | Sat 9/19 | Sun 9/20 | Mon 9/21 | Tue 9/22 | Wed 9/23 | 9/22 vs normal Tue | 9/23 vs normal Wed | Observed properties |
|---|---|---|---|---|---|---|---|---|
| Kanagawa | 74.2% | 79.1% | 75.0% | 70.6% | 61.0% | +4.8pt | -3.2pt | 607–681 |
| Gunma | 76.9% | 84.2% | 80.0% | 68.0% | 57.4% | +7.0pt | -4.1pt | 485–573 |
| Tochigi | 74.3% | 80.8% | 77.4% | 66.6% | 58.5% | +4.4pt | -4.6pt | 579–595 |
| Shizuoka | 74.6% | 81.0% | 78.5% | 69.5% | 61.9% | +5.6pt | -2.0pt | 1,238–1,259 |
| Okinawa | 78.0% | 81.1% | 80.4% | 74.8% | 70.9% | +6.6pt | +3.2pt | 1,122–1,133 |
| Tokyo | 79.8% | 78.4% | 73.9% | 73.7% | 67.8% | +6.4pt | -1.5pt | 1,309–1,342 |
| Osaka | 77.0% | 76.9% | 70.7% | 69.0% | 63.8% | +5.5pt | -0.4pt | 697–711 |
| Aichi | 92.8% | 95.1% | 93.7% | 90.4% | 87.6% | +16.4pt | +11.0pt | 503–525 |
| Fukuoka | 78.3% | 78.5% | 74.1% | 72.1% | 66.8% | +2.3pt | -2.0pt | 603–616 |
All-property basis, LT47 snapshot (observed August 3–7, 2026). Observed property counts are the range across each area’s five-day cross-section (including the most recent observation column).
Source: MetroEngines Research; compiled by the HotelBank Editorial Team
Aichi’s curve is explained by the Asian Games, not by the holiday
Aichi sits in a different league from the other areas. It runs between 87.6% and 95.1% from September 19 through 23, and even on September 23 it is 11.0pt above a normal Wednesday. Listed prices are high too — 2.32x a normal Sunday on September 20 and still 1.57x on September 23.
This is not a five-day-holiday effect. The 20th Asian Games (Aichi-Nagoya 2026) runs for 16 days from September 19 to October 4, centered on Nagoya, with 43 sports across 55 venues. It is the first time Japan has hosted the Games in 32 years, since Hiroshima in 1994.
Indeed, following the 65-days-out snapshot past the end of the holiday, Aichi’s estimated occupancy stays elevated throughout the Games — 89.6% on September 24, 94.2% on September 26, 85.0% on September 30, 87.2% on October 3 — before dropping to 66.2% on Wednesday, October 7, after the Games close. Tokyo over the same period stays flat at 64.8% to 72.4%. In other words, Aichi’s inventory sell-down is not a “holiday peak” but a “16-day plateau” driven by the Games. For properties in the Nagoya area, the question of how to design the back two days cannot even be framed within the structure of the holiday.
LT65 snapshot. Observed property counts: Aichi 303–530, Tokyo 868–1,325.
Source: MetroEngines Research; compiled by the HotelBank Editorial Team
How much did the back two days move over the 18 days from T-65 to T-47?
Place a second snapshot further out and look at how much inventory sold down over those 18 days. Ryokan in the five onsen prefectures added +4.1pt to +5.7pt across the first three days, but only +1.8pt (September 22) and +1.6pt (September 23) on the back two. Resort hotels in those same five prefectures, by contrast, added +3.6pt and +3.1pt on the back two days — nearly the same pace as the first three. Business hotels in the four urban prefectures also kept moving, at +3.4pt and +2.6pt on the back two days.
That difference matters. The back two days at ryokan are in a doubled-up state: not only is the current level low, but the accumulation over the past 18 days has been thin as well. Put the other way, a large amount of demand remains unsettled. Resort hotels and urban business hotels continue to take bookings on the back two days at the same speed as the first three.
Change in estimated occupancy from LT65 to LT47. Observed property counts at LT65: 5 onsen prefectures ryokan 870–911, 4 urban prefectures business 1,707–1,772. Because the observed population expands by roughly 20% between that and the LT47 cross-section (ryokan 981–1,080, etc.), the gains should be read as a conservative lower bound.
Source: MetroEngines Research; compiled by the HotelBank Editorial Team
Note on the observed population: the number of observed properties in a booking curve varies by LT cross-section. In this article all daily comparisons are aligned within the same LT cross-section (LT47), and the observed property count for that cross-section stays within roughly ±1.5% for each series. For comparisons that span LT65 and LT47, however, the observed population expands, so the gains are treated as a lower bound. Every table and chart states the observed property count range (including the most recent observation column).
Looking only at properties listing 30% or more of their rooms on OTAs
Area aggregates are estimates using total room count as the denominator, so differences in how much inventory each property releases to OTAs are smoothed out. As a supplementary view, we narrowed the sample to properties listing 30% or more of their total rooms on OTAs and looked at the depth of remaining-room rates at the property level. Sorting properties from the lowest remaining-room rate and comparing the 50th property’s value, September 23 is consistently higher than September 22.
| Area / property type | Properties observed | In sample (9/22) | In sample (9/23) | 50th remaining-room rate 9/22 |
50th remaining-room rate 9/23 |
|---|---|---|---|---|---|
| Shizuoka / ryokan | 361 | 234 | 233 | 34.3% | 36.4% |
| Gunma / ryokan | 262 | 154 | 151 | 38.5% | 40.0% |
| Tochigi / ryokan | 192 | 114 | 121 | 45.0% | 48.4% |
| Kanagawa / ryokan | 248 | 143 | 128 | 36.4% | 40.0% |
| Okinawa / resort hotels | 243 | 118 | 129 | 33.3% | 36.4% |
| Tokyo / business hotels | 478 | 256 | 291 | 28.1% | 30.6% |
| Osaka / business hotels | 349 | 181 | 202 | 32.7% | 35.6% |
| Fukuoka / business hotels | 317 | 159 | 173 | 38.7% | 42.3% |
Only properties listing 30% or more of their total rooms on OTAs are included (those below that threshold are excluded). The “50th remaining-room rate” is the value at the 50th property when sorted from the lowest remaining-room rate. Observed as of August 7, 2026.
Source: MetroEngines Research; compiled by the HotelBank Editorial Team
In the urban areas, the number of properties in the sample is itself larger on September 23 than on September 22 (Tokyo 256 to 291, Osaka 181 to 202, Fukuoka 159 to 173). More properties are still listing 30% or more of their rooms on OTAs on the final day. One caveat: properties listing less than 30% are excluded. A small listed allocation can have several causes — channel strategies centered on direct booking, call centers or travel agents; operations that release inventory in small increments as check-in approaches; or contracts that simply set a low OTA allocation — and public data alone cannot distinguish between them.
If the back two days move, how far does the five-day average move?
Every figure so far is an observed value under this article’s metric definitions. Finally, using only the arithmetic that follows directly from those definitions, we set out how added occupancy on the back two days feeds into the five-day average. The five-day average is by definition (first-three-day average x 3 + back-two-day average x 2) ÷ 5, so when the back two days move by Δpt, the change in the five-day average is always Δ x 2 ÷ 5 = 0.4 x Δ. What follows is not a forecast but a unit conversion, feeding the observed values presented above back into the same definition.
| Area group / property type | Current 5-day average | Conservative (+1.6pt) | Middle (+2.6pt) | Upper (+3.6pt) |
|---|---|---|---|---|
| 5 onsen prefectures / ryokan | 73.4% | 74.1% (+0.7pt) | 74.5% (+1.1pt) | 74.9% (+1.5pt) |
| 5 onsen prefectures / resort hotels | 77.7% | 78.3% (+0.6pt) | 78.7% (+1.0pt) | 79.1% (+1.4pt) |
| 5 onsen prefectures / business hotels | 72.8% | 73.4% (+0.6pt) | 73.8% (+1.0pt) | 74.2% (+1.4pt) |
| 4 urban prefectures / city hotels | 82.4% | 83.1% (+0.7pt) | 83.5% (+1.1pt) | 83.9% (+1.5pt) |
| 4 urban prefectures / business hotels | 73.6% | 74.2% (+0.6pt) | 74.6% (+1.0pt) | 75.0% (+1.4pt) |
All three levels of added occupancy are observed values that appear in this article. Conservative = the actual gain ryokan in the five onsen prefectures accumulated for September 23 since 65 days out (+1.6pt); Middle = the actual gain business hotels in the four urban prefectures accumulated for September 23 (+2.6pt); Upper = the actual gain resort hotels in the five onsen prefectures accumulated for September 22 (+3.6pt). The five-day average weights the first-three-day and back-two-day averages by number of days; it is not a forecast of any future level.
| Area group / property type First 3 days / back 2 days | +1.6pt | +2.6pt | +3.6pt | +4.1pt | +5.7pt |
|---|---|---|---|---|---|
| 5 onsen prefectures / ryokan 81.0% / 62.1% | 74.1% | 74.5% | 74.9% | 75.1% | 75.7% |
| 5 onsen prefectures / resort hotels 81.5% / 71.9% | 78.3% | 78.7% | 79.1% | 79.3% | 79.9% |
| 5 onsen prefectures / business hotels 76.5% / 67.2% | 73.4% | 73.8% | 74.2% | 74.4% | 75.1% |
| 4 urban prefectures / city hotels 85.0% / 78.6% | 83.1% | 83.5% | 83.9% | 84.1% | 84.7% |
| 4 urban prefectures / business hotels 76.4% / 69.4% | 74.2% | 74.6% | 75.0% | 75.2% | 75.9% |
All five column values are actual T-65 to T-47 gains that appear in this article (back two days +1.6 to +3.6pt, first three days +4.1 to +5.7pt); no extrapolation is applied. The rows use the first-three-day and back-two-day averages from Table 1. Shading indicates the level of the five-day average.
Source: MetroEngines Research; compiled by the HotelBank Editorial Team
Two things follow. First, however much occupancy is added on the back two days, only 0.4 times that amount reaches the five-day average. Even if ryokan in the five onsen prefectures matched the first-half pace on the back two days (+5.7pt), the five-day average would move only from 73.4% to 75.7%, or +2.3pt. What changes how the whole break looks is not the back two days but the already-high level of the first three.
Second, for the back two days at ryokan to match the first-three-day level (81.0%) would take 18.9pt — roughly eleven times the actual gain of the past 18 days (+1.8pt on September 22 and +1.6pt on September 23, averaging +1.7pt). That is not a level to be closed in the remaining 47 days. Which is precisely why designing the back two days is more realistic when framed not as “aim for the same fill as the first three days” but, as in the three plays in the next section, as channeling first-half demand into the back half. Even on a five-day average basis, the gap between ryokan at 73.4% and urban city hotels at 82.4% will not close through added occupancy on the back two days alone.
The back two days for operators — three design opportunities
Translating the numbers so far into operator plays, three revenue opportunities emerge for the back two days. All three build on the strong first three days as a foundation.
First, designing multi-night conversion. Ryokan in the five onsen prefectures have accumulated to 81.0% across the first three days. Building a two-night product with check-in on Monday, September 21 or Tuesday, September 22 for that demonstrably strong demand pool channels first-half demand into the September 22 and 23 inventory that does not move on a single-night basis. The listed-price gap between Sunday, September 20 and Wednesday, September 23 is about ¥18,600 (¥54,700 to ¥36,100), so there is room to discount the second night and still hold a per-night average above a first-half single-night stay.
Second, designing check-out times. The demand inflection on Wednesday, September 23 is that September 24 is a working day. Read the other way, a product that delays check-out on September 23 — for example, a September 22 check-in with late check-out on the 23rd — converts final-day “going home” demand into the previous night’s room rate. September 22 runs above a normal Tuesday in all nine areas, so there is a foundation to absorb the uplift.
Third, room for last-stretch plays. Over the 18 days from 65 days out to 47 days out, the back two days at ryokan in the five onsen prefectures moved only +1.8pt and +1.6pt. Flipped around, that is the segment with the widest scope to move in the remaining 47 days. Given that business hotels in the four urban prefectures added +3.4pt and +2.6pt on the back two days over the same 18 days, there is a good chance enough demand remains to draw the same pace out on the ryokan side too. Staged pricing, and putting multi-night plans at weekday rate levels into the market early, are how that gets drawn out.
Resort hotels in Okinawa and properties in Aichi are in a different situation from all of this. The former is a stay-oriented market that remains 3.2pt above a normal Wednesday even on September 23 while holding a 1.22x listed-price multiple. The latter sits inside 16 days of Asian Games event demand, where inventory and pricing need to be designed across the full Games period rather than within the frame of the holiday. For how Okinawa’s inventory sold down from late summer into September, Okinawa Late-Summer Booking Curve 2026: Sep 5 Beats Obon, City +4.7pt tracks it by property type.
⚠ Note on data for future dates: the estimated occupancy and listed prices in this article are observed values based on inventory and selling prices published on OTAs as of 47 days before check-in (65 days in some cases). The dates analyzed are more than 40 days ahead at the time of writing, and the figures will change with further booking progress, added inventory and price adjustments. They do not indicate that any specific property is sold out or selling out early; please read them as a mid-course snapshot of booking progress still under way.
Summary
The first five-day break in eleven years is not a uniform “long holiday” across all five days. On the evidence of the 47-days-out snapshot, demand peaks on Sunday, September 20; all nine areas run above their normal same-weekday level through Tuesday, September 22; but Wednesday, September 23 falls back to roughly a normal Wednesday, led by ryokan in the onsen areas. Market pricing moves on the same logic: on the final day, with a working day to follow, almost no price premium is applied.
What holds demand across the back two days is stay-oriented resort hotels (Okinawa), urban business hotels, and Aichi with its event demand. Which means that for everything else — above all onsen ryokan near the Kanto region — September 22 and 23 are the dates with the most room left to move in the remaining 47 days. Conversion to multi-night stays, product design built around check-out times, and early market placement priced off weekday rate levels are the concrete means of turning that room into revenue.
Related Reading
- Silver Week 2026, 76 Days Out: Booking Pace Across 6 Onsen Areas
- Okayama Booking Curves: 3 Checkpoints, Aug 8 Late-Surges +11.8pt
- Okinawa Late-Summer Booking Curve 2026: Sep 5 Beats Obon, City +4.7pt
- Tochigi Booking Curves by Type: Resort 81.1% at T-45, Only +2.6pt Left
- Silver Week 2026: First in 11 Years — ADR & Booking Curve Analysis
References and Sources
■ Data sources
Estimated occupancy and listed prices are our own aggregation based on daily observation of inventory and selling prices published on OTAs. Two cross-sections were taken — 47 days before check-in (LT47, observed August 3–7, 2026) and 65 days before (LT65) — for nine prefectures (Kanagawa, Gunma, Tochigi, Shizuoka, Okinawa, Tokyo, Osaka, Aichi, Fukuoka) across five property types (ryokan / resort hotels / business hotels / city hotels / all properties). Property-level remaining-room data is observed as of August 7, 2026.
■ Calculation assumptions
Estimated occupancy for an area group is a room-count-weighted value: the sum of sold rooms across the constituent prefectures divided by the sum of total rooms. The listed-price multiple divides the room-count-weighted average for the same area group and property type by the average of two non-holiday days of the same weekday in the same month (Sat = Sep 5 and Sep 12; Sun = Sep 6 and Sep 13; Mon = Sep 7 and Sep 14; Tue = Sep 8 and Sep 15; Wed = Sep 9 and Sep 16). The first three days are the simple average of September 19–21 and the back two days the simple average of September 22–23. The five-day averages in Tables 4 and 5 are a unit conversion based on the definition (first-three-day average x 3 + back-two-day average x 2) ÷ 5, and are not a forecast of any future level. All levels of added occupancy use only actual T-65 to T-47 values that appear in this article; no extrapolation is applied.
■ Limitations and caveats
Estimated occupancy is an estimate based on how inventory published on OTAs is being sold down, and differs from a property’s actual overall occupancy including direct and travel-agent bookings. Listed prices are averages of selling prices, not transacted rates, and this article does not deal with estimated settled ADR. Because the observed property count varies by LT cross-section, all daily comparisons are aligned within the same LT cross-section, each table and chart states the observed property count range, and gains spanning LT65 and LT47 are treated as a lower bound because the observed population expands by roughly 20%. Property-level remaining-room rates are limited to properties listing 30% or more of their total rooms on OTAs; properties with smaller listed allocations are excluded. The dates analyzed are more than 40 days ahead at the time of writing, and the figures will change with further booking progress, added inventory and price adjustments.
■ Market data
- MetroEngines Research — booking curves (estimated occupancy and listed prices, LT47 / LT65 snapshots, 9 prefectures x 5 property types), property-level remaining-room data
■ Events and calendar
- Asian Games Aichi-Nagoya 2026: list of sports, venues and access information (Olympics.com)
- Aichi-Nagoya Asian Games (Japanese Olympic Committee)
■ Government statistics