

The hotel as an asset class has long been available only “one building at a time.” You could hold it indirectly through the investment units of a listed REIT, commit capital to a private fund as an institutional investor, or acquire an entire property outright with your own equity plus bank debt. The middle ground was thin.
A third route is now growing here. It is the real estate security token (ST / digital security). Beneficiary interests are recorded on a blockchain, and individuals can invest in one specific hotel building in units of ¥100,000. On July 31, 2026, a digital security backed by a single hotel building in Nakagyo Ward, Kyoto City began operation, with two regional banks participating via non-recourse loans.
This article quantifies what small-lot securitization as a vehicle brings to hotel assets, using both public statistics and our own data. We line up listed REITs, private REITs and real estate STs across minimum investment unit, liquidity, disclosure frequency and investor base; we then work backward from estimated settled ADR and room count to asset size, showing which size bands and which areas fit within ST deal sizes. Finally, we test how well the reverse-engineered model holds up by comparing it against the actual acquisition prices of the 301 properties held by seven listed hotel REITs.
Metric Definitions Used in This Article
- ADR (Average Daily Rate): An estimated settled rate (tax-excluded equivalent) calculated by applying a property-type correction coefficient to the lowest published plan level each property lists on OTAs (double occupancy, per-room rate, tax included). Against property-level actuals disclosed by listed hotel REITs (Invincible Investment Corporation, 184 property-months / April–May 2026), the median error is approximately 7.5% (approximately 6.0% for the business and city hotel segments). These are estimates and differ from each property’s actual transaction prices and accounting figures. Area-level ADR is the median of the target properties (the level of a typical property in that area).
- OCC (Occupancy Rate): The share of sold rooms against total room inventory within an area (an estimate based on OTA sales inventory). The calculations in this article place occupancy as an assumed value; our estimated OCC is not used.
- Cap Rate (Expected Yield): The expected yield for limited-service hotels in the Japan Real Estate Institute’s “Japanese Real Estate Investor Survey” (54th survey, as of April 2026).
- Data Sources: MetroEngines Research & Consulting / Japan Real Estate Institute / BOOSTRY / IR disclosures of each REIT
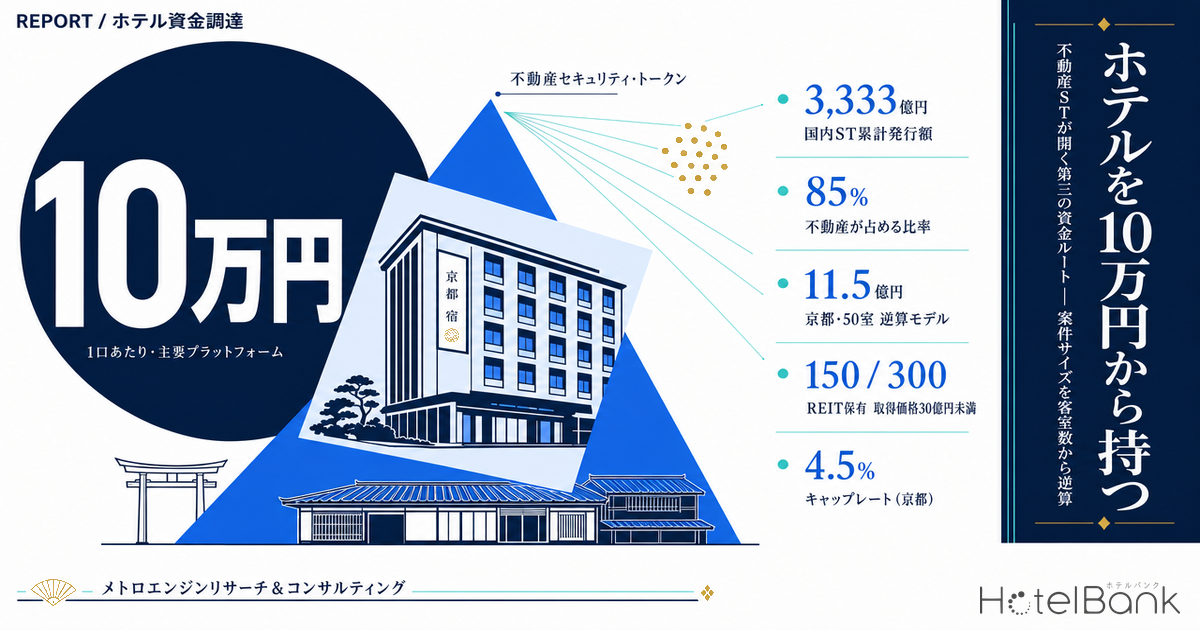
- — ¥333.3bn cumulative — Domestic public STs expanded to ¥165.0bn in single-year issuance and ¥333.3bn cumulatively in FY2025. Real estate accounts for 85% of that (¥140.8bn).
- — ¥100,000 per unit — Real estate STs can be structured around a single specified property at a scale of several hundred million to several billion yen, channeling individual capital into the small and mid-sized hotels that listed and private REITs never reached.
- — Kyoto, 50 rooms = approx. ¥1.15bn — Asset size derived backward under assumptions of estimated settled ADR ¥14,173, 80% occupancy, 25% NOI margin and a 4.5% cap rate. It fits within the ST deal size band.
- — Half of 300 properties are below ¥3.0bn — The median acquisition price of properties held by seven listed hotel REITs (N=300) is ¥3.00bn. 150 are below ¥3.0bn and 47 are below ¥1.0bn.
- — 6% model error — In Tokyo, the reverse-engineered model gives ¥25.5mn per room against a REIT median of ¥24.1mn. The ST deal size band overlaps with the exit market.
From Three Layers of Capital to Four — Small-Lot Individual Money Starts Reaching Hotel Assets
Start with the breadth of the market. According to BOOSTRY’s “Domestic Security Token Market Overview Report (FY2025),” public ST issuance in FY2025 reached ¥165.0bn for the single year and ¥333.3bn cumulatively. The cumulative figure roughly doubled from approximately ¥168.4bn at the end of the prior fiscal year. For FY2026, ¥200.0bn in single-year issuance and ¥530.0bn cumulatively are projected.
What deserves attention is the composition of the underlying assets. Of the ¥165.0bn issued in FY2025, ¥140.8bn — roughly 85% of the total — took the form of specified beneficiary securities issuance trusts backed by real estate. In other words, the ST vehicle stood up in Japan as, essentially, a vehicle for real estate. And within real estate, hotels and lodging facilities have become a principal target asset alongside residential and office.
A secondary market is also beginning to move. On the proprietary trading system “START,” eight issues were traded as of the end of March 2026, with a market capitalization of ¥33.6bn. As a share of total issuance outstanding this remains small, but it is a step beyond the initial picture of “once issued, frozen until redemption.”
Comparing the Vehicles — What Separates Listed REITs, Private REITs and Real Estate STs
The three vehicles are less competitors than conduits for capital of different character. Organized side by side, they look as follows.
| Comparison Axis | Listed REIT | Private REIT / Private Fund | Real Estate ST (Digital Security) |
|---|---|---|---|
| Minimum investment unit | Depends on the unit price (tens of thousands to several hundred thousand yen) | Set per deal; large commitments are effectively a precondition | ¥100,000 per unit (major platforms) |
| Granularity of the investment | The entire portfolio (dozens to over 100 properties) | Fund level (often multiple properties) | In principle a single specified property (one building) |
| Liquidity | High. Traded daily on the exchange | Low. Opportunities to sell during the term are limited | Limited. Some issues are tradable on the PTS “START” |
| Disclosure | In addition to fiscal-period disclosure, many issuers publish monthly operating results (OCC, ADR, RevPAR) | Mainly periodic reporting to investors | Operating reports per deal. Disclosure frequency and granularity vary by issuer |
| Principal investor base | Individuals, domestic institutions, overseas institutions | Institutional investors such as pension funds and financial corporations | Mainly individuals (via securities firms and online banks) |
| Typical deal size | Property acquisitions from several billion to over ¥100bn | Fund size from several billion to several tens of billions of yen | Centered on several hundred million to several billion yen |
| What it means for the hotel side | Entering a portfolio requires meeting certain scale and location criteria | Acquisitions often assume a value-add plan | Single-building and small to mid-sized assets can still be structured |
From a hotel owner’s standpoint, the decisive line is the last one. Entering a listed REIT’s portfolio requires satisfying criteria on location, scale, building age and operating structure. In fact, the median acquisition price of the 301 properties held by seven listed hotel REITs is approximately ¥3.00bn, with 39 properties above ¥10.0bn. A real estate ST, by contrast, can be structured around one specified property from a scale of several hundred million yen. Assets that sat in the band of “too small for a REIT, too heavy for own equity” have acquired a vehicle. A parallel move to channel capital into the same size band is also visible on the debt side, and our analysis of regional bank-led small-scale continuous development and renovation funds sets out how their capital supply differs from large REIT acquisitions.
A Recent Case — A Single Hotel Building in Nakagyo Ward, Kyoto, Entered Operation in July 2026
Consider a concrete example. “renga” No. 3, structured by Digital Securities Co., Ltd., takes as its investment target the Shizutetsu Hotel Prezio Kyoto Karasuma-Oike (静鉄ホテルプレジオ京都烏丸御池, 99 rooms) in Nakagyo Ward, Kyoto City, and began operation on July 31, 2026. The digital security issuance raised a total of ¥890mn from individual investors and others, with Joyo Bank (常陽銀行) and The Bank of Nagoya (名古屋銀行) participating through non-recourse loans.
Two points stand out here. First, regional banks joined the structure as providers of non-recourse debt. A configuration in which equity comes from small-lot individual money and debt from regional financial institutions gathers capital differently from the conventional “one building = corporation plus main bank.” Second, the target is a mid-sized limited-service hotel of 99 rooms. That is modest as a listed REIT acquisition target, but it works as an ST. On how the cost of debt feeds through to the overall capital structure, corporate bonds, REIT equity offerings and non-recourse loans each carry distinct cost profiles, and the relative pricing among them shifts with the interest rate environment.
Platform design is also tilted toward individuals. On ALTERNA, operated by Mitsui & Co. Digital Asset Management, deals are listed that can be subscribed to in ¥100,000 units at ¥100,000 per unit. Among hotel deals, an 800-room Toyoko Inn property in the Nagoya Station area was offered at an assumed yield of 4.5% per annum (the annualized average of the first and second periods, before tax), with redemption scheduled for November 2032. That deal carries accommodation privileges scaled to the number of units held, along with a performance-linked mechanism under which additional lodging discount vouchers are granted if annual occupancy exceeds 70%, 75% or 80%. It is a design that lets investors receive the track record of a chain with strong demand generation through both returns and the guest experience.
For the Shinagawa Seaside East Tower deal (a mixed office and hotel building), an assumed yield of 4.0% per annum and an appraisal value of ¥42.4bn as of June 30, 2026 are disclosed. From single-building deals of several hundred million yen to complex buildings worth tens of billions, the range of the vehicle is widening.
How this article treats these figures: The assumed yields and appraisal values above are all figures stated in the published materials for each deal, and do not guarantee future distributions. This article is not intended to recommend individual products; it addresses the structure of the vehicle as a funding route.
Working Backward on Scale — Estimating Asset Size from Estimated Settled ADR and Room Count
So, does your own hotel fit within an ST deal size? From here we start from our estimated settled ADR and work backward to asset size. The assumptions behind the calculation are as follows, and we note upfront that every one of them is an assumption.
| Item | Assumed Value | Basis |
|---|---|---|
| ADR | Estimated settled ADR by prefecture for the business hotel segment (12-month average, July 2025 – June 2026) | MetroEngines Research & Consulting. Restricted to the business hotel segment in order to align the target with the cap rate for limited-service hotels |
| Occupancy | 80% (fixed) | June 2026 results published by listed hotel REITs: Invincible Investment Corporation 82.7% (101 domestic hotels), Ichigo Hotel REIT Investment Corporation 80.6% (whole portfolio), Japan Hotel REIT Investment Corporation 81.2% (29 hotels with variable rent and similar structures) |
| Annual room revenue | Rooms × ADR × occupancy × 365 days | Room revenue only. A conservative setting that excludes retail, banquet and other income |
| NOI margin | 25% of room revenue | Set as the level remaining after deducting FF&E reserves, property tax, insurance and management fees, starting from a GOP margin of around 35% for limited-service hotels |
| Cap rate | 4.1–5.3% by city | Expected yield for limited-service hotels in the Japan Real Estate Institute’s “54th Japanese Real Estate Investor Survey” (as of April 2026) |
The asset sizes calculated on these assumptions appear in the table below. For example, the estimated settled ADR for the business hotel segment in Kyoto is approximately ¥14,200 on a 12-month average (N=319 properties). At 50 rooms, annual room revenue is approximately ¥210mn and NOI approximately ¥52mn; discounting at a 4.5% cap rate gives an asset size of approximately ¥1.15bn.
| City | Estimated Settled ADR | Cap Rate | 30 rooms (¥100mn) | 50 rooms (¥100mn) | 80 rooms (¥100mn) | 120 rooms (¥100mn) | Per room (¥mn) | Room count fitting ¥0.3–3.0bn |
|---|---|---|---|---|---|---|---|---|
| Tokyo | ¥14,330 | 4.1% | 7.7 | 12.8 | 20.4 | 30.6 | 25.5 | 12–118 rooms |
| Kyoto | ¥14,173 | 4.5% | 6.9 | 11.5 | 18.4 | 27.6 | 23.0 | 13–130 rooms |
| Osaka | ¥10,715 | 4.5% | 5.2 | 8.7 | 13.9 | 20.9 | 17.4 | 17–172 rooms |
| Fukuoka | ¥10,851 | 4.7% | 5.1 | 8.4 | 13.5 | 20.2 | 16.9 | 18–178 rooms |
| Nagoya | ¥7,852 | 4.9% | 3.5 | 5.8 | 9.4 | 14.0 | 11.7 | 26–256 rooms |
| Sapporo | ¥8,821 | 5.0% | 3.9 | 6.4 | 10.3 | 15.5 | 12.9 | 23–233 rooms |
| Naha | ¥8,783 | 5.0% | 3.8 | 6.4 | 10.3 | 15.4 | 12.8 | 23–234 rooms |
| Sendai | ¥7,472 | 5.3% | 3.1 | 5.1 | 8.2 | 12.3 | 10.3 | 29–291 rooms |
What this shows is plain. In Sendai, Nagoya, Sapporo and Naha, a wide range from the high 20s in room count to over 200 rooms fits within ST deal sizes. In Tokyo and Kyoto, where land values and rates are higher, roughly 12–13 rooms to 120–130 rooms falls into the ¥0.3–3.0bn range. In short, small and mid-sized limited-service hotels sit inside the ST deal size envelope regardless of city.
| Occupancy | NOI margin 20% | NOI margin 25% (base) | NOI margin 30% |
|---|---|---|---|
| 70% | 8.0 | 10.1 | 12.1 |
| 75% | 8.6 | 10.8 | 12.9 |
| 80% (base) | 9.2 | 11.5 | 13.8 |
| 85% | 9.8 | 12.2 | 14.7 |
| Cap Rate | Asset Size (¥100mn) | vs. Base |
|---|---|---|
| 4.0% | 12.9 | +12% |
| 4.5% (base) | 11.5 | — |
| 5.0% | 10.3 | -10% |
| 5.5% | 9.4 | -18% |
| Scenario | Occupancy | NOI Margin | Cap Rate | Asset Size (¥100mn) | vs. Mid |
|---|---|---|---|---|---|
| Pessimistic case | 70% | 20% | 5.0% | 7.2 | -37% |
| Mid case (base) | 80% | 25% | 4.5% | 11.5 | — |
| Optimistic case | 85% | 30% | 4.0% | 16.5 | +43% |
Validating the Model — Testing It Against the Actual Acquisition Prices of 301 REIT-Held Properties
How well does the estimate hold? We aggregated the acquisition prices of properties held by seven listed hotel REITs from our ownership master (as of August 1, 2026; 301 properties recorded in total, of which 300 have both acquisition price and room count) and compared them against the model values. Note that the accuracy of the estimated settled ADR itself — the starting point of the model — has been separately validated by reconciling REIT-disclosed ADR against market-estimated ADR for the first half of 2026, with a median error of approximately 7.5%.
Look first at the distribution of acquisition prices. Properties acquired below ¥3.0bn number 150, exactly half the total. Of those, 47 are below ¥1.0bn. A listed REIT portfolio may carry an image of an assembly of large properties, but in practice a substantial number of properties are in the several-hundred-million-yen range. The ST deal size band overlaps with the price range in which REITs actually transact.
Next, compare on a per-room basis. Across the 300 properties, the median acquisition price per room is ¥20.8mn (first quartile ¥10.7mn / third quartile ¥39.3mn). The per-room valuations produced by the model in the previous section were ¥10.3–25.5mn, so the ranges overlap.
By city, in Tokyo the model’s ¥25.5mn compares with a REIT median of ¥24.1mn (N=51 properties), a gap of only 6%. Kyoto shows ¥23.0mn from the model against ¥28.8mn in practice (N=4 properties). In Sapporo, Osaka, Fukuoka and Naha, on the other hand, the model falls below the actuals. This is because the model uses the estimated settled ADR for the business hotel segment, whereas the properties REITs acquire in regional cities include city hotels and resorts — a difference of target rather than an error in the model. Put the other way around, it also means that in regional cities, small and mid-sized business-hotel-segment assets sit at a price band even below REIT market levels.
A note on the scale of individual REITs is also worth adding. Ichigo Hotel REIT Investment Corporation holds 29 properties with a total acquisition price of ¥71.90bn (an average of approximately ¥2.48bn per property), and Japan Hotel & Residential Investment Corporation holds 16 properties at ¥48.08bn (approximately ¥3.01bn each). The existence of REITs whose average per property sits in the ¥2–3bn range means that lodging assets in that size band have continuing buyers. The ST deal size band is not isolated from an exit perspective either.
Where Are the Lodging Assets Acquired Below ¥3.0bn?
Plotting the 150 properties acquired below ¥3.0bn on a map, the distribution spreads widely across the country. In addition to major cities such as Tokyo, Osaka and Fukuoka, they are scattered across regional core cities and hot spring and resort areas. Circle size indicates room count, and color depth indicates the level of the acquisition price.
What is shown here consists solely of properties already held by listed REITs; these are not properties for sale. What we want readers to take from it is the distribution itself — where in Japan lodging assets of that price band and that scale actually exist. Assets that could become ST candidates are not confined to the major metropolitan areas.
The Issues on the Owner Side and the Investor Side
Owner side: more options in the capital structure
It becomes possible to design structures such as splitting off part of an interest without selling the whole building, or raising the equity portion at acquisition from individual capital. As in the Kyoto case, a structure combining ST equity with non-recourse debt from regional financial institutions offers a reference model for funding that does not depend on a single main bank.
Investor side: choosing the property you hold
A listed REIT is an investment in an entire portfolio, whereas an ST specifies the property. Investors can pick an area they know or a hotel they have stayed at. In deals carrying accommodation privileges, designs are emerging that link returns to the experience of using the property.
Shared issue: liquidity and disclosure
ST liquidity is limited compared with listed REITs, and only some issues can be traded on a PTS. Disclosure frequency and granularity also vary by issuer. Assumptions about selling mid-term, and which metrics are disclosed at what frequency during the holding period, are points to confirm before structuring.
There is one more issue specific to lodging assets. Hotel revenue is determined by the product of occupancy and rate, and it fluctuates more than office or residential. As the sensitivity analysis in the previous section showed, occupancy falling from 80% to 70% alone changes the estimated asset size by roughly 12%. Accordingly, how monthly OCC, ADR and RevPAR are disclosed in an ST deal becomes central material both for investors and for owners who want to explain the value of their own property. The practice listed hotel REITs have established of disclosing monthly operating results exists for precisely this reason.
Conversely, the better a property can put its revenue management in order and consistently demonstrate its occupancy and rate track record, the more easily it draws capital regardless of the vehicle. The ST removes the constraint of “too small to reach,” but it is not a substitute for earning power itself. The work on the side that produces the numbers does not change.
Summary
Real estate STs expanded in FY2025 to ¥165.0bn in single-year issuance and ¥333.3bn cumulatively, with real estate accounting for 85% of that. A vehicle that allows investment in one specific hotel building from ¥100,000 per unit has emerged as a fourth source of capital after listed REITs, private REITs and PE.
Working backward from estimated settled ADR and room count to asset size, roughly 12–13 rooms to 120–130 rooms in Tokyo and Kyoto, and from the high 20s to over 200 rooms in Sendai, Nagoya, Sapporo and Naha, fall within the ST deal size band of several hundred million to several billion yen. And that band coincides with the price range occupied by exactly half (150 properties) of the 300 properties actually held by seven listed hotel REITs. In Tokyo, the reverse-engineered model’s per-room valuation of ¥25.5mn compares with a REIT median of ¥24.1mn — a gap of 6%.
All of the estimates presented here rest on assumptions, and actual transaction prices and whether a deal can be structured are determined by the specific conditions of each property. Even so, the structural change — that a vehicle is being prepared for lodging assets that sat in the band of “too small for a REIT, too heavy for own equity” — can be confirmed in the numbers. It does not replace existing funding routes; it means one more option has been added.
A note on the estimates: The asset sizes in this article are simplified estimates based on assumptions of 80% occupancy, a 25% NOI margin and city-level cap rates. Actual investment decisions require detailed property-by-property due diligence and feasibility studies. The assumed yields stated for each deal are figures based on published materials and do not guarantee future distributions or principal. This article does not recommend the acquisition of any specific financial product.
Related Reading
References and Sources
■ Data Sources
Estimated settled ADR is compiled by MetroEngines Research & Consulting (business hotel segment, by prefecture / 12-month average, July 2025 – June 2026. Property counts: Tokyo N=905 / Kyoto N=319 / Osaka N=497 / Fukuoka N=337 / Aichi N=326 / Hokkaido N=427 / Okinawa N=194 / Miyagi N=140). Acquisition prices and room counts are from the REIT ownership master (as of August 1, 2026, seven listed hotel REITs, 301 properties recorded in total, of which 300 have both acquisition price and room count). Cap rates are from the Japan Real Estate Institute’s “54th Japanese Real Estate Investor Survey” (as of April 2026). ST market statistics are from BOOSTRY’s “Domestic Security Token Market Overview Report,” each fiscal year edition.
■ Calculation Assumptions
Annual room revenue = rooms × estimated settled ADR × 80% occupancy × 365 days (room revenue only; ancillary income from retail, banquets, parking and the like is excluded). NOI = annual room revenue × 25% (set as the level remaining after deducting FF&E reserves, property tax, insurance and management fees, starting from a GOP margin of around 35% for limited-service hotels). Asset size = NOI ÷ city-level cap rate (4.1–5.3%). Occupancy is an assumed value; our estimated OCC is not used. The sensitivity analysis was run on two axes of 70–85% occupancy × 20–30% NOI margin, and on one axis of 4.0–5.5% cap rate.
■ Limitations and Caveats
(1) Estimated settled ADR is an estimate obtained by applying segment-specific correction coefficients to OTA published prices; against property-level disclosures by listed hotel REITs (Invincible Investment Corporation, 184 property-months / April–May 2026), the median error is approximately 7.5% (approximately 6.0% for the business and city hotel segments). (2) ADR is at the prefecture level while cap rates are at the city level, so the scopes do not strictly match. (3) The reverse-engineered values are simplified estimates based on assumptions and differ from actual transaction prices and appraisal values. (4) The REIT-held properties shown are not for sale; they are a reference for illustrating the distribution of price and size bands. (5) This article does not recommend the acquisition of any specific financial product, and investment decisions require property-specific due diligence.
■ Market Data
- MetroEngines Research & Consulting — Estimated settled ADR (business hotel segment, by prefecture / July 2025 – June 2026), REIT ownership master (as of August 1, 2026, 301 properties)
■ Public Institutions and Research Bodies
- Japan Real Estate Institute, “54th Japanese Real Estate Investor Survey (as of April 2026)”
- Japan Real Estate Institute, “53rd Japanese Real Estate Investor Survey (as of October 2025)”
- Sumitomo Mitsui Trust Research Institute, “Real Estate ST Market Size Continues Its Steady Expansion” (March 17, 2025)
- Japan Security Token Offering Association (JSTOA)
■ ST Market Statistics
- BOOSTRY, “Domestic Security Token Market Overview Report (FY2025)” (published April 2, 2026)
- BOOSTRY, “Japan Security Token Market Overview Report (FY2024)” (published April 2, 2025)
- BOOSTRY, “Japan Security Token Market Overview Report (FY2023)” (published April 2, 2024)
■ Individual Deals and Press Releases
- Digital Securities Co., Ltd., “Notice of Commencement of Operation of Digital Security ‘renga’ No. 3 — Shizutetsu Hotel Prezio Kyoto Karasuma-Oike” (July 31, 2026)
- Mitsui & Co. Digital Asset Management, “Assumed Yield of 4.5% per Annum: Investment in One of the Largest 800-Room Hotels in the Nagoya Station Area” (subscription opened February 25, 2026)
- ALTERNA (Mitsui & Co. Digital Asset Management)
■ REIT Disclosures