

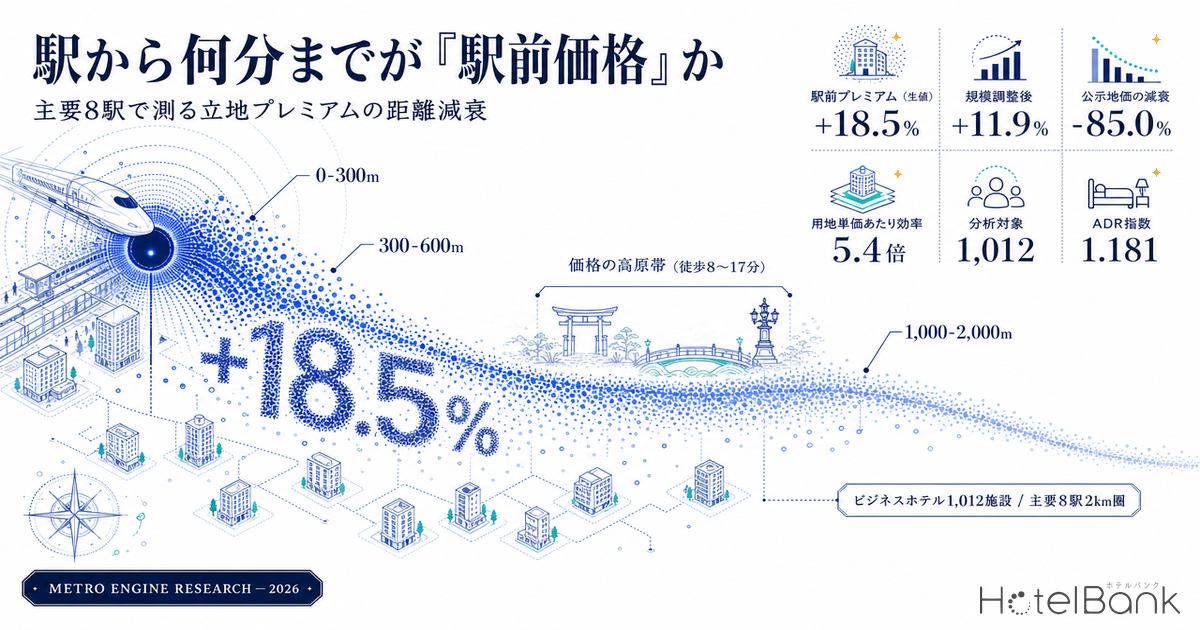
How much does a hotel’s room rate actually differ between “a 3-minute walk from the station” and “a 12-minute walk”? Station-front sites are overwhelmingly preferred in land acquisition, yet there are few examples of measuring, as a function of distance, how far that price gap really extends and where it disappears. This article aggregates the estimated settled ADR of 1,012 business hotels located within a 2 km radius of eight major stations, broken out by distance band, and measures the distance-decay curve of the location premium. We then overlay the distance decay of published land prices (commercial-use standard sites) in the same areas, and use the gap in decay speed between land cost and room rate to run one case study of the conditions under which a project can still work on a site further from the station.
Metric Definitions Used in This Article
- ADR (average daily rate) = an estimated settled rate (tax-exclusive equivalent) calculated by applying category-specific adjustment coefficients to the lowest published plan level each property lists on OTAs (double occupancy, per-room rate, tax included). Cross-checked against property-level actuals disclosed by listed hotel REITs (184 property-months, April-May 2026), the median error is 7.5% (6.0% for the business and city hotel categories covered here). These are estimates and differ from each property’s actual transacted rates and accounting figures. Band-level ADR is the median of the properties in that band (the level of a typical property in that band).
- Distance band = the straight-line distance from the station’s representative coordinates to each property’s coordinates, assigned to one of four bands: 0-300 m / 300-600 m / 600-1,000 m / 1,000-2,000 m. Under the Japanese real-estate convention of 1 minute per 80 m, these correspond roughly to within a 4-minute walk / within 8 minutes / within 13 minutes / within 25 minutes. These are straight-line distances and differ from actual walking distances.
- ADR index = each property’s estimated settled ADR divided by the median for all covered properties at that station (2 km radius). This removes the difference in price level between stations, isolating the effect of distance for comparison across all eight stations.
- Published land price = the price (yen per sqm) of standard sites classified as commercial-use land within the Land Price Publication released by Japan’s Ministry of Land, Infrastructure, Transport and Tourism (MLIT).
- Data sources: MetroEngines Research & Consulting / MLIT Real Estate Information Library / MLIT National Land Numerical Information
- — The ADR index is 1.181 at 0-300 m and 0.963 at 1,000-2,000 m. Across 1,012 business hotels at eight major stations, the raw station-front premium is +18.5%.
- — Holding size to 80-250 rooms narrows the gap to +11.9%. Roughly one third of the raw price gap is explained by a composition effect: large properties cluster near stations.
- — The decay is essentially over by an 8-minute walk (600 m); from 600 to 1,400 m the index sits at 1.00-1.02, a price plateau. Prices only clearly fall again beyond 1,400 m.
- — Published land prices (commercial) fall -85.0% over the same interval, decaying 4.6 times faster than ADR, so ADR efficiency per unit of land cost in the 1,000-2,000 m band is 5.4 times that of the station front.
- — The inner-versus-outer gap by station ranges from +41.9% at Osaka (Umeda) to -5.6% at Hakata; in multi-core markets with a second entertainment district, the link between distance and rate weakens.
Conclusion — “station-front pricing” is largely over at an 8-minute walk, followed by a gentle plateau
Isolating the effect of distance across all eight stations, the ADR index was 1.181 at 0-300 m, 1.028 at 300-600 m, 1.000 at 600-1,000 m and 0.963 at 1,000-2,000 m. Stepping out of the first 300 m from the station entrance already drops the index about 13%, and it narrows further out to 600 m. Beyond 600 m, however, the decay all but stops: the decline from 1,000 m to 2,000 m is under 4%. Price does not decay uniformly with distance; the inflection points are concentrated in the first few hundred meters.
A finer cut in 200 m increments makes this structure clearer still. The index steps down from 1.119 at 0-200 m to 1.064 at 200-400 m and 1.039 at 400-600 m, but after landing at 1.000 at 600-800 m it forms an almost flat plateau of 1.014-1.015 from 800 to 1,400 m. It only turns clearly downward beyond 1,400 m, falling to 0.861 at 1,800-2,000 m. In other words, the price gradient that deserves the name “station-front pricing” extends only to roughly an 8-minute walk (about 600 m), and from there out to about a 17-minute walk (1,400 m) lies a band that is essentially equivalent in price terms.
* The 0-200 m band has only N=11 and is indicative. Gray bars show the property count for each band (right axis).
Measurement design — without holding category constant, a “false decay” appears
Slicing area-average ADR directly by distance produces a decay that does not match reality. Large city hotels and deluxe properties tend to cluster near stations, while smaller ryokan and guesthouses mix into the outer ring, so differences in category mix get observed as price differences. This article restricts the sample to business hotels and compares distance within a single category. We also attempted the same aggregation for city hotels, but even pooling all eight stations left many bands with single-digit property counts, so the sample could not support band-level comparison and city hotels are excluded from this analysis.
The eight stations were selected from major markets with large passenger volumes. Taking the station’s representative coordinates as the center, we searched for properties within a 2 km radius, assigned them to four bands by straight-line distance, averaged six months of estimated settled ADR per property from February to July 2026, and took the median as the band’s representative value. Because the price levels of the eight stations differ widely (station-market medians range from about ¥9,800 at the cheapest, Osaka (Umeda), to about ¥15,800 at the highest, Shinagawa), the ADR index normalized by each station’s median is our primary metric for cross-station comparison. How a station’s traffic volume corresponds to the surrounding room stock is a separate question and is not covered here.
| Station | Daily passengers | Properties covered | Station-market median ADR | 0-600 m | 600-2,000 m | Inner vs outer |
|---|---|---|---|---|---|---|
| Shinjuku | approx. 3.39 million | 87 | ¥14,962 | ¥19,400 (n=9) | ¥14,900 (n=78) | +30.0% |
| Osaka (Umeda) | approx. 2.06 million | 90 | ¥9,772 | ¥13,200 (n=14) | ¥9,300 (n=76) | +41.9% |
| Nagoya | approx. 1.15 million | 103 | ¥10,203 | ¥10,400 (n=49) | ¥9,500 (n=54) | +9.1% |
| Shinagawa | approx. 850,000 | 27 | ¥15,758 | ¥18,100 (n=4) | ¥15,200 (n=23) | +18.7% |
| Kyoto | approx. 610,000 | 184 | ¥14,182 | ¥15,600 (n=53) | ¥13,700 (n=131) | +14.0% |
| Namba | approx. 600,000 | 231 | ¥10,277 | ¥12,400 (n=60) | ¥9,800 (n=171) | +27.0% |
| Hakata | approx. 470,000 | 179 | ¥14,525 | ¥14,100 (n=66) | ¥15,000 (n=113) | -5.6% |
| Sapporo | approx. 320,000 | 111 | ¥13,847 | ¥14,200 (n=29) | ¥13,600 (n=82) | +4.4% |
* The 0-600 m figures for Shinjuku and Shinagawa have fewer than 10 properties and are indicative. Passenger volumes are approximations that combine adjacent same-name stations of multiple operators into a single market.
One third of the raw price gap is explained by large properties clustering near stations
Looking at room count by distance band, the median property at 0-300 m has 180 rooms, at 300-600 m 141 rooms and at 600-1,000 m 106 rooms — the closer to the station, the larger the property. Room count in turn tracks the ADR index clearly: properties under 60 rooms sit at 0.894, 60-120 rooms at 0.922, 120-200 rooms at 1.034 and 200 rooms or more at 1.124. High station-front ADR therefore mixes the effect of location itself with a composition effect from large properties clustering near stations.
Re-running the same aggregation with size held to 80-250 rooms gives an ADR index of 1.136 at 0-300 m, 1.050 at 300-600 m, 1.015 at 600-1,000 m and 1.000 at 1,000-2,000 m, narrowing the inner-versus-outer gap from a raw 18.5% to 11.9%. About one third of the gap came from size mix. Put the other way, roughly 12% of the gap survives the adjustment. A location-specific premium does exist, and the structure in which most of it is concentrated in the first 600 m is unchanged after adjusting for size.
| Distance band | Walking equivalent | Properties | ADR index (raw) | Median room count | Properties (80-250 rooms) | ADR index (size-adjusted) |
|---|---|---|---|---|---|---|
| 0-300 m | within 4 min | 65 | 1.181 | 180 rooms | 38 | 1.136 |
| 300-600 m | 5-8 min | 219 | 1.028 | 141 rooms | 121 | 1.050 |
| 600-1,000 m | 8-13 min | 227 | 1.000 | 106 rooms | 113 | 1.015 |
| 1,000-2,000 m | 13-25 min | 501 | 0.963 | 120 rooms | 262 | 1.000 |
Decay steepness varies more than fourfold by station — single-core versus multi-core markets
The shape of the decay differs sharply by station. Comparing median ADR at 0-600 m against 600-2,000 m, Osaka (Umeda) is steepest at +41.9%, followed by Shinjuku at +30.0%, Namba at +27.0% and Shinagawa at +18.7%. Kyoto (+14.0%), Nagoya (+9.1%) and Sapporo (+4.4%) are far gentler, and at Hakata the outer ring is actually 5.6% higher.
This difference can be organized by whether the market is built around the station as a single core, or has a second core separate from the station. Umeda, Shinjuku and Namba are single-core types where the station and the entertainment district overlap, so distance from the station is the same thing as distance from the liveliest area. Hakata, Sapporo and Nagoya, by contrast, are multi-core types with independent entertainment districts 1-2 km from the station — Nakasu and Tenjin, Susukino and Odori, Sakae — so moving away from the station does not necessarily mean moving away from demand.
* Shinjuku (inner n=9) and Shinagawa (inner n=4) have fewer than 10 properties in the inner band and are indicative.
Breaking Hakata’s outer band down by direction makes the structure clearer still. Within the 600-2,000 m ring, properties on the west side (toward Nakasu, Gion and Tenjin) have a median ADR of about ¥16,800 (n=57), above the roughly ¥14,100 (n=66) of Hakata Station’s own 0-600 m ring. The northwest side is about ¥12,700 (n=28) and the southwest about ¥14,000 (n=18) — a spread of nearly 30% within the same distance band depending on direction. Using distance as the sole explanatory variable buries these directional differences in the average. Land appraisal has to state not only “how many meters from the station” but also “in which direction.”
| Direction from Hakata Station (600-2,000 m) | Properties | Median estimated settled ADR | vs station 0-600 m (¥14,100) |
|---|---|---|---|
| West (toward Nakasu, Gion, Tenjin) | 57 | ¥16,800 | +19.1% |
| Southwest (toward Sumiyoshi, Watanabe-dori) | 18 | ¥14,000 | -0.9% |
| Northwest (toward Gofukumachi, Hakata Port) | 28 | ¥12,700 | -10.1% |
Namba as an example: price spread seen in concentric rings
As the representative single-core market, Namba is plotted on a map. Circle position is the property, color is the ADR level and size is the room count. The dashed concentric rings mark the 300 m, 600 m, 1,000 m and 2,000 m band boundaries. High-rate, large-format properties cluster right by the station, and the rate band visibly steps down moving outward. Namba runs about ¥12,400 (n=60) at 0-600 m and about ¥9,800 (n=171) at 600-2,000 m, an inner-versus-outer gap of +27.0%.
Land prices decay five times faster — the asymmetry between land cost and ADR
For the same 2 km rings around the eight stations, we extracted standard sites classified as commercial-use land from the 2026 Land Price Publication, normalized by each station’s median and aggregated by distance band. The result: 5.333 at 0-300 m (N=17), 2.348 at 300-600 m (N=43), 0.977 at 600-1,000 m (N=63) and 0.799 at 1,000-2,000 m (N=161). That is an 85.0% drop from 0-300 m to 1,000-2,000 m — a completely different decay speed from the 18.5% decline in ADR over the same interval.
Expressing this asymmetry as a simple efficiency ratio of “ADR index ÷ land price index,” and setting 0-300 m at 1.00, gives 1.98x at 300-600 m, 4.62x at 600-1,000 m and 5.44x at 1,000-2,000 m. In terms of the room rate generated per yen of land, the structure favors sites further from the station. The value of station-front land is not explained by the room-rate premium alone; it is more natural to read it as pricing in factors beyond rate — occupancy stability, optionality for conversion to another use, and liquidity at exit. For a view that captures land-side constraints including zoning and floor area ratio, see Hotel Development Capacity 2026: Zoning, FAR & Land Price in 5 Markets, which covers five major markets.
That efficiency gap is not fixed, however. Looking at year-on-year change in the same land price data by distance band gives +9.2% at 0-300 m, +9.6% at 300-600 m, +12.3% at 600-1,000 m and +13.8% at 1,000-2,000 m — the further out, the higher the rate of increase. The relative cheapness of outer land is closing from the outside in, so while the present is a favorable moment to capture the efficiency gap, that advantage is thinning year by year.
| Distance band | ADR index | Land price index (commercial) | Standard sites | Median YoY land price | ADR efficiency per unit land |
|---|---|---|---|---|---|
| 0-300 m | 1.181 | 5.333 | 17 | +9.2% | 1.00x |
| 300-600 m | 1.028 | 2.348 | 43 | +9.6% | 1.98x |
| 600-1,000 m | 1.000 | 0.977 | 63 | +12.3% | 4.62x |
| 1,000-2,000 m | 0.963 | 0.799 | 161 | +13.8% | 5.44x |
Development scenario — what it takes for a station-front site to match the same yield
We now translate the distance decay above into a development scenario set at a station of the class found in a regional hub city. Assuming a 700 sqm site, we compare Case A, built on commercial land 0-300 m from the station (assumed land price ¥5.5 million per sqm, FAR 800%), against Case B, built on commercial land 600-1,000 m from the station (assumed land price ¥1.2 million per sqm, FAR 600%). ADR reflects the measured size-adjusted premium (+11.9%), setting A at ¥13,600 and B at ¥12,150. Because our data cannot measure occupancy at the distance-band level, occupancy is fixed at 82% in both cases.
Construction cost starts from the 2025 actual of ¥2.405 million per tsubo for steel-frame construction (about ¥728,000 per sqm) based on MLIT’s Construction Statistics Survey, with inflation during the build period factored in for an assumed 2029 opening. We apply Turner & Townsend’s published forecast of Japanese construction cost inflation (+5.3% in 2026, +5.0% in 2027) and connect it from 2028 onward — where no published figure exists — to our own assumption reflecting the tapering trend in that forecast (+4.5%), compounding to the midpoint of construction for a factor of 1.130 and an effective unit cost of about ¥822,000 per sqm. The GOP margin is set at 40% as a benchmark for select-service hotels.
| Item | Case A: 0-300 m from station | Case B: 600-1,000 m from station Efficiency edge |
|---|---|---|
| Site area | 700 sqm | 700 sqm |
| Floor area ratio | 800% | 600% |
| Gross floor area | 5,600 sqm | 4,200 sqm |
| Rooms | 165 | 124 |
| Assumed land price | ¥5,500,000/sqm | ¥1,200,000/sqm |
| Land cost | ¥3,850 million | ¥840 million |
| Construction cost (inflation included) | ¥4,604 million | ¥3,453 million |
| Total investment | ¥8,454 million | ¥4,293 million |
| Total investment per room | ¥51.2 million | ¥34.6 million |
| Assumed ADR | ¥13,600 | ¥12,150 |
| Assumed occupancy | 82% | 82% |
| Rooms revenue (annual) | ¥672 million | ¥451 million |
| GOP (40%) | ¥269 million | ¥180 million |
| Return on total investment | 3.18% | 4.20% |
For Case A to match Case B’s yield, ADR would have to reach roughly ¥18,000 — that is, +48.0% over Case B. The measured station-front premium is +11.9% after size adjustment, so the shortfall is wide. Alternatively, holding ADR unchanged, the land price would need to fall to about ¥2.56 million per sqm to satisfy the condition. For the same reverse calculation run from the interest-rate side, Policy Rate 1.00%: Break-Even ADR Across Japan’s 8 Hotel Markets runs the numbers for eight major markets.
This does not mean station-front development does not work; it shows that the investment case for station-front land is decided by variables other than the room-rate premium. Judging land purely on rate over-values the station front and under-values the 8-to-17-minute band. Read the other way, that band retains genuine upside: price is nearly flat while land cost alone drops sharply.
This calculation is a mid case that sets the station-front premium at the measured size-adjusted value (+11.9%). Allowing the premium level itself to vary moves Case A’s yield as follows. The pessimistic case assumes the “600-1,400 m price plateau” identified above extends all the way to the station front (premium of 0%); the optimistic case assumes the raw, pre-size-adjustment premium (+18.5%) passes straight through to rate. Both stay within the range this article measured. Case B’s ADR (¥12,150), occupancy, GOP margin and total investment are common to all three cases; only Case A’s ADR moves.
| Scenario | Case A assumed ADR | Case A return on total investment | Case B return on total investment | A−B gap |
|---|---|---|---|---|
| Pessimistic: equivalent to the plateau (premium 0%) | ¥12,150 | 2.84% | 4.20% | 1.36pt |
| Mid: size-adjusted premium +11.9% | ¥13,600 | 3.18% | 4.20% | 1.02pt |
| Optimistic: raw premium +18.5% | ¥14,400 | 3.36% | 4.20% | 0.84pt |
Source: MetroEngines Research & Consulting (modeled) * In all three cases the room count, floor area ratio, land price, construction cost, GOP margin and occupancy are fixed at the assumptions stated in the text; only Case A’s ADR is varied, within the range of the measured premium.
| Sensitivity (return on total investment) | OCC 77% full-year basis | OCC 82% full-year basis | OCC 87% full-year basis |
|---|---|---|---|
| ADR -10%: Case A | 2.69% | 2.86% | 3.03% |
| ADR -10%: Case B | 3.55% | 3.78% | 4.01% |
| ADR as assumed: Case A | 2.98% | 3.18% | 3.37% |
| ADR as assumed: Case B | 3.95% | 4.20% | 4.46% |
| ADR +10%: Case A | 3.28% | 3.50% | 3.71% |
| ADR +10%: Case B | 4.34% | 4.62% | 4.90% |
* This is a simplified calculation intended to illustrate the implications of distance decay; an actual investment decision requires a detailed, deal-specific feasibility study. The land prices and floor area ratios do not refer to any real, specific project.
Land appraisal viewed by distance band
0-600 m: the rate-premium band
The interval where the ADR index steps down from 1.18 to 1.03. Roughly 9% of premium survives even after size adjustment, so location is reflected directly in rate. Published land prices, meanwhile, fall 56% over the same interval — a far steeper slope on the land cost side.
600-1,400 m: the price plateau
In 200 m increments the index is nearly flat at 1.00-1.02. Because price holds while land price alone drops sharply, ADR efficiency per yen of land reaches roughly 4.6-5.4 times the station front. This is the band with the most development headroom left.
Read direction together with distance
In multi-core markets with a second entertainment district, such as Hakata, the same 600-2,000 m band can vary by about 30% depending on direction. Appraising land on “distance × direction” rather than distance alone surfaces candidate sites that had been overlooked.
Summary
What the measurement of 1,012 properties across eight major stations shows is that the location premium is not uniform in distance: it is concentrated in the first 600 m, after which price runs nearly flat out to about a 17-minute walk. About one third of the raw 18.5% price gap is explained by the composition effect of large properties clustering near stations, leaving a location-specific effect of roughly 12% after size adjustment.
Land cost, by contrast, has an order-of-magnitude steeper slope over the same interval, down 85%. ADR efficiency per unit of land cost rises the further you move from the station, reaching 5.4 times the station front in the 1,000-2,000 m band. Land price growth is higher in the outer ring, however, so that gap is on a path to narrow year by year.
Brought back to the practice of site selection: reframe the one-dimensional “minutes from the station” as three layers — a band where price falls (0-600 m), a band where price is flat (600-1,400 m) and a band where price falls again (beyond 1,400 m) — then overlay direction and the core structure of the market. That narrows the field to the candidate sites with the best balance of rate against land cost. The relationship between distance and price is not linear, and that non-linearity is itself where the investment opportunity sits.
Note on the data: ADR figures in this article are estimates based on actual months from February to July 2026 and differ from each property’s actual transacted rates and accounting figures. Distance from the station is straight-line distance measured from the station’s representative coordinates and does not match actual walking distance or time. Bands with fewer than 10 properties are treated as indicative. Published land prices cover standard sites classified as commercial-use land in the 2026 Land Price Publication, and the distribution of standard sites varies by area.
Related reading
- Hotel vs Condo Land Rivalry: ADR-Implied Feasible Land Price Map
- 582 Hotels Opening 2026: 30-Room Luxury vs 200+ Scale Polarization
- Policy Rate 1.00%: Break-Even ADR Across Japan’s 8 Hotel Markets
- Hotel Development Capacity 2026: Zoning, FAR & Land Price in 5 Markets
References and Sources
■ Data sources
For 1,012 business hotels located within a 2 km radius of the representative coordinates of eight major stations, we averaged six months of estimated settled ADR per property from February to July 2026 and aggregated the median by distance band (own analysis). Property coordinates, room counts and categories come from our own property attribute data; station passenger volumes from MLIT National Land Numerical Information, “Station Passenger Volume Data”; and land prices from the Land Price Publication in MLIT’s Real Estate Information Library (2026, commercial-use classification).
■ Modeling assumptions
Distance is straight-line distance from the station’s representative coordinates, assigned to four bands: 0-300 m / 300-600 m / 600-1,000 m / 1,000-2,000 m. The ADR index is each property’s ADR normalized by the median for that station’s 2 km ring. The development scenario assumes a 700 sqm site, a 40% GOP margin (a benchmark for select-service hotels) and 82% occupancy (full-year basis, fixed and common to both cases); construction cost starts from the 2025 actual of ¥2.405 million per tsubo for steel-frame construction based on the Construction Statistics Survey and is compounded to the midpoint of construction for an assumed 2029 opening (factor of 1.130), giving about ¥822,000 per sqm. Case A ADR in the scenario table is Case B’s ADR multiplied by the station-front premiums measured in the text (0% / +11.9% / +18.5%); room count, land price, floor area ratio, construction cost, GOP margin and occupancy are unchanged from the assumptions in the text across all three cases.
■ Limitations and caveats
ADR is an estimate and differs from each property’s actual transacted rates and accounting figures (cross-checked against property-level disclosure by listed hotel REITs, the median error is 7.5% on a basis of 184 property-months in April-May 2026, and 6.0% for the business and city hotel categories). Distance is straight-line and therefore does not match actual walking distance or time, and bands with fewer than 10 properties (Shinjuku and Shinagawa at 0-600 m, the 0-200 m band and so on) are indicative. Occupancy cannot be measured at the distance-band level, so it is fixed in the modeling and any occupancy difference by distance is outside the scope of this article. The distribution of standard sites in the Land Price Publication also varies by area, so the number of standard sites is not uniform across bands. The “+18.5%” and “+11.9%” figures in the text are both declines out to 1,000-2,000 m measured against a 0-300 m base; expressed instead as a station-front premium against an outer-band base, the same measurements become +22.6% and +13.6% respectively (the -85.0% for published land prices uses the same 0-300 m base, so the two remain comparable). The development scenario is a simplified calculation intended to illustrate the implications of distance decay and does not refer to any real, specific project.
■ Market data
- MetroEngines Research & Consulting — estimated settled ADR (business hotels within 2 km of 8 stations, N=1,012 properties, February-July 2026) and property attributes (room count, category, coordinates)
■ Government statistics and public data
- MLIT Real Estate Information Library — Land Price Publication (2026, commercial-use classification)
- MLIT National Land Numerical Information, “Station Passenger Volume Data”
- MLIT “Construction Statistics Survey” — planned construction cost by structure type (construction cost assumptions)
■ Industry reports
- Turner & Townsend, “Trends shaping Japan’s construction market in 2026” — forecast Japanese construction cost inflation (5.6% in 2025 / 5.3% in 2026 / 5.0% in 2027)