

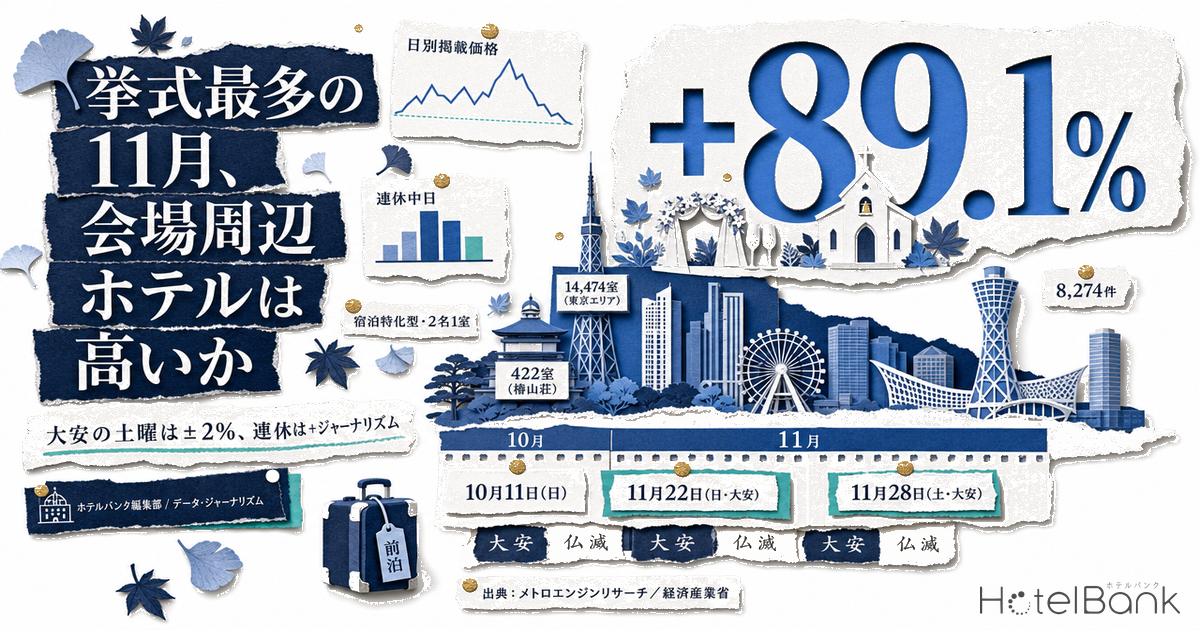
November is the month with the most weddings in Japan. Monthly statistics from the Ministry of Economy, Trade and Industry (METI) show that in 2024, November handled 8,274 ceremonies and receptions — 13.1% of the annual total and the highest of any month. So do hotels around wedding venues price in that demand on the days when ceremonies cluster? We tested this using daily listed prices for October–November 2026, aggregated within a 1km radius of major wedding venues in Tokyo, Yokohama and Kobe. The short answer: on “Taian Saturdays” — the days when ceremonies concentrate most — prices around the venues barely move. What did move prices was the long weekend.
Metric Definitions Used in This Article
- Listed price: the all-plan average of the selling prices each property publishes on OTAs and other channels (double occupancy, per-room rate, tax-included). All daily comparisons in this article are on this listed-price basis.
- ADR (estimated transacted rate): an estimated transacted rate (tax-excluded equivalent) calculated by applying a segment-specific correction factor to the lowest published plan level each property lists on OTAs (double occupancy, per-room rate, tax-included). Cross-checked against property-level results disclosed by listed hotel REITs (91 properties, most recent 3 months), the median error is approximately 7%. These are estimates and differ from each property’s actual transacted rates and accounting figures. Area-level ADR is the median of the properties covered (the level of a typical property in that area).
- Rokuyo: the six-day Japanese calendar cycle — Taian, Tomobiki, Sensho, Senbu, Shakko and Butsumetsu. By custom, Taian and Tomobiki are preferred for weddings and Butsumetsu is avoided. The Rokuyo dates in this article are computed from the lunar calendar and cross-checked against published calendars.
- Data sources: prices = MetroEngines Research / ceremony counts = METI “Current Survey of Selected Service Industries” / guest reviews = HotelBank Editorial Team analysis
- — November is the peak month for weddings (8,274 ceremonies in 2024, 13.1% of the year — METI). Even so, no ceremony-day premium appears in the daily listed prices of hotels around the venues.
- — The gap between Taian Saturdays and non-Taian Saturdays runs from −7.9% to +1.8%. Rokuyo alone is not a demand indicator; it has to be read together with day of week and holiday placement.
- — What moved prices was the long weekend, at +22.4% to +89.1% versus an ordinary Sunday. November 22, 2026 is a rare day where Taian, Sunday and a following public holiday all coincide.
- — Wedding mentions in guest reviews cluster at the venue hotels. Only 5 limited-service properties nationwide have two or more wedding-related mentions, so guest stays by wedding attendees are almost invisible in reviews.
- — Room supply within 1km of a venue varies by up to 34x (14,474 rooms around Imperial Hotel Tokyo vs. 422 rooms around Hotel Chinzanso Tokyo). A venue’s prestige and the depth of nearby inventory are entirely different variables.
Confirming November as the peak wedding month with official statistics
The seasonality of weddings is widely shared as industry lore, but we wanted official statistics to back it first. METI’s “Current Survey of Selected Service Industries” continuously tracks the monthly number of ceremonies and receptions handled by companies in the wedding-hall business. Computing the monthly share from that data, November is the highest month in 2019 (pre-pandemic) as well as in the most recent years, 2023 and 2024.
In 2024, of 63,190 ceremonies for the year, November accounted for 8,274 (13.1%), followed by October at 7,191 (11.4%) and March at 6,498 (10.3%). In 2019, November accounted for 11,502 of 86,304 (13.3%). Annual volume itself is down 27% versus 2019, but the shape of the November peak has held throughout the five years. The lowest month is August (3,038 in 2024, 4.8%) — a 2.7x gap versus November.
Source: compiled by the HotelBank Editorial Team from METI “Current Survey of Selected Service Industries” (wedding-hall business, enterprise survey)
One caveat: this survey captures companies whose principal business is operating wedding halls, so a large share of the weddings handled by hotel banquet departments falls outside its coverage. Even so, the seasonal shape — peaks in November and October, troughs in August and January — can reasonably be taken as broadly common to hotel weddings as well. That autumn is the wedding peak can be treated as a given for the analysis that follows.
“Wedding” shows up in reviews of venue hotels — almost never in nearby limited-service properties
Next we looked at which hotels have wedding and wedding-attendance context appearing in their guest reviews. Across posts from the most recent 24 months, among properties with at least 20 total reviews, 75 properties nationwide had three or more mentions relating to weddings. Only 9 properties reached eight or more mentions. Measured by volume, weddings are an extremely rare topic in accommodation reviews.
What matters is the distribution. The properties at the top of the mention counts are, without exception, full-service hotels with wedding facilities inside the building. Run the same aggregation restricted to limited-service properties (business hotels), and only 5 properties nationwide clear even two mentions. Attendees certainly must be staying somewhere — but those stays almost never show up in the reviews of walkable limited-service hotels under the word “wedding.”
| Property | Location | Total reviews | Wedding-related mentions | Mention rate |
|---|---|---|---|---|
| Kobe Meriken Park Oriental Hotel (神戸メリケンパークオリエンタルホテル) | Chuo-ku, Kobe, Hyogo | 4,246 | 14 | 0.33% |
| Hotel New Grand (ホテルニューグランド) | Naka-ku, Yokohama, Kanagawa | 3,411 | 14 | 0.41% |
| Imperial Hotel Tokyo (帝国ホテル東京) | Chiyoda-ku, Tokyo | 3,037 | 14 | 0.46% |
| Hotel Chinzanso Tokyo (ホテル椿山荘東京) | Bunkyo-ku, Tokyo | 2,215 | 12 | 0.54% |
| Kakegawa Grand Hotel (掛川グランドホテル) | Kakegawa, Shizuoka | 373 | 12 | 3.22% |
| Strings Hotel Nagoya (ストリングスホテル名古屋) | Nakamura-ku, Nagoya, Aichi | 697 | 11 | 1.58% |
| THE ORIENT | Chuo-ku, Kobe, Hyogo | 1,087 | 10 | 0.92% |
| King Ambassador Hotel Kumagaya (キングアンバサダーホテル熊谷) | Kumagaya, Saitama | 582 | 8 | 1.37% |
| Mito Plaza Hotel (水戸プラザホテル) | Mito, Ibaraki | 323 | 7 | 2.17% |
| Kobe Portopia Hotel (神戸ポートピアホテル) | Chuo-ku, Kobe, Hyogo | 3,751 | 7 | 0.19% |
Source: HotelBank Editorial Team analysis (NLP analysis of guest reviews over the most recent 24 months. Properties with 20+ total reviews and 7+ wedding-related mentions, listed by mention count. Top 10 of the 75 qualifying properties nationwide with 3+ mentions)
One property in Meguro-ku, Tokyo also ranked highly on wedding mentions, but it has been closed since October 1, 2025 following the expiry of its building lease, and is therefore outside the scope of a 2026 autumn trade-area analysis; it is excluded from the table above. The operating company has not set a reopening date.
Mention rates reveal a different picture. Kobe Meriken Park Oriental Hotel has 14 mentions against 4,246 reviews (0.33%), and Imperial Hotel Tokyo 0.46% against 3,037. By contrast, venue hotels in regional core cities — Kakegawa Grand Hotel (12 of 373, 3.22%) and Mito Plaza Hotel (7 of 323, 2.17%) — post mention rates 5 to 10 times those of large urban hotels. The narrower the choice of wedding venues in a region, the more likely it is that accommodation demand and the wedding are completed inside the same building. Reviews there read like “we stayed with the family after our daughter’s wedding” — stays and weddings on a continuum.
Room supply within 1km of the venue — 14,474 rooms around the Imperial, 422 around Chinzanso
Where attendees can stay is determined by the room stock around the venue. Taking the venue hotels that ranked highest as centers, we aggregated the accommodation supply within a 1km radius. Even among “urban wedding venues,” the depth of the surrounding supply differs completely.
| Central venue hotel | Properties within 1km | Total rooms | Limited-service | Full-service | Limited-service share |
|---|---|---|---|---|---|
| Imperial Hotel Tokyo Chiyoda-ku, Tokyo | 98 | 14,474 rooms | 51 properties / 8,417 rooms | 23 properties / 4,853 rooms | 58% |
| Hotel New Grand Naka-ku, Yokohama, Kanagawa | 44 | 3,704 rooms | 13 properties / 1,998 rooms | 8 properties / 1,135 rooms | 54% |
| Kobe Meriken Park Oriental Hotel Chuo-ku, Kobe, Hyogo | 18 | 2,913 rooms | 7 properties / 1,120 rooms | 8 properties / 1,675 rooms | 38% |
| Hotel Chinzanso Tokyo Bunkyo-ku, Tokyo | 5 | 422 rooms | — | 2 properties / 398 rooms | 0% |
Source: MetroEngines Research (1km radius extracted from each venue’s latitude and longitude. Limited-service = business hotel segment; full-service = city, deluxe and resort segments. Simple lodgings and other categories that fall into neither are excluded from the breakdown, so the components do not sum to total rooms)
The 1km radius centered on Imperial Hotel Tokyo (covering Ginza, Shimbashi and Shiodome) holds 98 properties and 14,474 rooms, 58% of them limited-service. Attendees have an environment where they can choose a price band and still stay nearby. Yokohama’s Hotel New Grand zone has 44 properties and 3,704 rooms, the largest within it being Hyatt Regency Yokohama (opened May 2020, 315 rooms). The Kobe Meriken Park zone has 18 properties and 2,913 rooms, but the limited-service share is a low 38%, with full-service accounting for 58%.
Hotel Chinzanso Tokyo is the opposite case. Within 1km there are just 5 properties and 422 rooms, and 398 of those rooms sit in only two buildings — the hotel itself and Rihga Royal Hotel Tokyo — with not a single limited-service property. This follows from its Mejirodai/Sekiguchi residential setting: pre-wedding-night demand from attendees cannot be absorbed within walking distance and structurally flows toward Iidabashi and Shinjuku. A venue’s prestige and the depth of nearby supply are entirely separate variables.
Distribution of accommodation within 1km of Hotel New Grand (Naka-ku, Yokohama) — properties with 20+ rooms, 32 properties / 3,604 rooms. Circle size indicates room count. Source: MetroEngines Research
Daily listed prices for November 2026 — no price step-up on Taian Saturdays
Here is the core of the analysis. For the 61 days from October 1 to November 30, 2026, we aggregated the daily listed prices (double occupancy, all-plan average) of limited-service hotels within 1km of each of the three venues. The typical attendee stay is “one night, two people, the night before,” and price movement shows up most clearly not at the venue hotel itself but at the limited-service properties within walking distance.
In November 2026 there are two Taian days falling on a weekend: Sunday November 22 and Saturday November 28. In October, Sunday October 18 and Saturday October 24 are Taian. Weddings generally concentrate most heavily on Taian Saturdays, which in this period means October 24 and November 28.
Source: MetroEngines Research (Imperial Hotel Tokyo zone N=43 properties / Hotel New Grand zone N=11–12 properties / Kobe Meriken Park zone N=6–7 properties; all limited-service, double occupancy, all-plan average of listed prices)
Lining up the nine Saturdays in Yokohama (Hotel New Grand zone): October 24 (Taian) at ¥58,900 and November 28 (Taian) at ¥51,800, against November 21 (Butsumetsu) at ¥63,800. The Butsumetsu Saturday — the day most avoided under Rokuyo — runs 15% above the average of the two Taian Saturdays (¥55,300). Across the nine Saturdays, the two Taian days average ¥55,300 and the seven non-Taian days ¥54,300, a difference of just +1.8%.
Source: MetroEngines Research (limited-service properties within 1km of Hotel New Grand, Naka-ku, Yokohama; N=11–12 properties; the nine Saturdays of October–November 2026)
The result is the same across all three markets and both segments. The average gap between Taian and non-Taian Saturdays is −1.3% in Tokyo (limited-service), +1.8% in Yokohama (limited-service) and −7.9% in Kobe (limited-service). For full-service properties it is −1.5% in Tokyo, −1.5% in Yokohama and −12.8% in Kobe. Kobe’s larger negative comes from Saturday November 14 — the night before the Kobe Marathon, discussed below — sitting on the non-Taian side; excluding that single day, Kobe is essentially flat like the other cities. Either way, no Taian price premium is observable.
What moved prices was the long weekend — up to +89% versus an ordinary Sunday
Within the same 61 days, there are days when prices clearly jumped: the two Sundays followed by a public holiday — October 11 (with Sports Day on the 12th) and November 22 (with Labor Thanksgiving Day on the 23rd).
Source: MetroEngines Research (the nine Sundays of October–November 2026 split into 2 “long-weekend middle days” and 7 “ordinary Sundays,” then averaged. Property counts per zone are the same as the preceding charts)
In Yokohama’s limited-service segment, the ordinary-Sunday average of ¥28,300 rises to ¥53,400 on long-weekend days, or +89.1%. Kobe goes ¥21,100 → ¥35,200 (+66.8%) and Tokyo ¥50,000 → ¥61,200 (+22.4%). Full-service properties point the same way: Yokohama +48.0%, Kobe +60.4%, Tokyo +10.2%. November 22 is also a Taian day, but the identical shape appears on October 11 — and October 11 is Butsumetsu. This contrast settles it: what moves prices is the long weekend, not Rokuyo.
Kobe offers another contrasting case. The Kobe Marathon 2026 is scheduled for Sunday, November 15, 2026. On the preceding Saturday, November 14, the Kobe Meriken Park zone stands out at ¥45,600 for limited-service (other Saturdays: ¥33,200–¥40,600) and ¥102,100 for full-service (other Saturdays: ¥73,300–¥87,600). A mass-participation marathon on the scale of 20,000 runners shows up clearly in prices as pre-event-night demand. How far autumn marathons move the previous night’s accommodation prices is examined for Kanazawa, Mito and Toyama as well in Japan’s Autumn Marathons 2026: Race-Eve Hotel Rates Up to +49.1%. In the same month of November, the concentration of weddings does not appear, while the marathon does.
Why weddings do not show up in prices
The reason is the absolute volume of demand. It is worth walking through the orders of magnitude. What follows is a simple calculation built entirely from published figures and explicitly stated assumptions — it is not a measurement.
Assumptions
- The average number of invited guests at a reception or wedding party is 52.0 (Zexy Wedding Trend Survey 2024, published October 25, 2024)
- Assuming 20% of them are out-of-town guests who require accommodation, that is 10.4 people per wedding
- Converted at double occupancy, one wedding generates roughly 5.2 room-nights of demand
- Ceremonies and receptions handled by the wedding-hall business totaled 8,274 nationwide in November 2024 (METI) = an average of 276 per day
Sensitivity: the conclusion does not change when the out-of-town share changes
The calculation above depends on setting “out-of-town guests requiring accommodation = 20% of invited guests.” We varied that share from 10% to 30% and recomputed how many same-day weddings would be needed to fill 5% of the 1km-radius room inventory in a single day.
| Out-of-town guest share | Rooms per wedding | New Grand zone (3,704 rooms, 5% = 185 rooms) | Imperial Hotel Tokyo zone (14,474 rooms, 5% = 724 rooms) |
|---|---|---|---|
| 10% (conservative) | 2.6 rooms | approx. 71 weddings | approx. 278 weddings |
| 20% (mid case used in the text) | 5.2 rooms | approx. 36 weddings | approx. 139 weddings |
| 30% (aggressive) | 7.8 rooms | approx. 24 weddings | approx. 93 weddings |
Even at the most aggressive 30%, the New Grand zone would need roughly 24 of the national daily average of 276 weddings to fall inside the same 1km radius on the same day. For the Imperial Hotel Tokyo zone it would take about 93 — a third of the entire national daily volume. However the share is set, the conclusion holds: weddings do not reach the scale needed to move trade-area prices.
Apply that to Hotel New Grand’s 3,704-room zone. Filling 5% of the 1km room inventory (185 rooms) in a single day would require roughly 36 weddings the same day. For the Imperial Hotel Tokyo zone’s 14,474 rooms it would take about 139. Against that, ceremonies on a wedding-hall-business basis run to just 276 per day nationwide. That is not a scale at which dozens of weddings converge on one trade area on the same day.
On top of that, an attendee’s stay always competes with the option of not staying at all. For an urban venue, most attendees can complete the trip same-day, and overnight stays are limited to distant relatives and some friends. Even in the peak wedding month, wedding-driven accommodation demand stays on the order of a few percent of trade-area inventory and is buried under the long-weekend waveform of leisure demand and the pre-event-night demand of sporting events. That is the explanation for “November is the peak wedding month, yet prices do not move.”
Autumn rate levels themselves are rising — November ADR in key wards is up +5.9% to +25.0% YoY
Weddings may be invisible on a daily basis, but the rate level for November as a whole is clearly up on last year. We compared the estimated transacted ADR of the key wards where wedding venues cluster, between November 2025 and November 2026.
Source: MetroEngines Research (estimated transacted ADR, area median. N = Chiyoda-ku 78 properties / Bunkyo-ku 17→14 / Naka-ku, Yokohama 49→48 / Nishi-ku, Yokohama 15→16 / Nakamura-ku, Nagoya 72→60. November 2026 is an estimate based on listed levels as of the survey date)
The largest movers are Nishi-ku, Yokohama (Minato Mirai) at ¥20,700 → ¥25,600, or +23.9%, and Nakamura-ku, Nagoya (Nagoya Station) at ¥12,000 → ¥15,000, or +25.0%. Chiyoda-ku runs ¥19,300 → ¥20,900 (+8.0%), Bunkyo-ku ¥15,600 → ¥16,500 (+5.9%) and Naka-ku, Yokohama ¥12,500 → ¥13,300 (+5.9%). For Chuo-ku, Kobe — where wedding venues concentrate — the November 2025 sample covered only 32 properties, about half a normal month (around 63), so it does not support a year-on-year comparison; on an October basis it runs ¥14,400 → ¥14,800, or +3.1%.
In other words, autumn rates are being pushed up overall, but the drivers are inbound demand, autumn-foliage travel and holiday placement — not weddings. November being expensive and November having the most weddings are two separate phenomena occurring in the same month. Which autumn month the rate peak lands in also varies by prefecture; that classification is organized into four types across all 47 prefectures in Japan Autumn ADR 2026: 20 Prefectures Peak in Nov, Kyoto +81.8%.
The revenue opportunity for operators — how to make invisible demand visible
None of the above means wedding-driven accommodation demand does not exist. If anything the reverse: it reliably occurs yet does not appear in market prices, which is closer to saying there is demand sitting there that has not yet been priced in.
First, venue hotels hold a clear advantage. Properties like Kobe Meriken Park Oriental Hotel and Imperial Hotel Tokyo, where weddings and stays are discussed within the same review, have evidence that they are capturing attendees in-house. That funnel already works, and there is further headroom depending on how the accommodation plans are designed. A late checkout on the day of the ceremony, or a design that supports securing several rooms at once, is value only a property with its own venue can offer.
Second, limited-service hotels within walking distance still have untouched territory. The fact that only 5 limited-service properties nationwide register wedding mentions suggests either that attendees are not reaching them, or that when they do, the stay leaves no impression worth writing about. A venue’s annual calendar is known to the venue itself, and Taian weekends are predictable months in advance. A day of predictable demand that is not reflected in price is also a day with revenue-management upside. For the distribution of how much properties actually add on weekends, Weekend Premium 2026: Tokyo Business 24% vs Hakone Ryokan 10%, N=659 makes the headroom visible from the spread across 659 properties.
Third, on daily rate design, the overlap between a long weekend and a Taian day is worth watching. November 22, 2026 combines three conditions that rarely align — Taian, Sunday and a public holiday the next day — and prices did in fact jump. Conversely, November 28 is a Taian Saturday yet sits at the lowest level of the nine Saturdays. Even among Taian days, the outcome differs entirely depending on whether the date coincides with a long weekend. Rokuyo should not be treated as a standalone demand indicator; it needs to be evaluated together with day of week and holiday placement.
Summary
Examining the peak wedding month of November from three angles — official statistics, guest reviews and daily listed prices — yields the following. (1) November being the peak wedding month is confirmed in METI’s monthly statistics (8,274 ceremonies in 2024, 13.1% of the year). (2) Weddings appear in guest reviews concentrated at venue hotels and are almost never observed at limited-service hotels within walking distance. (3) In daily listed prices for October–November 2026, the gap between Taian and non-Taian Saturdays runs only −7.9% to +1.8%, with no confirmable premium on ceremony-heavy days. (4) What actually moved prices was the long weekend, at +22.4% to +89.1% versus an ordinary Sunday.
Weddings do generate accommodation demand, but at a scale on the order of a few percent of trade-area room inventory — not enough to move market prices. Turned around, that demand is not currently priced in. For venue hotels, which hold the predictable information of a venue calendar, and for the limited-service hotels within walking distance of them, autumn weekends remain a window with room left to capture.
⚠ Note on prices for future dates: the daily listed prices for October–November 2026 and the November estimated transacted ADR discussed in this article are both estimates based on selling prices published on OTAs and other channels as of the survey date (August 2026), and will fluctuate as plans are added and rates adjusted closer to the check-in date. Rates currently set high may fall at the last minute, and the reverse is equally possible.
Related Reading
- Shichi-Go-San Weekend: 22 Private-Dining Ryokan, ¥57,500 vs ¥71,000
- Intra-Prefecture ADR Gaps 2026: Median 2.74x, Okinawa Widest at 5.86x
- Asian Para Games 2026: Aichi Weekdays Run 12pt Above the Next Week
- Sumo Kyushu Basho 2026: Fukuoka Weekday Rates +9.7% Actual, +3.3% Now
- Japan’s Autumn Marathons 2026: Race-Eve Hotel Rates Up to +49.1%
- Japan Autumn ADR 2026: 20 Prefectures Peak in Nov, Kyoto +81.8%
- Weekend Premium 2026: Tokyo Business 24% vs Hakone Ryokan 10%, N=659
- Hotel Pricing on Cruise Port Days: ADR Premium Analysis for Yokohama, Kobe & Naha
References and Sources
■ Government statistics
■ Industry surveys and company materials
- Recruit Co., Ltd., “Zexy Wedding Trend Survey 2024” (published October 25, 2024)
- Meguro Gajoen Co., Ltd., “Notice of the End of Operations at Hotel Gajoen Tokyo”
- Kobe Marathon 2026 official site (scheduled for November 15, 2026)
- Hyatt Japan K.K., “Press materials, April 2026” (used to verify the opening year and room count of Hyatt Regency Yokohama)
■ Data sources
Ceremony counts = METI “Current Survey of Selected Service Industries,” wedding-hall business, monthly actuals (e-Stat table ID 0004027639). Daily listed prices = OTA-published selling prices for October 1 to November 30, 2026 (double occupancy, per-room, tax-included, all-plan average), collected daily by MetroEngines Research. Estimated transacted ADR = monthly median by municipality/ward. Property and room counts within 1km = extracted within a radius centered on each venue’s latitude and longitude. Wedding-related mentions = NLP analysis of guest reviews over the most recent 24 months (HotelBank Editorial Team analysis).
■ Calculation assumptions
Average invited guests of 52.0 (Zexy Wedding Trend Survey 2024); out-of-town guests requiring accommodation set at 20% of invited guests (sensitivity tested at 10%–30%); converted at double occupancy. Absorbing 5% of the 1km-radius room inventory in a single day was set as the threshold for “a scale that could appear in prices.” Ceremony counts use the national figure on a wedding-hall-business basis (8,274 in November 2024 = an average of 276 per day) and do not include ceremonies held at hotels or dedicated ceremonial halls outside that scope. Rokuyo dates are computed from the lunar calendar and cross-checked against published calendars.
■ Limitations and caveats
(1) Prices are listed prices and estimated transacted ADR, and differ from actual transacted rates and accounting figures. (2) Because October–November 2026 are future dates, the estimated transacted ADR is on a listed-snapshot basis while the comparison period of the same months in 2025 is on a confirmed-history basis — the calculation bases differ. Year-on-year comparisons are limited to reading the direction of the level. (3) For Chuo-ku, Kobe, the November 2025 sample covered 32 properties, about half a normal month (59–64), so it was excluded from the year-on-year calculation and substituted with an October basis. (4) Review analysis counts posts in which words such as “wedding” appear, not the number of actual stays made for the purpose of attending one. The absence of wedding mentions does not mean attendees are not staying. (5) This article describes price differences on specific dates and does not assert causation.
■ Market data
- MetroEngines Research — daily listed prices (October 1 to November 30, 2026, double occupancy, all-plan average), estimated transacted ADR (monthly by municipality/ward), accommodation properties and room counts within a 1km radius
- HotelBank Editorial Team analysis — NLP analysis of guest reviews (most recent 24 months, wedding-related mentions)
Source: Hyatt Japan K.K., “Press materials, April 2026”