

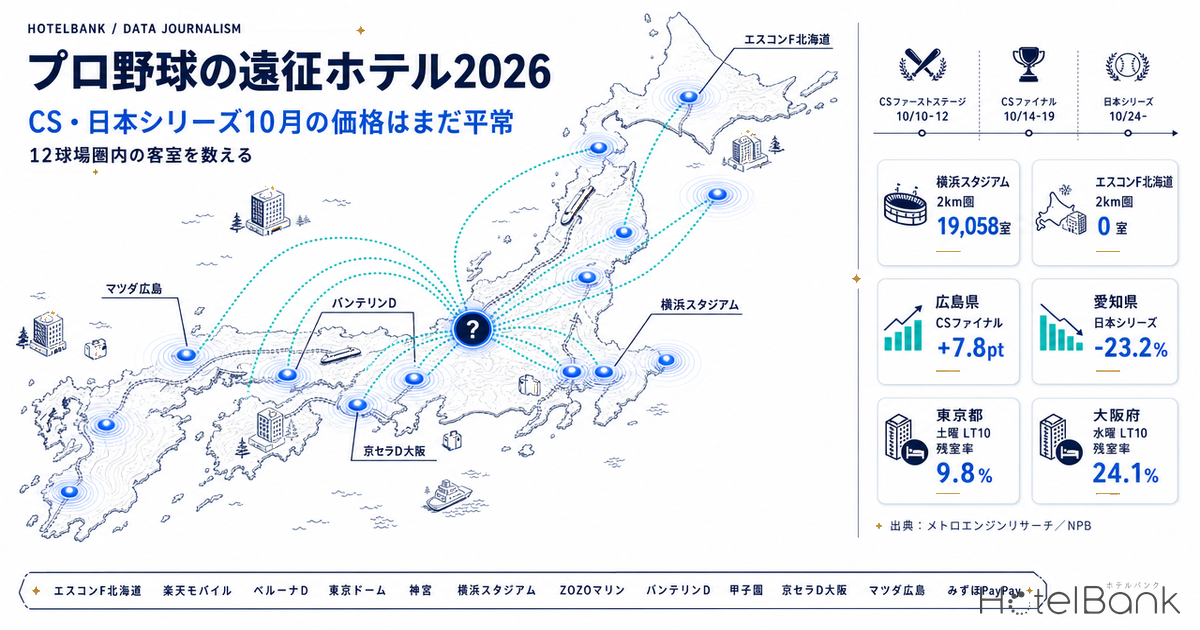
According to Nippon Professional Baseball’s (NPB) official calendar, the 2026 Climax Series (CS) First Stage runs October 10 (Sat) through October 12 (Mon) in both the Central and Pacific Leagues, and the Final Stage runs October 14 (Wed) through October 19 (Mon). The Japan Series opens on October 24 (Sat). The dates are fixed, but which cities will host games is not settled until the regular-season standings and the CS results are decided. As a source of lodging demand, this is an unusual case of “conditional event demand.”
This article counts the guest-room supply within concentric radii of each of the 12 clubs’ home ballparks, and examines how daily listed prices and booking pace for October are moving at this point. To state the conclusion first: at the 80-days-out cross-section, the only things visible in either price or inventory are already-confirmed calendar factors — the three-day weekend, major concerts, international sporting events and Halloween. No movement attributable to the postseason has yet been observed in any market.
Metric Definitions Used in This Article
- Listed price: the average of the selling prices each property publishes on OTAs and other channels (two guests per room, price per room, tax included, averaged across all plans from room-only to meals-included). Area-level figures are the median of the daily average price of the covered properties, representing the price level of a typical property in that area. This differs from actual transacted prices.
- Occupancy (estimated, based on OTA-listed inventory): the share of rooms sold against total rooms in the area (an estimate based on OTA-listed inventory). The formula is (total rooms − remaining rooms) ÷ total rooms. Because it is an estimate based on the depletion of inventory offered on OTAs, it differs from a property’s true overall occupancy. In this article it is used only at the prefecture level; occupancy for individual properties is not calculated.
- LT (lead time): the number of days before the check-in date. LT0 is same-day. “The LT80 cross-section” refers to the observation taken 80 days before the check-in date.
- Data sources: MetroEngines Research (room supply, listed prices, booking pace); Nippon Professional Baseball, “2026 Central/Pacific League Regular-Season Schedule” (dates)
- — Dates fixed, venues unfixed. The CS runs October 10-19 and the Japan Series opens October 24. The host cities are not determined until the regular season and the CS produce results — this is “conditional demand.”
- — At 80 days out, only confirmed events are moving the market. For the CS Final Stage (Oct 14-19), 8 of the 11 ballpark markets for which a figure could be calculated stayed within ±5% of same-weekday baseline days.
- — Capacity is polarized by ballpark. Yokohama Stadium has 19,058 rooms within 2km, while ES CON FIELD HOKKAIDO and Belluna Dome have zero qualifying rooms within 2km. Demand there must spill into adjacent submarkets.
- — Booking pace points to the same conclusion. At the LT80 cross-section, the only prefecture clearly above its baseline days in estimated occupancy was Hiroshima (+7.8pt) — and that date already has a confirmed major concert in the city, so it cannot be attributed to the postseason.
- — Three to ten days from confirmation to first pitch, with 10-20% of inventory left. At LT10 on Saturdays the remaining-room rate is 9.8% in Tokyo and 10.2% in Miyagi; on weekdays it is 24.1% in Osaka and 25.3% in Hiroshima (based on actual June-July 2026 check-in dates).
Dates fixed, venues unfixed — three demand windows line up in October
The 2026 Climax Series schedule published by NPB is identical day-for-day between the Central League (2026 JERA Climax Series Central) and the Pacific League (2026 PERSOL Climax Series Pacific). The First Stage runs three days from October 10 to 12 (reserve day October 13); the Final Stage runs six days from October 14 to 19 (reserve days October 20 and 21). The Japan Series opens on October 24, and NPB’s October schedule lists October 24 and 25 at the Central League home ballpark, October 27 through 29 at the Pacific League home ballpark, and October 31 back at the Central League home ballpark.
What matters here is that the host ballpark at every stage is determined by standing. The CS First Stage is played at the home ballpark of the league’s second-place club, and the Final Stage at that of the first-place club. For the Japan Series, the venue is set only once the pairing of league champion and CS winner is confirmed. In other words, October lodging demand has a structure in which the dates are fixed first and the cities where demand will occur are decided afterwards. For contrast, a single-day event whose venue is known far in advance produces a very different pattern in the surrounding market — as seen with the 2026 NPB All-Star Game at Toyama Alpen Stadium, the first there in 30 years.
| Stage | Dates | Reserve days | Host ballpark |
|---|---|---|---|
| CS First Stage (Central & Pacific) | Oct 10 (Sat) – 12 (Mon) | Oct 13 (Tue) | Home of each league’s 2nd-place club |
| CS Final Stage (Central & Pacific) | Oct 14 (Wed) – 19 (Mon) | Oct 20 (Tue), 21 (Wed) | Home of each league’s 1st-place club |
| Japan Series Games 1-2 | Oct 24 (Sat), 25 (Sun) | — | Central League home ballpark |
| Japan Series Games 3-5 | Oct 27 (Tue) – 29 (Thu) | — | Pacific League home ballpark |
| Japan Series Game 6 | Oct 31 (Sat) | — | Central League home ballpark |
Source: compiled by the HotelBank Editorial Team from Nippon Professional Baseball, “2026 Central/Pacific League Climax Series Schedule” and “2026 Central/Pacific League Regular-Season October Schedule”
Note also that October 10 to 12 forms a three-day weekend including Sports Day (October 12), overlapping entirely with the CS First Stage. That long weekend is a period when supply and demand also shift from an inbound perspective; the overlap with Taiwan’s Double Ten Day (October 10) is examined separately in Double Ten x Sports Day: Japan’s Oct 9-12 Capacity at 76 Days Out. This article deals with travel demand generated by a domestic sporting event, so the perspective differs even for the same dates.
Counting capacity around the 12 ballparks — two have no rooms within 2km
Where travel demand lands is determined by how many guest rooms sit around the ballpark. Using the properties tracked by MetroEngines Research for which a room count is registered, we aggregated the number of rooms within radii of 1km, 2km, 3km, 5km and 10km of each of the 12 ballparks.
Source: MetroEngines Research; compiled by the HotelBank Editorial Team
The thickest 2km supply belongs to Yokohama Stadium at 19,058 rooms, of which 13,513 are within 1km. The lodging cluster of Kannai and Sakuragicho is effectively the ballpark’s walking radius. Meiji Jingu Stadium follows with 14,787 rooms, Tokyo Dome with 14,360, and MAZDA Zoom-Zoom Stadium Hiroshima with 13,954.
At the other end, ES CON FIELD HOKKAIDO and Belluna Dome have zero qualifying rooms within a 2km radius. Even at 3km they reach only 297 and 70 rooms respectively, and only at 5km do they reach 561 and 700. Hanshin Koshien Stadium is also thin at 623 rooms within 2km, as is Vantelin Dome Nagoya at 393. At these ballparks demand cannot be absorbed locally and must flow into adjacent submarkets.
| Ballpark | Location | 1km | 2km | 3km | 5km | 10km |
|---|---|---|---|---|---|---|
| Yokohama Stadium | Yokohama, Kanagawa | 13,513 | 19,058 | 21,114 | 24,555 | 31,338 |
| Meiji Jingu Stadium | Shinjuku, Tokyo | 990 | 14,787 | 52,661 | 105,193 | 228,283 |
| Tokyo Dome | Bunkyo, Tokyo | 6,216 | 14,360 | 36,873 | 150,597 | 226,380 |
| MAZDA Hiroshima | Hiroshima, Hiroshima | 4,038 | 13,954 | 20,392 | 22,479 | 23,540 |
| Kyocera Dome Osaka | Osaka, Osaka | 1,071 | 9,535 | 55,115 | 118,812 | 146,539 |
| Rakuten Mobile Park Miyagi | Sendai, Miyagi | 268 | 5,721 | 14,750 | 17,634 | 19,664 |
| ZOZO Marine | Chiba, Chiba | 1,205 | 4,355 | 4,858 | 5,429 | 19,145 |
| Mizuho PayPay Dome | Fukuoka, Fukuoka | 1,634 | 2,249 | 4,248 | 31,181 | 50,277 |
| Hanshin Koshien | Nishinomiya, Hyogo | 549 | 623 | 722 | 2,112 | 9,933 |
| Vantelin Dome | Nagoya, Aichi | 23 | 393 | 1,733 | 19,807 | 45,500 |
| ES CON FIELD HOKKAIDO | Kitahiroshima, Hokkaido | 0 | 0 | 297 | 561 | 1,561 |
| Belluna Dome | Tokorozawa, Saitama | 0 | 0 | 70 | 700 | 2,847 |
Unit = guest rooms. Aggregated from properties tracked by MetroEngines Research for which a room count is registered. The radii of Tokyo Dome and Meiji Jingu Stadium, and of Kyocera Dome Osaka and Hanshin Koshien Stadium, partially overlap. Source: MetroEngines Research; compiled by the HotelBank Editorial Team
Source: MetroEngines Research; compiled by the HotelBank Editorial Team
The thinner the local inventory, the steeper the growth as the radius widens. Vantelin Dome Nagoya swells roughly 50-fold, from 393 rooms within 2km to 19,807 within 5km — the lodging cluster around Nagoya Station and Sakae functions as the receiving market. Mizuho PayPay Dome Fukuoka shows the same pattern, with 2,249 rooms within 2km against 31,181 within 5km, where Hakata and Tenjin absorb the demand. ES CON FIELD HOKKAIDO, by contrast, reaches only 1,561 rooms even at 10km; inventory does not accumulate until you go as far as central Sapporo.
Circle size represents the number of rooms within a 2km radius. Source: MetroEngines Research; compiled by the HotelBank Editorial Team
Only “already-confirmed events” are moving October listed prices
Next we aggregated the daily median listed price for October across properties located within each ballpark’s trade area. The trade area is defined as the 2km radius for ballparks with 2,000 or more rooms within 2km, and the 5km radius otherwise; the aggregation covers only properties for which a price was observable on the given date.
Source: MetroEngines Research; compiled by the HotelBank Editorial Team
Almost every peak in the chart is explained by day of week and public holidays. Saturdays are high in every market, and October 10 (Sat) and 11 (Sun) stand out as the middle of the three-day weekend. Across the CS Final Stage of October 14-19 and the Japan Series window from October 24 onward, no peak rises above the day-of-week pattern.
Taking the deviation of each window against the median of same-weekday baseline days (non-event days in October and November) makes the picture clearer still.
Source: MetroEngines Research; compiled by the HotelBank Editorial Team
| Ballpark trade area | Oct 11 (Sun) single day | CS-FS Oct 10-12 | CS Final Oct 14-19 | Japan Series Oct 24-31 |
|---|---|---|---|---|
| ES CON FIELD HOKKAIDO | +3.3% | +3.3% | +0.1% | +4.2% |
| Rakuten Mobile Park Miyagi | +72.1% | +16.7% | -8.3% | -5.8% |
| Tokyo Dome | +24.7% | -2.7% | -0.5% | +2.2% |
| Meiji Jingu Stadium | +20.2% | +3.0% | +0.2% | +2.0% |
| ZOZO Marine | +44.6% | -2.7% | -3.3% | -14.2% |
| Belluna Dome | — | +24.8% | — | — |
| Yokohama Stadium | +85.2% | +12.1% | -5.5% | -1.0% |
| Vantelin Dome | +6.2% | +1.4% | +2.4% | -23.2% |
| Hanshin Koshien | +47.7% | +7.7% | +5.3% | +1.2% |
| Kyocera Dome Osaka | +23.5% | -0.6% | -0.5% | +0.1% |
| MAZDA Hiroshima | +73.4% | +9.3% | +2.2% | -0.9% |
| Mizuho PayPay Dome | +47.6% | -4.5% | -4.8% | -1.1% |
Deviation of the median listed price against the median of same-weekday baseline days (each window is the median of the daily deviations). The Belluna Dome trade area had only five properties with observable prices, so no figure was calculated outside the CS-FS window. Source: MetroEngines Research; compiled by the HotelBank Editorial Team
On the single day of October 11 (Sun), the Yokohama Stadium trade area ran +85.2% against same-weekday baseline days, MAZDA Zoom-Zoom Stadium Hiroshima +73.4% and Rakuten Mobile Park Miyagi +72.1% — double-digit upside in 9 of the 11 trade areas for which a price could be calculated. This is a nationwide calendar factor: a Sunday followed by a public holiday.
Against that, the CS Final Stage window (October 14-19) stayed within ±5% in 8 of the 11 trade areas for which a figure could be calculated. The largest was +5.3% in the Hanshin Koshien Stadium trade area, and several trade areas came in slightly below baseline days. The Japan Series window is much the same: the Tokyo Dome trade area at +2.2%, Meiji Jingu Stadium at +2.0% and Kyocera Dome Osaka at +0.1% all sit essentially at baseline levels.
Booking pace points to the same conclusion — estimated occupancy at LT80
Even if price is not moving, inventory may be moving ahead of it. We therefore compared estimated occupancy at the 80-days-before-check-in cross-section (LT80) for the 11 prefectures in which the 12 ballparks are located.
Why the cross-section is set at LT80: as of the time of writing (August 14, 2026), October 10 is 57 days ahead and October 31 is 78 days ahead. LT80 is the deepest lead-time cross-section observable in common across all target dates, so it was adopted as the axis of comparison. Closer cross-sections such as LT45 or LT30 do not yet have observations for October dates.
Source: MetroEngines Research; compiled by the HotelBank Editorial Team
| Prefecture | Ballpark | Baseline-day est. OCC | CS-FS gap (pt) | CS Final gap (pt) | Japan Series gap (pt) | Properties observed at LT80 |
|---|---|---|---|---|---|---|
| Hokkaido | ES CON FIELD HOKKAIDO | 70.1% | +1.5 | -0.9 | -1.4 | 766-1,322 |
| Miyagi | Rakuten Mobile Park Miyagi | 71.7% | +0.3 | -7.5 | -4.8 | 188-331 |
| Tokyo | Tokyo Dome / Meiji Jingu | 67.5% | +2.4 | +1.9 | +3.7 | 867-1,324 |
| Chiba | ZOZO Marine | 65.5% | +3.1 | +1.9 | +0.9 | 326-677 |
| Saitama | Belluna Dome | 67.1% | +4.3 | +0.1 | +1.6 | 125-221 |
| Kanagawa | Yokohama Stadium | 64.0% | +4.0 | -1.0 | +0.2 | 391-664 |
| Aichi | Vantelin Dome | 77.9% | -6.6 | -0.5 | -10.4 | 375-529 |
| Hyogo | Hanshin Koshien | 70.7% | -0.6 | -0.4 | +0.9 | 454-797 |
| Osaka | Kyocera Dome Osaka | 64.0% | +2.0 | +2.2 | +3.0 | 413-707 |
| Hiroshima | MAZDA Hiroshima | 65.8% | +6.2 | +7.8 | +3.3 | 221-392 |
| Fukuoka | Mizuho PayPay Dome | 70.1% | +0.5 | -0.4 | +0.6 | 358-606 |
Estimated occupancy is prefecture-level and based on OTA-listed inventory. Because the number of properties observed varies by date, a range is disclosed for each prefecture. Source: MetroEngines Research; compiled by the HotelBank Editorial Team
Of the 11 prefectures, the only one clearly above baseline days in the CS Final Stage window is Hiroshima (+7.8pt). Tokyo is at +1.9pt, Osaka +2.2pt and Chiba +1.9pt, while the rest sit around ±1pt or below baseline days. In the Japan Series window the leaders are Tokyo at +3.7pt, Hiroshima at +3.3pt and Osaka at +3.0pt — overall still at baseline levels.
The dates that are running hot already have another confirmed event on them
Breaking down Hiroshima’s lone standout by date, estimated occupancy at the LT80 cross-section for October 17 (Sat) was 83.4% (observed as of August 14, 2026), 17.6pt above the same-weekday baseline of roughly 65.8%. The median listed price for that date was also about ¥40,500, above a normal Saturday on the same trade-area basis (October 3, about ¥34,400). However, a national tour is scheduled at a large arena in Hiroshima on both October 17 and 18, with a hall performance booked at another venue at the same time. Although the dates coincide with Games 4 and 5 of the CS Final Stage, the upside cannot be attributed to the postseason.
Aichi is clearer still. Estimated occupancy at LT80 for October 1 to 4 is high at 78.7-87.2%, then falls into the 66% range from October 5. It rises again to 76.9-79.7% from October 16 through 24, and returns to the 64% range from October 25. These two peaks map cleanly onto the competition periods of the 20th Asian Games (September 19 – October 4, 2026, Aichi-Nagoya) and the 5th Asian Para Games (October 18-24, 2026, Aichi-Nagoya). How far the Asian Para Games period is lifting weekday demand in Aichi is broken down date by date in Asian Para Games 2026: Aichi Weekdays Run 12pt Above the Next Week.
This is where the practical issue lies. The Asian Para Games window of October 18-24 overlaps exactly with Game 5 (October 18) and Game 6 (October 19) of the CS Final Stage, and with Game 1 of the Japan Series (October 24). Should Vantelin Dome Nagoya become a host ballpark, lodging demand in Nagoya would stack an international competition and the postseason on the same dates.
In Osaka, estimated occupancy at LT80 for October 31 (Sat) was 83.9% (observed as of August 14, 2026), 18.3pt above the same-weekday baseline of roughly 65.6%. The following day, November 1 (Sun), is also high at 76.4%. October 31 is the scheduled date for Game 6 of the Japan Series, but it is also a year in which Halloween itself falls on a Saturday, and it is more natural to read the latter as the larger contributor to demand in central Osaka.
The common thread is that what appears in price and inventory 80 days out is confined to events whose staging is already confirmed. Because the postseason has fixed dates but unfixed venues, the market has no way to price it in yet.
Three to ten days from confirmation to first pitch — with 10-20% of the market left
So how wide is the window once the venue is confirmed? In NPB’s October 2026 schedule, the final regular-season date is set for October 4 (Sun). That is the earliest the standings can be settled, leaving six days to the CS First Stage opener (October 10) and ten days to the Final Stage opener (October 14). The Japan Series must wait for the CS Final Stage to be decided (October 19, or the reserve day of October 21 if it goes the distance), leaving only three to five days to Game 1 (October 24) and six to eight days to Game 3 at the Pacific League home ballpark (October 27).
How much inventory remains in the market within that three-to-ten-day window? Using actual check-in dates from June and July 2026, we built estimated-occupancy profiles by lead time.
Source: MetroEngines Research; compiled by the HotelBank Editorial Team
| Prefecture | Sat, LT10 rooms left | Sat, LT7 rooms left | Wed, LT10 rooms left | Wed, LT7 rooms left |
|---|---|---|---|---|
| Tokyo | 9.8% | 8.7% | 14.3% | 11.7% |
| Osaka | 17.5% | 16.0% | 24.1% | 21.7% |
| Hiroshima | 17.2% | 16.2% | 25.3% | 21.7% |
| Fukuoka | 11.1% | 9.8% | 18.2% | 15.0% |
| Aichi | 14.2% | 13.4% | 22.8% | 19.5% |
| Miyagi | 10.2% | 9.2% | 21.2% | 18.8% |
Medians based on actual check-ins on June 13, June 20, July 11 and July 18 (Saturdays) and June 17 and July 15 (Wednesdays), 2026. Remaining-room rate = 100% − estimated occupancy. Source: MetroEngines Research; compiled by the HotelBank Editorial Team
On the Saturday profile, Tokyo has already reached an estimated occupancy of 90.2% by LT10 (median of actual June-July 2026 Saturdays), leaving a remaining-room rate of just 9.8%. Miyagi at 10.2% and Fukuoka at 11.1% are similarly thin. Relatively more room is left in Osaka at 17.5%, Hiroshima at 17.2% and Aichi at 14.2%. On Wednesdays the remaining-room rate rises into the 20s: Osaka 24.1%, Hiroshima 25.3% and Aichi 22.8%.
In short, the listed inventory left in the market at the moment the venue is confirmed is roughly 20% on weekdays and around 10% on weekends. Postseason travel demand will be concentrated into that limited residual inventory over a short period. The method for reading lead-time inventory depletion at the city level is also covered in Tokyo Early Sep: Booking Curves at T-45/T-30/T-14, OCC 76.0-81.5%.
What to decide before confirmation — the options the data suggests
On this evidence, the question for a property whose trade area contains a home ballpark is not “whether to raise rates” but “how to hold inventory before confirmation, and how many days it takes to react afterwards.” Here are the options the data points to.
Option 1: Fill normally before confirmation and compete with residual inventory afterwards. A weekend remaining-room rate of around 10% shows that even if inventory is filled before confirmation, a certain volume remains available to move afterwards. In a market like Tokyo, where estimated occupancy reaches 67.5% by LT80 even on baseline days (observed as of August 14, 2026), the underlying depth of demand makes it relatively expensive to hold rooms open waiting for conditional demand. Prioritizing pre-confirmation sales and handling the aftermath with the remaining 10% is a workable design.
Option 2: Hold back part of the inventory only for the few days around confirmation. In markets such as Osaka, Hiroshima and Aichi, where the weekday remaining-room rate is in the 20s, there is structurally more scope to hold back. Because the confirmation dates are known in advance — October 4 for the CS Final Stage, and October 19 to 21 for the Japan Series — it is possible to design in advance the allocation that can be sold immediately afterwards. The risk that a held-back allocation goes unsold is, however, unavoidable with conditional demand.
Option 3: Secure the dates that overlap with already-confirmed events first. The most reproducible finding in this analysis was that confirmed events are already visible in price and inventory. The Asian Para Games in Nagoya (October 18-24), the major concerts in Hiroshima (October 17-18) and the Halloween weekend in Osaka (October 31) all overlap with postseason dates. Whether or not the postseason adds to them, demand on those dates is already confirmed. Locking in a design that captures confirmed demand is easier to read on a risk-and-return basis than waiting on conditional demand.
Option 4: Position yourself in the receiving submarket. At ballparks with thin local inventory — ES CON FIELD HOKKAIDO, Belluna Dome, Hanshin Koshien Stadium and Vantelin Dome Nagoya — demand must flow into adjacent submarkets. Central Sapporo, the Ikebukuro-Tokorozawa corridor, central Osaka and Sannomiya, and Nagoya Station and Sakae are the receiving areas. For properties in those submarkets, distance from the ballpark is not a disadvantage; it may work in their favor, in that the order in which demand arrives after confirmation is readable.
None of these is a categorical recommendation; they are options the data suggests. Which one to take depends on each property’s inventory mix, direct-booking share and cancellation policy.
Conclusion
For the 2026 postseason, the dates are confirmed on NPB’s official schedule while the host cities must wait on the regular season and the CS. As observed 80 days out, no movement attributable to the postseason has appeared in either listed prices or booking pace in any of the 12 ballpark trade areas. What the market is pricing in is only confirmed events — the three-day weekend, major concerts, international competitions and Halloween.
On the supply side, the shape of demand differs completely between ballparks that are self-contained, such as Yokohama Stadium with 19,058 rooms within 2km, and those such as ES CON FIELD HOKKAIDO and Belluna Dome that have no qualifying rooms within 2km and depend on wide-area receiving markets. The window from venue confirmation to first pitch is three to ten days, and the listed inventory left in the market at that point is around 10% on weekends and 20% on weekdays. Whether you can design what to sell inside that short window without waiting for confirmation is the variable that will separate outcomes in October.
⚠ A note on data for future dates: the October listed prices and estimated occupancy figures used in this article are estimates based on the inventory and selling prices published on OTAs as of the survey date (August 14, 2026), and they fluctuate as the check-in date approaches. Because the target dates fall more than 30 days beyond the time of writing, no categorical judgments such as “sold out” or “sold out early” are made from any individual property’s inventory position. At properties that list only a restricted allocation on OTAs, a low remaining-room count does not indicate a tight market.
Related Reading
- Double Ten x Sports Day: Japan’s Oct 9-12 Capacity at 76 Days Out
- Asian Para Games 2026: Aichi Weekdays Run 12pt Above the Next Week
- Tokyo Early Sep: Booking Curves at T-45/T-30/T-14, OCC 76.0-81.5%
- back number’s 2-Day Stadium Show Pushes Shin-Yokohama ADR to Ceiling
References and Sources
■ Schedule (primary source)
- Nippon Professional Baseball, “2026 Central League Climax Series Schedule”
- Nippon Professional Baseball, “2026 Pacific League Climax Series Schedule”
- Nippon Professional Baseball, “2026 Central/Pacific League Regular Season: October Schedule and Results” (includes the home-ballpark designation for the Japan Series)
■ Confirmed events in the same period
- 20th Asian Games (2026/Aichi-Nagoya) official site — competition period September 19 to October 4, 2026
- 5th Asian Para Games (2026/Aichi-Nagoya) official site — competition period October 18 to 24, 2026
- Japanese Paralympic Committee, “Aichi-Nagoya 2026 Asian Para Games”
■ Market data
- MetroEngines Research — guest-room supply around the ballparks (radii of 1-10km, 12 ballparks), daily median listed price for October (1,807 properties covered), and estimated occupancy by lead time and prefecture
■ Data sources
Listed prices, estimated occupancy based on OTA-listed inventory, and the property master (room counts) from MetroEngines Research were used. Rooms around each ballpark were aggregated within radii of 1km to 10km for each of the 12 ballparks, covering only properties for which a room count is registered. The daily median listed price for October covers 1,807 properties; estimated occupancy is at the prefecture level. Schedule data is from Nippon Professional Baseball’s official pages (accessed August 14, 2026).
■ Assumptions
The trade area is defined as the 2km radius for ballparks with 2,000 or more rooms within 2km, and the 5km radius otherwise. Listed price is the area median of each property’s daily average, for two guests per room, tax included, averaged across all plans. The “baseline days” used for comparison are the median of non-event days in October and November matched to the same day of the week. The axis for comparing booking pace is standardized to the LT80 cross-section (80 days before check-in), and the remaining-room rate = 100% − estimated occupancy. Lead-time profiles use the median of actual check-ins on June 13, June 20, July 11 and July 18 (Saturdays) and June 17 and July 15 (Wednesdays), 2026.
■ Limitations and caveats
Listed prices are not transacted prices, and estimated occupancy is an estimate based on OTA-listed inventory that differs from a property’s true overall occupancy. Because the target dates fall more than 30 days beyond the time of writing, the figures will move with subsequent inventory adjustments. Given that the host ballparks are unconfirmed, the deviation analysis here does not prove the presence or absence of postseason demand; it establishes only that the market has not priced it in as of 80 days out. The trade areas of Tokyo Dome and Meiji Jingu Stadium, and of Kyocera Dome Osaka and Hanshin Koshien Stadium, partially overlap. Trade areas with few observed properties (the Belluna Dome trade area has five) were not aggregated outside the CS-FS window.