

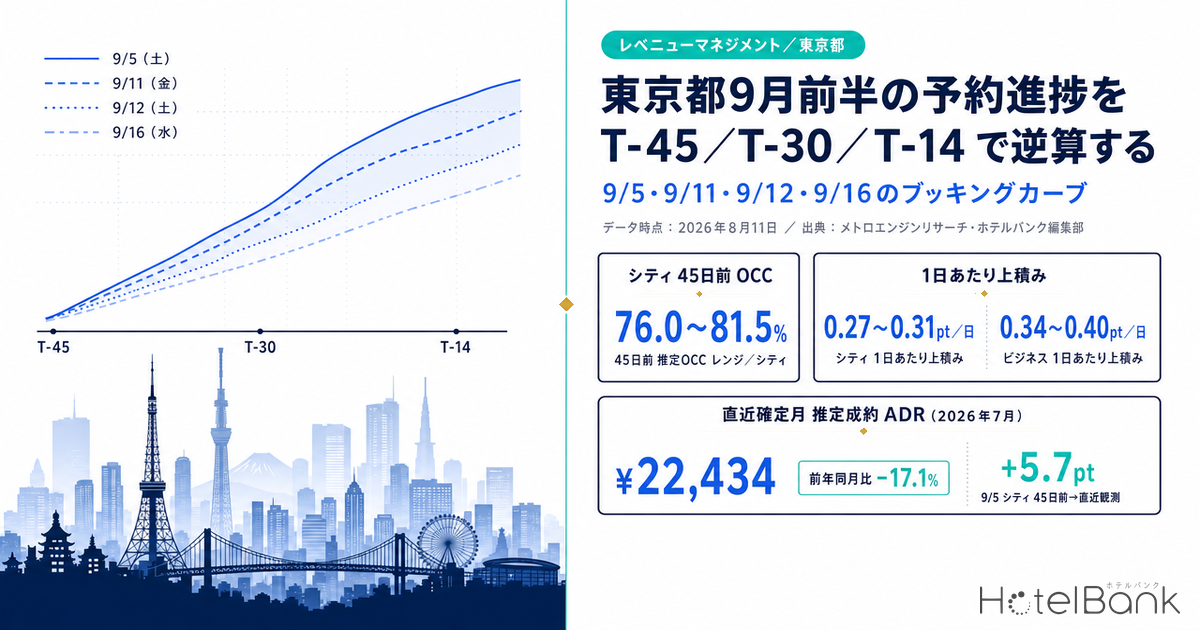
Line up booking progress for the first half of September in Tokyo at fixed checkpoints counted back from the stay date, and the stride of each date separates clearly. For city hotels, estimated OCC (based on OTA-listed inventory) moved from 78.5% at 45 days out to 84.2% at the latest observation (26 days out) for Saturday September 5, a gain of +5.7 pt, and from 81.5% to 84.7% at the latest observation (33 days out) for Saturday September 12, a gain of +3.2 pt. Even on two Saturdays, the starting level and the size of the gain are separate things. Business hotels move in longer strides still: September 5 built from 69.8% at 45 days out to 77.2% at the latest observation, a gain of +7.4 pt. On the price side, the estimated settled ADR for Tokyo city hotels was ¥22,434 in July 2026 (N=107 properties), the most recent confirmed month, down 17.1% year on year, while September 2026 currently stands only at an estimate of ¥23,670 (N=106 properties). This article organizes the material needed to build a T-45 / T-30 / T-14 countdown calendar for these four dates (Sep 5, Sep 11, Sep 12, Sep 16), staying strictly within what has actually been observed.
Scope: city hotels in Tokyo (listed-inventory observations, N=95-100 properties) and business hotels in Tokyo (N=808-858 properties). Estimated settled ADR covers N=106 city hotels and N=894 business hotels (September 2026). The price metric in this article is estimated settled ADR (a settled price level inferred from OTA and other sales data, tax-exclusive equivalent); occupancy is an estimate based on OTA-listed inventory. Both definitions appear at the end of the article. Data as of August 11, 2026.
- — The four early-September dates for Tokyo city hotels fall within a 45-days-out estimated OCC range of 76.0-81.5% (as of August 11, 2026; observed N=95-100 properties).
- — The daily gain after the 45-days-out mark runs 0.27-0.31 pt/day for city hotels and 0.34-0.40 pt/day for business hotels. On the same dates, business hotels take a visibly longer stride.
- — September 5 is the only date that has already passed the 30-days-out checkpoint. For Sep 11, Sep 12 and Sep 16, both T-30 and T-14 are still ahead, so no conclusion about the final landing can be drawn.
- — At the latest observation, the sold-out property rate for city hotels splits into two groups: 11.0% on Sep 12 and 8.0% on Sep 5, against 3.0% on Sep 16 and 2.0% on Sep 11.
- — Estimated settled ADR for the most recent confirmed month, July 2026, was ¥22,434 (N=107 properties, down 17.1% year on year); September 2026 currently stands at an estimated ¥23,670 (N=106 properties).
Where the four early-September dates stand — gains from 45 days out run +2.3 to +5.7 pt
As a starting premise, Saturday September 5 is the only one of the four dates that has already passed the 30-days-out checkpoint. The latest observation stands at 32 days out for Friday September 11, 33 days out for Saturday September 12 and 37 days out for Wednesday September 16, so both T-30 and T-14 are still checkpoints they have yet to cross. The figures below are therefore material for reading how much has been built up over the interval from 45 days out to here, not how far the final total has come.
Overlay the booking curves for Tokyo city hotels and the ranking of starting levels is already settled at the 45-days-out mark. In descending order: Saturday September 12 at 81.5%, Saturday September 5 at 78.5%, Wednesday September 16 at 77.1% and Friday September 11 at 76.0%. What stands out is that Friday September 11 starts from a lower level than Wednesday September 16. In the Tokyo market, a Friday in early September is not automatically a demand date that carries weekend pricing.
Source: Compiled by HotelBank Editorial Team from MetroEngines Research
Re-sort by the size of the gain and the ranking changes. The average daily gain is fastest on September 11 at 0.31 pt/day, followed by September 5 at 0.30 pt/day, September 16 at 0.29 pt/day and September 12 at 0.27 pt/day. September 12, which started from the highest level, has in fact grown the most slowly since the 45-days-out mark. Conversely September 11, which started lowest, has built fastest since 45 days out and reached 80.0% at the latest observation (32 days out). The way these four dates line up shows that low at 45 days out does not equal a weak date. Across the Tokyo market as a whole, the way curve shapes separate is a question of hotel category rather than of the calendar date alone.
| Stay date | Segment | 45 days out | 30 days out | Latest obs. | vs 45 days out | Sold-out property rate (latest obs.) |
|---|---|---|---|---|---|---|
| Sep 5 (Sat) | City | 78.5% | 82.9% | 84.2%(26 days out) | +5.7pt | 8.0% |
| Sep 5 (Sat) | Business | 69.8% | 75.6% | 77.2%(26 days out) | +7.4pt | 18.1% |
| Sep 11 (Fri) | City | 76.0% | Not yet reached | 80.0%(32 days out) | +4.0pt | 2.0% |
| Sep 11 (Fri) | Business | 65.7% | Not yet reached | 70.7%(32 days out) | +5.0pt | 7.0% |
| Sep 12 (Sat) | City | 81.5% | Not yet reached | 84.7%(33 days out) | +3.2pt | 11.0% |
| Sep 12 (Sat) | Business | 68.8% | Not yet reached | 72.9%(33 days out) | +4.1pt | 17.7% |
| Sep 16 (Wed) | City | 77.1% | Not yet reached | 79.4%(37 days out) | +2.3pt | 3.0% |
| Sep 16 (Wed) | Business | 67.4% | Not yet reached | 70.6%(37 days out) | +3.2pt | 8.2% |
Source: Compiled by HotelBank Editorial Team from MetroEngines Research. Estimated OCC is based on OTA-listed inventory. The sold-out property rate is the estimated share of properties for which no listed inventory can be confirmed on OTAs or similar channels.
The ordering of sold-out property rates supports the same date-by-date difference. At the latest observation, city hotels stand at 11.0% on September 12 and 8.0% on September 5, against single digits of 3.0% on September 16 and 2.0% on September 11. For business hotels the figures are 18.1% on September 5 and 17.7% on September 12, against 8.2% on September 16 and 7.0% on September 11. All of these, however, are snapshots taken 25 or more days before the stay date, and they will move as inventory comes in and out. They should be treated only as a cross-section of the present moment.
Business hotels take longer strides — the same dates call for a different countdown design
Look at the same four dates for business hotels and the curve shape is similar but the slope is a notch steeper. The daily gain from 45 days out is 0.40 pt/day on September 16, 0.39 pt/day on September 5, 0.38 pt/day on September 11 and 0.34 pt/day on September 12. Every one of these exceeds the 0.27-0.31 pt/day recorded by city hotels. Business hotels start roughly 9-13 pt below city hotels at the 45-days-out mark, then close part of that gap through growth over the interval.
Source: Compiled by HotelBank Editorial Team from MetroEngines Research
This difference feeds straight into how the countdown calendar should be designed. The smaller the share of a segment that is settled over the 45-to-30-days-out interval, the more movable inventory remains after T-30. For business hotels on September 5, the build was +5.8 pt from 69.8% at 45 days out to 75.6% at 30 days out, then a further +1.6 pt through the latest observation (26 days out). City hotels on September 5, by contrast, added +4.4 pt from 45 to 30 days out and +1.3 pt after that. For both, the interval before the 30-days-out mark is the thicker one. How individual properties split into front-loaded and late-surge types is broken down in Tokyo Aug 14: 434 Hotels, Front-Loaded 10.8% vs Late-Surge 9.4%.
As a reference point for where dates tend to land, averaging Tokyo estimated OCC by day of week for July 2026, the most recent completed month, gives city hotels 96.9% on Saturday, 93.1% on Friday and 89.4% on Monday, and business hotels 96.3% on Saturday, 94.8% on Thursday and 89.4% on Monday (July 2026; city N=100 properties, business N=862 properties). The day-of-week shape, highest on Saturday and lowest on Monday, is common to both segments and is worth holding as background when evaluating the four early-September dates.
| Day of week | City hotels | Business hotels | Days covered |
|---|---|---|---|
| Mon | 89.4% | 89.4% | 4 days |
| Tue | 91.9% | 93.1% | 4 days |
| Wed | 92.6% | 94.0% | 5 days |
| Thu | 92.7% | 94.8% | 5 days |
| Fri | 93.1% | 93.1% | 5 days |
| Sat | 96.9% | 96.3% | 4 days |
| Sun | 91.4% | 91.0% | 4 days |
Day-of-week averages of estimated OCC (based on OTA-listed inventory), Tokyo, July 2026. Source: Compiled by HotelBank Editorial Team from MetroEngines Research
The price yardstick — estimated settled ADR for Tokyo city hotels keeps trailing last year in confirmed months
In thinking about how to translate the speed of progress into price, the market level itself is worth pinning down. Stacking estimated settled ADR for Tokyo city hotels year over year, 2026 ran ahead of the prior year at ¥26,419 in January (N=106 properties, up 8.3%) and ¥30,282 in March (N=107 properties, up 5.8%), then turned below the prior year on a confirmed-month basis at down 3.8% in May, down 12.8% in June and down 17.1% in July. July 2026, the most recent confirmed month, came in at ¥22,434 (N=107 properties), below the ¥27,055 recorded in the same month last year (N=107 properties).
Source: Compiled by HotelBank Editorial Team from MetroEngines Research. Solid line = confirmed values; dotted line = estimates based on current sales conditions.
For September 2026 itself, the estimate based on current sales conditions is ¥23,670 (N=106 properties). This is not a confirmed value; a year-on-year comparison only becomes possible once the month closes at the end of September. The confirmed value for the same month last year was ¥27,467 (N=107 properties), but a straight comparison against it should wait for month-end confirmation. Business hotels follow the same shape: the confirmed value for July 2026 was ¥12,306 (N=913 properties), down 5.3% year on year, and September 2026 currently stands at an estimated ¥14,414 (N=894 properties).
| Mon | City City 2025 (confirmed) | City City 2026 (confirmed) | YoY | Business City 2026 (confirmed) | YoY |
|---|---|---|---|---|---|
| April | ¥31,076 | ¥31,241 | +0.5% | ¥17,802 | +3.9% |
| May | ¥27,344 | ¥26,298 | −3.8% | ¥14,890 | +5.7% |
| June | ¥25,441 | ¥22,195 | −12.8% | ¥11,890 | −4.7% |
| July | ¥27,055 | ¥22,434 | −17.1% | ¥12,306 | −5.3% |
| Sept.(current estimate) | ¥27,467 | ¥23,670 | Awaiting confirmation | ¥14,414 | Awaiting confirmation |
Estimated settled ADR (tax-exclusive equivalent). City hotels N=105-108 properties, business hotels N=894-923 properties. September is an estimate based on current sales conditions, not a confirmed value. Source: Compiled by HotelBank Editorial Team from MetroEngines Research
The long holiday waiting just behind makes the first half harder to plan backward
In September 2026, September 22 becomes a holiday because it falls between Respect for the Aged Day (Monday September 21) and the Autumnal Equinox (Wednesday September 23). On a public-holiday basis this creates a four-day run from Sunday September 20 through Wednesday September 23, extending to five days from Saturday September 19 through Wednesday September 23 for anyone whose Saturday is a day off (Cabinet Office, National Holidays). It is the first such alignment in 11 years, and the Nikkei reported the formation of this holiday run as early as February 2025.
Booking progress over this holiday run sits at a clearly different level from the four early-September dates. For city hotels, estimated OCC on Saturday September 19 moved from 86.1% at 45 days out to 87.5% at the latest observation (40 days out), with a sold-out property rate of 19.0% at the latest observation. For business hotels, September 19 moved from 77.7% at 45 days out to 79.5% at the latest observation, with a sold-out property rate of 32.5% — higher than any date in the first half of September. Monday September 21, a public holiday, moved from 81.5% at 45 days out to 82.6% at the latest observation (42 days out) for city hotels, and Tuesday September 22 from 79.0% to 79.5% at the latest observation (43 days out). The pace of the holiday run itself is a separate question, one that needs its own cross-section compared across major areas and that these four first-half dates cannot answer.
In short, the four early-September dates sit just in front of a demand peak waiting immediately behind them. Clear out first-half inventory too early and less capacity is left for pricing decisions over the holiday run. Hold the first half back too tightly and volume is lost on dates like September 11 and September 16, where the sold-out property rate stays in single digits even at 45 days out. Managing that tug-of-war in segments defined by the T-45, T-30 and T-14 checkpoints is the purpose of the countdown calendar in this article.
For revenue managers running city and business hotels in Tokyo — implications and an action plan
(1) Hold the level at 45 days out and the stride after 45 days out as two separate metrics. In the market, September 12 started from the highest level at 81.5% at 45 days out yet posted the slowest daily gain of the four dates at 0.27 pt/day. September 11, by contrast, started from the lowest level at 76.0% and built fastest at 0.31 pt/day. When overlaying your own curve on the market, avoid deciding strong day or weak day from the level alone, and keep the slope over the interval in a separate column.
(2) The thickness of inventory remaining after T-30 differs by segment. Business hotels built at 0.34-0.40 pt/day across all four dates, exceeding the 0.27-0.31 pt/day of city hotels. That reads as a market structure in which the business segment is more likely to retain inventory that still moves after T-30. For the city segment, a design that puts more decision weight on the 45-to-30-days-out interval (+4.4 pt on September 5) looks more realistic.
(3) Anchor the price-range yardstick to confirmed months. Estimated settled ADR for Tokyo city hotels trails the prior year on a confirmed-month basis, down 12.8% in June and down 17.1% in July. The ¥23,670 figure for September is only a current estimate; as a basis for decisions, the ¥22,434 of the most recent confirmed month (July 2026) is the more stable reference point. It is also worth noting that the most recent confirmed month for business hotels is ¥12,306, down 5.3% year on year — a decline of a different order of magnitude.
(4) There is room to design the first half of September as a lead-in to the holiday run. September 19 starts from 86.1% for city hotels and 77.7% for business hotels at 45 days out, higher than any of the four first-half dates. A decision to release inventory early on first-half dates is the flip side of how much pricing freedom remains for the holiday run. Reviewing the first half and the holiday run as a single block for profit-and-loss purposes is also worth considering.
The following action plan translates the figures in this article directly into decision triggers. It guarantees no outcome; each item is offered as a starting point for consideration.
| Time frame | Action | Decision trigger (tied to the figures in this article) | Purpose |
|---|---|---|---|
| Today to this week (T-30 crossing period) | Build a routine of recording the T-30 checkpoint for Sep 11, Sep 12 and Sep 16 on the day each is crossed | Sep 11 crosses T-30 on Aug 12, Sep 12 on Aug 13 and Sep 16 on Aug 17. At 45 days out the market started from 76.0% / 81.5% / 77.1% respectively (city hotels) | Enable a like-for-like comparison against Sep 5, which has already been crossed (market city hotels 82.9%) |
| Today to this week | Re-examine how remaining allocation for Sep 5 is released | For Sep 5 the market built from 78.5% to 84.2% (+5.7 pt) for city hotels and 69.8% to 77.2% (+7.4 pt) for business hotels between 45 days out and the latest observation. If your own gain over the same interval falls well short of this | Surface early any inventory that cannot be absorbed in the remaining 25 days |
| Within two weeks (ahead of T-14) | Prepare a price-band reset ahead of T-14 for Sep 5 (Aug 22) | If your September settings remain well below the market level of the most recent confirmed month (city ¥22,434 / business ¥12,306) while progress tracks the market | Avoid leaving rate on the table on dates where progress matches the market |
| Within two weeks | Treat Fri Sep 11 and Wed Sep 16 as weekday-type dates under a separate rule | At the latest observation the sold-out property rate for both dates is 2.0% / 3.0% for city hotels and 7.0% / 8.2% for business hotels, below Sep 5 and Sep 12 (city hotels 8.0% and 11.0%) | Avoid stagnation caused by applying weekend pricing logic to them |
| Looking to next month | Lay out the four early-September dates and the five-day run of Sep 19-23 as a single profit-and-loss block | At 45 days out the market on Sep 19 stands at 86.1% for city hotels and 77.7% for business hotels, above every 45-days-out level among the four first-half dates | Manage first-half inventory absorption and holiday-run pricing freedom at the same time |
| Looking to next month | Set up T-45 / T-30 / T-14 checkpoint records in advance for the same weekdays from October onward | Estimated OCC by day of week for July 2026 shows a clear shape at 96.9% on Saturday and 89.4% on Monday (city hotels), so whether the same shape repeats can be tracked at fixed checkpoints | Improve next month’s countdown accuracy from accumulated checkpoints rather than one-off intuition |
Source: Compiled by HotelBank Editorial Team from MetroEngines Research
Unit conversion of rate and occupancy — estimated RevPAR equivalent using only observed values from this article
So far the figures have presented estimated OCC and estimated settled ADR separately. Putting both on the same yardstick makes it easier to compare which of the two swings matters more at each checkpoint of the countdown calendar. What follows is a unit conversion, not a forecast. The identity estimated RevPAR equivalent = estimated settled ADR × estimated OCC takes only observed values already presented in this article as inputs, and contains no new empirical claim. Because estimated OCC is based on OTA-listed inventory and runs higher than actual room occupancy, the amounts below should be treated not as absolute levels but as an index for relative comparison.
| Scenario | Estimated settled ADR (source) | Estimated OCC 84.2% Sep 5, latest observation, August 10, 2026 | Estimated OCC 96.9% Saturday result, July 2026 |
|---|---|---|---|
| Downside | ¥22,434 Level of the most recent confirmed month (July 2026) | ¥18,889 | ¥21,739 |
| Mid | ¥23,670 Current estimate for September 2026 | ¥19,930 | ¥22,936 |
| Upside | ¥27,467 Confirmed value for the same month last year (September 2025) | ¥23,127 | ¥26,616 |
All three rate levels are estimated settled ADR figures for Tokyo city hotels that appear in the body text, and both estimated OCC levels are observed values from the body text. Each cell is the product of the two and is not an estimate of where the date will land. Source: Compiled by HotelBank Editorial Team from MetroEngines Research
Holding estimated OCC at 84.2% (the Sep 5 latest-observation cross-section, August 10, 2026; city hotels N=100 properties) and swapping only the rate from ¥22,434 for the most recent confirmed month to the ¥23,670 current estimate for September raises the estimated RevPAR equivalent by ¥1,041. Conversely, holding the rate at ¥22,434 and swapping estimated OCC from 84.2% to the 96.9% Saturday result for July 2026 raises it by ¥2,850. In the range covering these four dates, the swing on the occupancy side has the larger effect on the estimated RevPAR equivalent than the swing on the rate side.
| Estimated settled ADR \ Estimated OCC | 76.0% Sep 11, 45 days out | 80.0% Sep 11, latest obs. | 84.2% Sep 5, latest obs. | 87.5% Sep 19, latest obs. | 96.9% Saturday result, July 2026 |
|---|---|---|---|---|---|
| ¥22,195 June 2026, confirmed | ¥16,868 | ¥17,756 | ¥18,688 | ¥19,421 | ¥21,507 |
| ¥22,434 July 2026, confirmed | ¥17,050 | ¥17,947 | ¥18,889 | ¥19,630 | ¥21,739 |
| ¥23,670 September 2026, current estimate | ¥17,989 | ¥18,936 | ¥19,930 | ¥20,711 | ¥22,936 |
| ¥26,298 May 2026, confirmed | ¥19,986 | ¥21,038 | ¥22,143 | ¥23,011 | ¥25,483 |
| ¥27,467 September 2025, confirmed | ¥20,875 | ¥21,974 | ¥23,127 | ¥24,034 | ¥26,616 |
Rows are the five estimated settled ADR levels that appear in the body text; columns are the five estimated OCC levels that appear in the body text. Each cell is the estimated RevPAR equivalent (row × column), a product of values that both sit inside the observed ranges of this article. Source: Compiled by HotelBank Editorial Team from MetroEngines Research
Summary — hold the countdown calendar with three yardsticks
Yardstick 1: the starting level (T-45). The four early-September dates for Tokyo city hotels fell within a range of 76.0-81.5% at 45 days out. Where your own 45-days-out figure lands within that range is the starting point for each date.
Yardstick 2: the stride over each interval (T-45 to T-30 to T-14). Record day by day how much faster or slower your own pace runs against the market stride of 0.27-0.31 pt/day for city hotels and 0.34-0.40 pt/day for business hotels. The point of this yardstick is to read the slope, not the level.
Yardstick 3: the price level of confirmed months. The most recent confirmed month for Tokyo city hotels is July 2026 at ¥22,434 (down 17.1% year on year), and ¥12,306 for business hotels (down 5.3%). Treat the September estimate as something awaiting confirmation and keep the basis for decisions on confirmed months.
Drop these three into a table organized by date and the early-September countdown calendar can be run even for checkpoints not yet crossed. For the three dates other than September 5, both T-30 and T-14 are still ahead. Rather than reaching a conclusion now on whether they will fill, the more useful step is to prepare the recording slots in advance so the figures can be captured as each checkpoint is crossed.
About the data
| Definition of estimated OCC | Occupancy based on OTA-listed inventory = 100 − 100 × rooms remaining on OTA listings ÷ total rooms. It is an estimate based on how listed inventory is being absorbed on OTAs, and its definition differs from actual room occupancy (it reads higher). |
| Booking curve | Based on observations from 45 days before the stay date through the latest observation. |
| Definition of estimated settled ADR | A settled price level (tax-exclusive equivalent) inferred from OTA and other sales data (lowest-plan level × segment coefficient, ensembled across multiple channels). Past months are confirmed values; the current and future months are estimates based on current sales conditions. Median error against published operating results is 6.6%. |
| Breakdown of sample sizes (N=) | Booking curves (Tokyo, each September stay date): city hotels observed N=95-100 properties, 32,712 total rooms; business hotels observed N=808-858 properties, 125,014-125,629 total rooms. Estimated OCC by day of week for July 2026: city N=100 properties, business N=862 properties. Estimated settled ADR: city hotels N=105-108 properties, business hotels N=894-923 properties. The sold-out property rate is the estimated share of properties for which no listed inventory can be confirmed on OTAs or similar channels. |
| Data date | Data as of August 11, 2026. Sales conditions and inventory change daily, so the figures in this article are a snapshot taken at the time of retrieval. |
References and sources
· Cabinet Office of Japan, National Holidays https://www8.cao.go.jp/chosei/shukujitsu/gaiyou.html
· Nikkei, Four-day holiday run in September 2026, first in 11 years under the Holiday Act (National Astronomical Observatory of Japan) https://www.nikkei.com/article/DGXZQOUE030MI0T00C25A2000000/
· Internal data: Source: Compiled by HotelBank Editorial Team from MetroEngines Research
■ Data sources
Booking curves built from daily observations of OTA-listed inventory in Tokyo (stay dates Sep 5, Sep 11, Sep 12 and Sep 16, plus Sep 19, Sep 21 and Sep 22 for comparison), and monthly series of estimated settled ADR for Tokyo city and business hotels (January 2025 to September 2026). Estimated OCC by day of week is aggregated from daily observations for July 2026. External sources are the Cabinet Office of Japan (National Holidays) and the Nikkei. Data as of August 11, 2026.
■ Calculation assumptions
Estimated OCC = 100 − 100 × rooms remaining on OTA listings ÷ total rooms. Daily gain = (estimated OCC at the latest observation − estimated OCC at 45 days out) ÷ days elapsed. Estimated OCC by day of week is the room-count-weighted average of daily observations for the month, grouped by day of week. The estimated RevPAR equivalent is a unit conversion using the identity estimated settled ADR × estimated OCC, with only observed values from the body text as inputs. It is not an estimate of where future dates will land.
■ Limitations and caveats
Estimated OCC is an estimate based on OTA-listed inventory and differs in definition from actual room occupancy (it reads higher). Sep 11, Sep 12 and Sep 16 have crossed neither T-30 nor T-14, so the figures in the body text are only a cross-section of the interval from 45 days out to the latest observation, not a conclusion about how full they will be. Estimated settled ADR for September 2026 is not a confirmed value; a year-on-year comparison becomes possible only once the month closes. The sold-out property rate is the estimated share of properties for which no listed inventory can be confirmed on OTAs or similar channels, and is not synonymous with an actual sell-out. Because inventory moves in and out daily, every figure is a snapshot taken at the time of retrieval.