

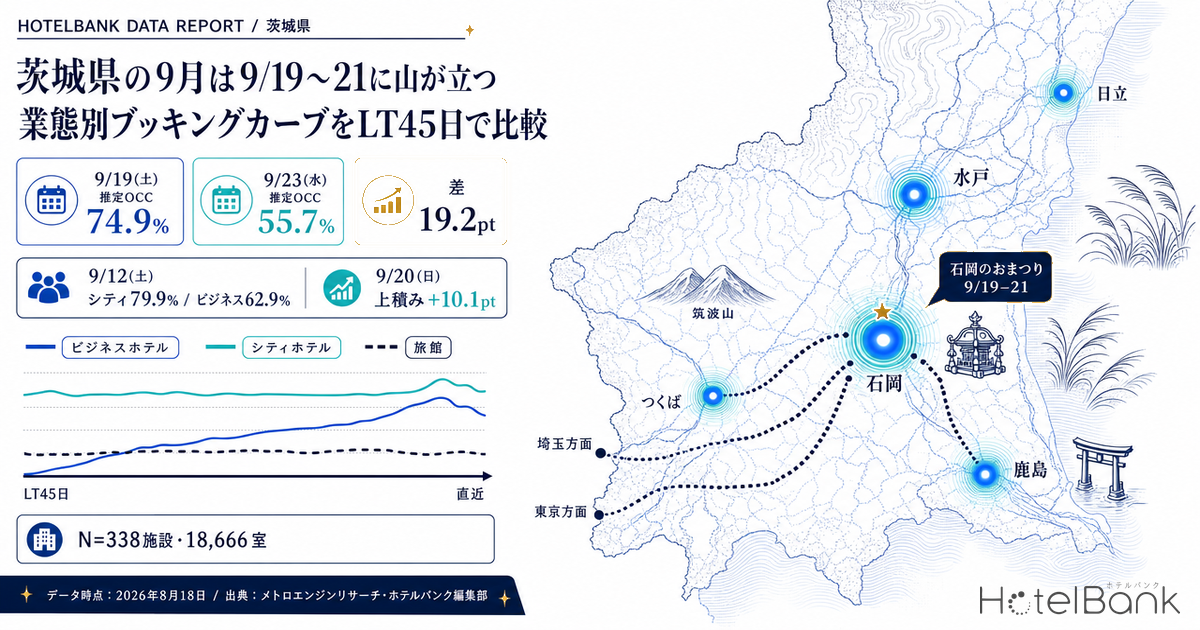
Not every Saturday in September looks the same in Ibaraki. As observed on August 17, 2026, the highest estimated OCC on an all-properties basis is Saturday, September 19 at 74.9%, and the lowest is Wednesday, September 23 at 55.7% — a gap of 19.2pt. And that is despite September 23 falling on Autumnal Equinox Day, within a five-day holiday run that starts on September 19. Split the market by hotel type and the picture changes again: at the same observation point for Saturday, September 12, business hotels sit at 62.9% while city hotels are at 79.9%, a 17.0pt spread. “How September is filling up across the prefecture” simply is not visible unless you separate the hotel types. This article compares Ibaraki’s booking curves by stay date and hotel type, over the window from 45 days before the stay date to the latest observation, and reads how bookings accumulate at three fixed checkpoints: T-45, T-30, and the latest observation.
Scope: Ibaraki, all hotel types, N=338 properties / 18,666 rooms (breakdown: business hotels N=160-161 properties, city hotels N=16 properties, ryokan N=71-74 properties; the observed population varies by stay date). This article uses no price metrics; occupancy is expressed only as an estimate based on OTA-listed inventory (estimated OCC) and as the sellout rate. Both are defined at the end of the article. Data as of: August 18, 2026 (latest observation date August 17, 2026).
- — The peak of the five-day holiday run ends after the first three days — On an all-properties basis, estimated OCC is 74.9% on Sat 9/19, 73.9% on Sun 9/20 and 67.9% on Mon 9/21 (holiday), versus 61.3% on Tue 9/22 (holiday) and 55.7% on Wed 9/23 (holiday). Even with holidays continuing, the level drops 19.2pt (observed August 17, 2026, at 33-38 days out; 241-293 properties observed).
- — Sellout rate varies 2.8x within the same holiday run — On the same cross-section, 40.9% on Sun 9/20 and 36.4% on Sat 9/19 versus 15.8% on Wed 9/23 (holiday) and 14.8% on Thu 9/24. How tight the remaining inventory is splits by individual date, not by “because it is a holiday.”
- — The ranking at T-45 does not change by the latest observation — For a stay on Sat 9/12, T-45 (observed July 29, 2026) reads city hotels 77.1%, ryokan 64.4%, business hotels 57.9%. At the latest observation (26 days out) the order is unchanged at city 79.9%, ryokan 65.3%, business 62.9%; the spread only narrowed from 19.2pt to 17.0pt.
- — Room to add bookings remains with the lower-positioned hotel types — For Sat 9/12, pickup from T-45 to the latest observation was +5.0pt for business hotels, +2.8pt for city hotels and +0.9pt for ryokan. The higher a hotel type sits at T-45, the less headroom it has left near the stay date.
- — A high number on a thin cross-section cannot be read as “sold out” — City hotels number just N=16 properties in the prefecture, and observed ryokan swing between 44 and 71 properties depending on the stay date. A high estimated OCC on a date where the observed property count fell cannot distinguish genuine demand strength from properties withdrawing listed inventory.
For September Saturdays, both the level and the way bookings accumulate differ by hotel type
Start by lining up September’s Saturdays against a common starting line at T-45. Take Saturday, September 12: at T-45 (observed July 29, 2026), estimated OCC was 57.9% for business hotels, 77.1% for city hotels, 64.4% for ryokan and 61.0% for all properties. Already at that point there is a 19.2pt gap between city hotels and business hotels. Move forward to the latest observation (26 days out, August 17, 2026) and the readings are business hotels 62.9%, city hotels 79.9%, ryokan 65.3% — the gap barely closes, to 17.0pt.
What matters is that this is not a gap that closes along the way. Looking at the curves below, business hotels build steadily upward by +5.0pt over the 19 days from T-45 to T-26, while city hotels (N=16 properties) add +2.8pt and ryokan +0.9pt — both close to flat. In other words, city hotels are “already high at T-45”; they are not surging just before the stay date. Business hotels, conversely, start low at T-45 and fill a little at a time, day after day. For the same stay date, the very timing at which bookings arrive differs by hotel type. The question of whether a hotel type that is higher at T-45 has less headroom left near the stay date has also been tested in neighboring Tochigi; reading this alongside our analysis of Tochigi’s booking curves by hotel type for August-September 2026 shows whether the pattern repeats across prefectures.
Source: Compiled by the HotelBank Editorial Team from MetroEngines Research
That said, the observed population for city hotels is small at 16 properties. Readers should always discount for the fact that a single property withdrawing inventory — or releasing a large volume of it — is enough to move the figure by several points. The same applies to ryokan: although 71-74 properties are registered in the prefecture, the number actually observed ranges from 44 to 71 depending on the stay date. On a date with few observed properties, estimated OCC cannot distinguish a genuine trough in demand from a merely thin cross-section. In the tables below, the observed property count is always shown for both T-45 and the latest observation.
One more structural point worth confirming is the obvious one: the closer the date, the larger the pickup. Saturday, August 22 has already been observed to within 5 days out, and business hotels have built from 72.2% at T-45 to 84.5% at the latest observation, a gain of +12.3pt. By contrast, Saturday, September 26 — still 40 days out — went from 71.0% at T-45 to 71.8%, just +0.8pt. September 26 is not weak; it simply still has a build-up period ahead of it. When comparing curves, you must always compare points at the same number of days out.
| Stay date | Hotel type | T-45 | T-30 | Latest obs. | Pickup | Sellout rate (latest) |
Properties observed (T-45 → latest) |
|---|---|---|---|---|---|---|---|
| Sat 8/22 | Business | 72.2% | 75.9% | 84.5%(5 days out) | +12.3pt | 21.7% | 143→136 |
| City | 79.5% | 86.4% | 93.2% | +13.7pt | 18.8% | 16→15 | |
| Ryokan | 77.0% | 80.3% | 79.6% | +2.6pt | 36.1% | 53→52 | |
| Sat 8/29 | Business | 68.6% | 69.3% | 75.3%(12 days out) | +6.7pt | 11.2% | 144→147 |
| City | 70.9% | 75.4% | 77.3% | +6.4pt | 18.8% | 15→16 | |
| Ryokan | 71.3% | 73.2% | 76.0% | +4.7pt | 36.5% | 57→55 | |
| Sat 9/5 | Business | 64.9% | 66.1% | 69.1%(19 days out) | +4.2pt | 5.6% | 141→153 |
| City | 65.4% | 63.3% | 65.9% | +0.5pt | 0.0% | 16→16 | |
| Ryokan | 65.9% | 63.5% | 65.8% | -0.1pt | 21.6% | 53→62 | |
| Sat 9/12 | Business | 57.9% | 61.6% | 62.9%(26 days out) | +5.0pt | 9.4% | 154→149 |
| City | 77.1% | 79.6% | 79.9% | +2.8pt | 6.2% | 16→16 | |
| Ryokan | 64.4% | 63.7% | 65.3% | +0.9pt | 23.0% | 70→59 | |
| Sat 9/26 | Business | 71.0% | — | 71.8%(40 days out) | +0.8pt | 16.2% | 151→136 |
| City | 83.3% | — | 81.3% | -2.0pt | 43.8% | 14→12 | |
| Ryokan | 67.7% | — | 68.4% | +0.7pt | 35.6% | 71→55 |
September 26 is still 40 days out, so the T-30 observation point has not yet been reached. Source: Compiled by the HotelBank Editorial Team from MetroEngines Research
What stands out in the table is that the sellout rate for business hotels on Saturday, September 5 has fallen to 5.6%. Compared with 21.7% on Saturday, August 22 and 11.2% on Saturday, August 29, the number of properties with no confirmable listed inventory clearly declines once September begins. The process of returning to a normal week after summer-holiday demand drains away shows up more distinctly in the sellout rate than in the level of occupancy. Ryokan, by contrast, stay elevated at 21.6% even on September 5 and 35.6% on September 26 — a structural pattern in which, given small inventories, a certain number of properties are always in a “no listed inventory” state.
The peak of the five-day run is concentrated in the first three days — the break between 9/19-21 and 9/22-24
In September 2026, Monday, September 21 is Respect for the Aged Day, Tuesday, September 22 is a Citizens’ Holiday and Wednesday, September 23 is Autumnal Equinox Day, giving a five-day run from Saturday, September 19 through Wednesday, September 23 (per the holiday list published by the Cabinet Office, “National Holidays”). On top of that, the three-day stretch of Saturday, September 19 through Monday, September 21 (holiday) coincides with the dates of the Ishioka Festival (石岡のおまつり, the Hitachi-no-kuni Sosha-gu Grand Festival) in Ishioka City. A holiday run and a major local festival land on the same three days.
The booking curve reflects this structure fairly directly. On an all-properties basis at the latest observation (33-38 days out), a high level holds for three consecutive days — 74.9% on September 19, 73.9% on September 20 and 67.9% on September 21 — then falls sharply to 61.3% on September 22, 55.7% on September 23 and 56.5% on September 24. The gap between September 19 and September 23 is 19.2pt, comparable to the gap between September’s strongest and weakest Saturdays seen in the previous section. September 22 and 23 are holidays on the calendar, but in terms of accommodation demand they are not functioning as part of the holiday run.
Source: Compiled by the HotelBank Editorial Team from MetroEngines Research
By hotel type, there are clear differences in how the peak is built. The most dramatic case is business hotels. Sunday, September 20 stood at 57.9% at T-45 and has reached 69.5% at the latest observation (34 days out), a gain of +11.6pt. Monday, September 21 also moved from 53.9% to 63.9%, +10.0pt. Both far exceed the pickup seen on September Saturdays in Table 1 (+0.8 to +6.7pt). By contrast, Tuesday, September 22 moved only +0.9pt, from 58.7% at T-45 to 59.6% at the latest observation. Although the starting positions at T-45 were nearly identical — 57.9% on September 20 and 58.7% on September 22 — the growth paths diverged by more than 10pt over the following 11 days. In other words, the absolute level at T-45 alone cannot tell you whether a date is strong or weak.
City hotels (N=16 properties) show Saturday, September 19 at 91.4% as early as T-45 and 94.8% at the latest observation, the highest level of any stay date covered in this article. Note, however, that at the latest observation the observed property count has fallen to 13 of the 16 properties, so this is a cross-section that does not reflect the state of the remaining three — a reason to discount it. For ryokan, Sunday, September 20 is the highest at 90.9% with a 58.3% sellout rate at the latest observation, but here the observed property count has dropped to 44 of 72 properties. When properties whose listed inventory can no longer be confirmed drop out of the observation, the estimated OCC calculated from the remaining properties can overstate or understate the true level. A high number on a thin cross-section cannot simply be read as “sold out.”
| Stay date | Calendar | All properties | Pickup (all properties) |
Business | City (N=16) |
Ryokan | Sellout rate (all properties) |
Properties observed (all properties, T-45 → latest) |
|---|---|---|---|---|---|---|---|---|
| 9/19 | Sat | 74.9% | +3.2pt | 71.4% | 94.8% | 81.7% | 36.4% | 318→248 |
| 9/20 | Sun | 73.9% | +10.1pt | 69.5% | 85.1% | 90.9% | 40.9% | 320→241 |
| 9/21 | Mon · Respect for the Aged Day | 67.9% | +8.4pt | 63.9% | 73.1% | 85.8% | 30.1% | 318→262 |
| 9/22 | Tue · Citizens’ Holiday | 61.3% | +1.1pt | 59.6% | 63.1% | 68.2% | 21.5% | 322→277 |
| 9/23 | Wed · Autumnal Equinox Day | 55.7% | +0.1pt | 54.8% | 57.4% | 58.8% | 15.8% | 322→292 |
| 9/24 | Thu | 56.5% | -0.1pt | 55.0% | 62.3% | 57.3% | 14.8% | 323→293 |
Pickup is the difference from T-45 to the latest observation. All of these stay dates are more than 30 days out, so this is a snapshot of the sales position at the current point in time. Source: Compiled by the HotelBank Editorial Team from MetroEngines Research
The same fault line appears in the sellout rate. On an all-properties basis: 40.9% on September 20, 36.4% on September 19 and 30.1% on September 21, versus 21.5% on September 22, 15.8% on September 23 and 14.8% on September 24. The first three days sit at roughly twice the level of the last three. Note that all of these stay dates were still at least 33 days out at the time of observation, and inventory may still move in and out between now and the stay date. These are figures to read as a current cross-section; it is too early to state definitively how far they will ultimately fill. The phenomenon of the back half of a holiday run sinking to normal-weekday levels is not unique to Ibaraki: our analysis of booking progress for the back half of Silver Week 2026 confirmed at a T-47 checkpoint that September 23 was running at the level of an ordinary Wednesday.
The “baseline shape” of a normal week — July actuals by day of week
To evaluate the holiday peak, you need to know what a normal week looks like. Averaging the actuals for July 2026, a completed month (the observation immediately before each stay date), by day of week, Ibaraki on an all-properties basis reads Mon 82.9%, Tue 88.2%, Wed 88.2%, Thu 88.0%, Fri 84.2%, Sat 89.8%, Sun 79.1%. The monthly average was 85.9%.
Source: Compiled by the HotelBank Editorial Team from MetroEngines Research
By hotel type, Ibaraki’s business hotels (N=156-163 properties) run high mid-week at Tue 88.5%, Wed 88.7% and Thu 88.2%, with Saturday reaching a comparable 89.3%, while Sunday is the weekly low at 77.5%. The Saturday-Sunday gap is 11.8pt. This is the classic shape in which two peaks coexist — weekday business and construction demand, and Saturday leisure demand — with only Sunday forming a trough. City hotels (N=16 properties) show an even wider drop, at Sat 90.6% versus Sun 76.1%, a 14.5pt gap.
Ryokan (N=55-72 properties), by contrast, show a completely different shape: Mon 83.4%, Tue 84.5%, Wed 84.2%, Thu 83.0%, Fri 85.1%, Sat 91.2%, Sun 88.6% — a Saturday-Sunday gap of just 2.6pt. Not only is the day-of-week variation small, but the sellout rate stays high even on weekdays, at 54.2-58.7%. Many of these properties have small inventories, so a certain number are in a no-listed-inventory state even on weekdays, which flattens the day-of-week averages. For ryokan, tracking the sellout rate together with the observed property count for each stay date gets closer to reality than reading by day of week. This structure — where the position of the weekly peaks and troughs shifts by hotel type — is explored from the same angle in our analysis showing that Kumamoto’s day-of-week occupancy inverts by hotel type.
The important point here is that two facts hold simultaneously: Sunday is the weakest day in a normal week, and Sunday, September 20 has built +10.1pt (all properties) because it falls within a holiday run. For a business hotel, an ordinary Sunday and a Sunday in the middle of a holiday run are entirely different products. Applying a year-round day-of-week setting unchanged to a holiday run risks selling the day with the most upside at the lowest price.
For revenue managers running hotels and ryokan in Ibaraki — implications and an action plan
1. Compare your own curve with the market at “points with the same number of days out,” not by level. As Table 1 shows, the +0.8pt on Saturday, September 26 is not weakness — it is simply that the date is still 40 days out. For each of your own stay dates, start by cutting the same fixed checkpoints — T-45, T-30 and the latest observation — and lining them up against the market at the identical checkpoints. For Saturday, September 12, the business-hotel market’s 57.9% at T-45, 61.6% at T-30 and 62.9% at the latest observation is your yardstick.
2. Even from the same position at T-45, subsequent growth diverges. For business hotels, Sunday, September 20 and Tuesday, September 22 were nearly identical at T-45, at 57.9% and 58.7%, but at the latest observation they had split to 69.5% and 59.6%. If you look only at the T-45 level, judge that “this date is still weak” and release inventory cheaply, you will miss the dates that grow. On dates carrying a holiday run or a major local event, there is room to wait even if T-45 is low.
3. A different hotel type means a different curve to reference. City hotels are already high at T-45 and stay roughly flat through to the latest observation; business hotels start low at T-45 and build a little each day. Which of the two patterns your property resembles changes when you should stage rate changes. For the former, the settings made before T-45 decide the outcome; for the latter, the number of revisions between T-45 and the days just before the stay date is what counts.
4. Do not base decisions on numbers from a thin cross-section. City hotels number 16 properties in the prefecture, and observed ryokan swing between 44 and 71 depending on the stay date. A high estimated OCC on a date where the observed property count has fallen sharply cannot distinguish genuine demand strength from inventory being withdrawn. Always check the observed property count before using a figure as an input to a decision.
5. Always override the day-of-week template during holiday runs. In the July actuals, Sunday is the weekly low for business hotels at 77.5%, yet Sunday, September 20 has built +10.1pt across the market as a whole. If you maintain fixed day-of-week settings, run holiday periods on a separate calendar.
| Time frame | Action | Decision trigger (figures from this article) | Objective |
|---|---|---|---|
| Today – this week | Carve the three days of 9/19-21 out as a separate calendar from September’s other weekends | All-properties latest observation reads 9/19=74.9%, 9/20=73.9%, 9/21=67.9%, versus 9/12=65.4% and 9/5=68.2% | Avoid running the three holiday days on normal-weekend settings |
| Today – this week | Match your own booking position for 9/19-21 against the market at two checkpoints: T-45 and the latest observation | Where your own pickup is clearly below the all-properties market’s +3.2pt / +10.1pt / +8.4pt (9/19 / 20 / 21) | Separate an exposure shortfall from over-restrictive settings |
| Within two weeks | Switch the inventory policy for 9/22-24 from holiday treatment to normal-week treatment | All-properties latest observation reads 9/22=61.3%, 9/23=55.7%, 9/24=56.5%, with pickup of +1.1pt / +0.1pt / -0.1pt | Avoid holding out on the strength of the calendar alone |
| Within two weeks | Prepare a final-stretch plan for remaining inventory on 9/5 and 9/12 in the near-in range | Business hotels built +12.3pt from T-45 to 5 days out on 8/22, and +6.7pt by 12 days out on 8/29 | Factor in the room to build close to the stay date |
| Looking to next month | Fix in your schedule the timing for taking the T-45 checkpoint on weekends and holiday runs from October onward | Saturday, September 26 is 40 days out, with the market’s business hotels at 71.0% → 71.8% — not yet enough to judge on | Build a state in which you can compare at the same checkpoints year-round |
| Looking to next month | Review your standard day-of-week settings once a year against your own actual day-of-week curve | In the July actuals, the prefecture’s business hotels read Tue 88.5%, Wed 88.7%, Thu 88.2% and Sat 89.3%, versus Sun 77.5% (Sat-Sun gap 11.8pt) | Reflect the twin-peak structure of mid-week and Saturday in your settings |
Source: Compiled by the HotelBank Editorial Team from MetroEngines Research
Summary — three yardsticks for reading Ibaraki’s curves
Yardstick 1: Compare at the same number of days out. Unless you fix checkpoints at T-45, T-30 and the latest observation, you will misread a date that is simply “not filled yet because it is still far off” as weakness. The +0.8pt for business hotels on Saturday, September 26 is not weaker than the +5.0pt on Saturday, September 12; the observation period is just shorter.
Yardstick 2: Read the T-45 level and the subsequent growth as separate things. City hotels are already high at T-45 (77.1% for 9/12) and move only +2.8pt from there. Business hotels start low at T-45 (57.9% for the same date) and add +5.0pt. And September 20, which falls in the holiday run, shows growth on another scale entirely: +11.6pt from 57.9% at T-45. Starting position and slope are two different pieces of information.
Yardstick 3: Always read the figure together with the observed property count. The highest number in this article is ryokan at 90.9% on September 20, but that is a cross-section of 44 of 72 properties. City hotels have a base of 16 properties. The size of a number and the number of properties supporting it should always be checked together. On the thick all-properties cross-section for the whole prefecture (318-323 properties at T-45, 241-293 at the latest observation) and on a thin cross-section by hotel type, the same 1pt does not mean the same thing.
About the data
| Definition of estimated OCC | Occupancy on an OTA-listed-inventory basis = 100 − 100 × rooms remaining listed on OTAs ÷ total rooms. It is an estimate based on how listed inventory is being sold down on OTAs, and is defined differently from actual room occupancy (it reads higher). In the body text it is written as “estimated OCC (OTA-listed-inventory basis).” |
| Booking curve | Based on observations from 45 days before the stay date through to the latest observation. Stay dates covered are August 22 to September 26, 2026. The latest observation date is August 17, 2026. |
| Sellout rate | The estimated share of properties for which no listed inventory can be confirmed on OTAs and similar channels for the given stay date. It does not distinguish between inventory being withdrawn from listing and inventory being fully sold. |
| Day-of-week actuals | For each stay date in July 2026 (a completed month), the observation immediately before the stay date, averaged as a simple mean by day of week. Scope is the 31 days from July 1 to July 31, 2026. |
| Breakdown of N | Ibaraki (internal area classification) overall N=338 properties / 18,666 rooms. By hotel type the population varies by stay date: business hotels N=160-161 properties (13,647-13,667 rooms), city hotels N=16 properties (1,823 rooms), ryokan N=71-74 properties (1,483-1,544 rooms). The number of properties actually observed (observed property count) is given for each stay date in Tables 1 and 2. |
| On price metrics | This article is built solely around occupancy and sellout-rate axes; price metrics (estimated settled ADR and the like) are not covered. |
| Data as of | Data as of: August 18, 2026. Sales positions and inventory change daily, so the figures in this article are a snapshot as at the time of retrieval. |
■ Data sources
· Estimated OCC (OTA-listed-inventory basis), sellout rate and observed property count: MetroEngines Research accommodation inventory aggregation (registered properties in Ibaraki, N=338 properties / 18,666 rooms). For each stay date, data is retrieved daily from 45 days out through to the latest observation.
· Estimated OCC by day of week: for each stay date from July 1 to 31, 2026 (a completed month), the observation immediately before the stay date, averaged as a simple mean by day of week (by hotel type, N=business 160-161 properties / city 16 properties / ryokan 71-74 properties).
· Calendar (public and citizens’ holidays): Cabinet Office, “National Holidays.” September 21, 2026 = Respect for the Aged Day; September 22 = Citizens’ Holiday; September 23 = Autumnal Equinox Day.
· Local event dates: official site of the Hitachi-no-kuni Sosha-gu Grand Festival, Ishioka no Omatsuri (常陸國總社宮例大祭「石岡のおまつり」), and the Ishioka City Tourism Association (September 19-21, 2026).
■ Basis of calculation
· Curve comparisons are always made between points with the same number of days out (lead time), with the starting point fixed at 45 days before the stay date. The range beyond 45 days is outside the scope of this article.
· “Latest observation” refers to the newest cross-section observable as at this article’s data date (August 18, 2026; latest observation date August 17, 2026); the number of days out differs by stay date (9/12 is 26 days out, 9/19-9/24 are 33-38 days out). Pickup figures include this difference in days out.
· Comparisons by hotel type are made for the same stay date and the same hotel type; no averaging across days of the week is applied. The six days of the holiday run are arranged by calendar (public and citizens’ holidays) rather than by day of week.
· The normal-week baseline is the day-of-week average of the July 2026 actuals, and the levels on holiday and event dates are read as differences from that baseline.
■ Limitations and caveats
· Estimated OCC is an estimate based on how OTA-listed inventory is being sold down, and is defined differently from actual room occupancy (it reads higher). It cannot be read as a substitute for actual occupancy.
· The observed property count varies by stay date and hotel type (on an all-properties basis, 318-323 properties at T-45 versus 241-293 at the latest observation). Properties whose listed inventory can no longer be confirmed drop out of the observation, so estimated OCC calculated from the remaining properties can run either above or below the true level.
· City hotels have a small base at N=16 properties, and observed ryokan also swing between 44 and 71 depending on the stay date. Figures from thin cross-sections need to be read with a margin. Tables 1 and 2 in the body show the observed property count for each stay date.
· The sellout rate is the share of properties for which no listed inventory can be confirmed; it does not distinguish full sell-out from withdrawal of listed inventory.
· Because less than two years of observation data has accumulated, year-on-year comparisons of estimated OCC are not covered in this article.
· This article is built solely around occupancy and sellout-rate axes; price metrics (estimated settled ADR and the like) are not covered.
· Data as of: August 18, 2026. Sales positions and inventory change daily, so the figures in this article are a snapshot as at the time of retrieval.
References and sources
| Source | Content referenced |
|---|---|
| Cabinet Office, “National Holidays” | September 21, 2026 = Respect for the Aged Day; September 22 = Citizens’ Holiday; September 23 = Autumnal Equinox Day |
| Official site of the Hitachi-no-kuni Sosha-gu Grand Festival, Ishioka no Omatsuri (常陸國總社宮例大祭「石岡のおまつり」) | 2026 festival schedule (September 19 Shinkosai, September 20 Hoshukusai and votive sumo, September 21 Kankosai) |
| Ishioka City Tourism Association, “Ishioka no Omatsuri (Hitachi-no-kuni Sosha-gu Grand Festival)” | Event dates of Saturday, September 19, Sunday, September 20 and Monday, September 21 (holiday), 2026 |
Related reading
- Tochigi Booking Curves by Type: Resort 81.1% at T-45, Only +2.6pt Left
- Silver Week 2026 Back Half at T-47: Sep 23 Matches a Normal Wednesday
- Osaka Sep 2026 Holiday: Demand Peaks First 2 Nights, Sep 23 at 58.0%
- Chiba 4 Hotel Types: 22.7pt Gap at T-45 Narrows to 16.0pt by T-21
- Kumamoto Day-of-Week Occupancy Inverts by Type: Thu 88.3% vs Sat 89.9%
- Saitama Business Hotels: Sat 77.2% vs Sun 70.1%, Gap Widens to 11pt
- Hyogo Booking Curves: 3.6x Pickup Gap, Ryokan Sellout Rate 28.4%
- Okayama Booking Curves: 3 Checkpoints, Aug 8 Late-Surges +11.8pt
- Ibaraki Breakfast Premium +5.8% vs Two-Meal +52.3% (July 2026)