

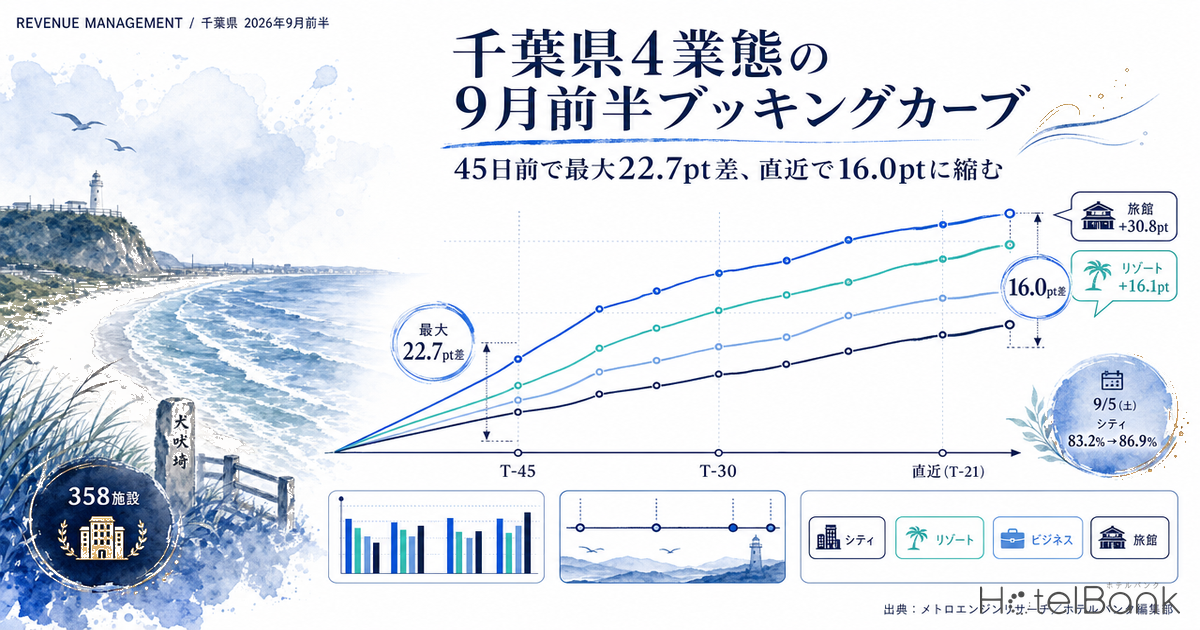
Line up the booking curves for lodging demand in Chiba over the first half of September 2026 (Sep 1–15) across four hotel types — city hotels, resorts, business hotels and ryokan — and the way reservations come in differs clearly by type even for the same stay date. On Saturday, September 5, the demand peak of the period, estimated OCC at 45 days before the stay date stood at 83.2% for city hotels (51 properties observed), 80.3% for resorts (54), 77.0% for business hotels (131) and 60.5% for ryokan (80) — a spread of up to 22.7pt. At the latest snapshot, however (21 days before the stay date, observed August 15, 2026), the four read 86.9%, 85.0%, 84.1% and 70.9%, narrowing the spread to 16.0pt. The gap visible at 45 days out is not the gap September will actually land on.
Scope: Chiba — city hotels N=52 properties, resort hotels N=59, business hotels N=140, ryokan N=107 (358 properties in total). This article does not treat price metrics; occupancy is used only as an estimate based on OTA-published inventory. Definitions appear at the end of the article. Data as of August 16, 2026.
- — Up to 22.7pt → 16.0pt — at 45 days out, Sat Sep 5 shows a 22.7pt spread across hotel types; at the latest snapshot it narrows to 16.0pt. The spread at 45 days out is not the spread at landing.
- — Ryokan +30.8pt / resorts +16.1pt — measured pickup over 14 stay dates in early July (median). How much can still be added over the remaining runway differs by roughly 2x across hotel types.
- — Type differences > day-to-day variation — the ryokan daily range of +27.1 to +34.5pt sits above the upper bound of the other three types (+19.9 to +24.6pt), so it can be treated as a structural difference.
- — City hotels are back-loaded — on Tue Sep 1, 45 to 30 days out added +2.8pt, while 30 days out to latest added +7.5pt. Using only the 45-day mark as a checkpoint leads to misreading them as slow.
- — Day-of-week amplitude varies by type — at 45 days out, the Saturday-versus-Monday gap is around 14pt for city and business hotels but under 5pt for resorts.
Saturday September 5 at Three Checkpoints — 45 Days Out, 30 Days Out, Latest
We start by lining up Saturday, September 5 — the stay date with the highest estimated OCC in early September — alongside Tuesday, September 1 as a representative weekday, at three checkpoints: 45 days out, 30 days out and the latest snapshot. “Latest” here means the observation snapshot of August 15, 2026, which falls 17 days before the Sep 1 stay date and 21 days before Sep 5. For the same three-checkpoint framework applied to a neighbouring market, see Tokyo Early Sep: Booking Curves at T-45/T-30/T-14, OCC 76.0-81.5%.
| Hotel type | Sep 1 (Tue) estimated OCC | Sep 5 (Sat) estimated OCC | ||||
|---|---|---|---|---|---|---|
| T-45 | T-30 | Latest | T-45 | T-30 | Latest | |
| City | 68.0% N=51 |
70.8% N=51 |
78.3% N=51 |
83.2% N=51 |
85.8% N=52 |
86.9% N=51 |
| Resort | 72.9% N=51 |
74.3% N=57 |
76.6% N=59 |
80.3% N=54 |
83.4% N=58 |
85.0% N=59 |
| Business | 62.9% N=133 |
66.2% N=137 |
70.8% N=140 |
77.0% N=131 |
82.0% N=137 |
84.1% N=140 |
| Ryokan | 52.5% N=75 |
57.0% N=100 |
63.3% N=106 |
60.5% N=80 |
66.6% N=99 |
70.9% N=106 |
Source: MetroEngines Research; compiled by the HotelBank Editorial Team
On Tue Sep 1, ryokan move from 52.5% at 45 days out (75 properties) to 57.0% at 30 days out (100) to 63.3% at the latest snapshot (106), adding 10.8pt between 45 days out and the latest reading. City hotels on the same date go 68.0% → 70.8% → 78.3%, a 10.3pt gain — but the breakdown shows only 2.8pt of movement through the 30-day mark, with the remaining 7.5pt concentrated after it. In other words, even at a similar +10pt, ryokan build gradually from the 45-to-30-day window while city hotels move sharply once inside 30 days.
On Sat Sep 5, by contrast, city hotels are already at 83.2% at 45 days out, and add only 3.7pt from there to the latest snapshot. For city hotels, a Saturday is largely settled by 45 days out. Ryokan on the same Saturday start from 60.5% at 45 days out and add 10.4pt by the latest reading. Even on an identical demand date, when the rooms fill differs completely by hotel type.
Source: MetroEngines Research; compiled by the HotelBank Editorial Team
Plotting the curve shape against days remaining makes the difference clearer still. City hotels and resorts run almost flat from 45 days out to around 38 days out, while the ryokan slope changes at about 33 days out. Business hotels sit in the 77% range from 45 days out to 36 days out, then climb at a steady pace all the way to the latest snapshot — the closest of the four types to a curve that works in the back half.
Fifteen Stay Dates in Early September — How Many Points Were Added from 45 Days Out to the Latest Snapshot
Now the full period, day by day. The table below summarises, for each stay date from Sep 1 to Sep 15, the estimated OCC at 45 days out, the estimated OCC at the latest snapshot (observed August 15, 2026, which is 17 to 31 days before the stay date) and the difference between them, by hotel type. The number of properties observed varies by snapshot, so it is shown alongside each figure.
| Stay date | City T-45 → latest |
Resort T-45 → latest |
Business T-45 → latest |
Ryokan T-45 → latest |
|---|---|---|---|---|
| Sep 1 (Tue) | 68.0% (N=51) → 78.3% (N=51) +10.3pt | 72.9% (N=51) → 76.6% (N=59) +3.7pt | 62.9% (N=133) → 70.8% (N=140) +7.9pt | 52.5% (N=75) → 63.3% (N=106) +10.8pt |
| Sep 2 (Wed) | 65.2% (N=51) → 79.0% (N=51) +13.8pt | 73.9% (N=51) → 78.5% (N=59) +4.6pt | 64.7% (N=133) → 72.6% (N=140) +7.9pt | 53.2% (N=74) → 60.4% (N=106) +7.2pt |
| Sep 3 (Thu) | 66.8% (N=51) → 83.3% (N=51) +16.5pt | 75.3% (N=52) → 79.3% (N=59) +4.0pt | 65.2% (N=133) → 73.6% (N=140) +8.4pt | 57.0% (N=79) → 62.7% (N=106) +5.7pt |
| Sep 4 (Fri) | 68.0% (N=51) → 73.7% (N=51) +5.7pt | 79.9% (N=53) → 81.3% (N=59) +1.4pt | 67.3% (N=132) → 76.6% (N=140) +9.3pt | 55.4% (N=88) → 64.2% (N=106) +8.8pt |
| Sep 5 (Sat) | 83.2% (N=51) → 86.9% (N=51) +3.7pt | 80.3% (N=54) → 85.0% (N=59) +4.7pt | 77.0% (N=131) → 84.1% (N=140) +7.1pt | 60.5% (N=80) → 70.9% (N=106) +10.4pt |
| Sep 6 (Sun) | 76.3% (N=51) → 84.2% (N=51) +7.9pt | 75.8% (N=53) → 78.4% (N=59) +2.6pt | 69.2% (N=133) → 75.5% (N=140) +6.3pt | 54.9% (N=86) → 62.3% (N=106) +7.4pt |
| Sep 7 (Mon) | 60.8% (N=51) → 63.3% (N=51) +2.5pt | 75.1% (N=52) → 79.2% (N=59) +4.1pt | 63.2% (N=134) → 70.2% (N=140) +7.0pt | 52.3% (N=83) → 58.6% (N=106) +6.3pt |
| Sep 8 (Tue) | 64.8% (N=49) → 71.5% (N=51) +6.7pt | 74.1% (N=54) → 78.0% (N=59) +3.9pt | 63.9% (N=138) → 71.7% (N=140) +7.8pt | 53.0% (N=81) → 60.0% (N=106) +7.0pt |
| Sep 9 (Wed) | 67.4% (N=49) → 73.4% (N=51) +6.0pt | 74.3% (N=54) → 76.9% (N=59) +2.6pt | 65.7% (N=138) → 70.9% (N=140) +5.2pt | 48.6% (N=83) → 54.8% (N=106) +6.2pt |
| Sep 10 (Thu) | 68.5% (N=49) → 74.0% (N=51) +5.5pt | 76.1% (N=54) → 79.4% (N=59) +3.3pt | 65.9% (N=138) → 72.5% (N=140) +6.6pt | 50.0% (N=86) → 56.0% (N=106) +6.0pt |
| Sep 11 (Fri) | 66.7% (N=51) → 72.1% (N=51) +5.4pt | 74.8% (N=59) → 80.5% (N=59) +5.7pt | 69.7% (N=141) → 73.9% (N=141) +4.2pt | 54.8% (N=105) → 61.6% (N=106) +6.8pt |
| Sep 12 (Sat) | 69.0% (N=51) → 74.2% (N=51) +5.2pt | 76.0% (N=59) → 82.9% (N=59) +6.9pt | 75.3% (N=127) → 79.0% (N=141) +3.7pt | 61.3% (N=105) → 66.7% (N=105) +5.4pt |
| Sep 13 (Sun) | 62.9% (N=51) → 65.9% (N=51) +3.0pt | 71.0% (N=55) → 74.3% (N=59) +3.3pt | 64.6% (N=141) → 68.3% (N=141) +3.7pt | 52.6% (N=92) → 58.1% (N=106) +5.5pt |
| Sep 14 (Mon) | 63.8% (N=51) → 66.2% (N=52) +2.4pt | 71.5% (N=53) → 73.6% (N=58) +2.1pt | 60.1% (N=137) → 64.3% (N=138) +4.2pt | 52.0% (N=94) → 57.1% (N=100) +5.1pt |
| Sep 15 (Tue) | 68.4% (N=50) → 70.7% (N=52) +2.3pt | 72.4% (N=52) → 74.8% (N=58) +2.4pt | 64.5% (N=134) → 67.9% (N=138) +3.4pt | 56.0% (N=92) → 59.8% (N=101) +3.8pt |
Source: MetroEngines Research; compiled by the HotelBank Editorial Team
Taking the median across the 15 stay dates, estimated OCC at 45 days out is 67.4% for city hotels, 74.8% for resorts, 65.2% for business hotels and 53.2% for ryokan; at the latest snapshot it is 73.7%, 78.5%, 72.5% and 60.4% respectively. Median gains are +5.5pt for city hotels, +3.7pt for resorts, +6.6pt for business hotels and +6.3pt for ryokan — resorts move the least.
The standout by day is city hotels on Thu Sep 3, moving 16.5pt from 66.8% at 45 days out (51 properties) to 83.3% at the latest snapshot (51) — the largest gain of the period. Wed Sep 2 adds 13.8pt and Tue Sep 1 adds 10.3pt, so city hotel gains cluster in the first three weekdays of the month. By contrast, city hotels on Mon Sep 7 move only 2.5pt, from 60.8% at 45 days out to 63.3% at the latest snapshot — one of the quietest readings in the period. Within a single hotel type, shifting the stay date by one week changes the behaviour of the final three weeks this much.
The ryokan trough is Wed Sep 9, running from 48.6% at 45 days out (83 properties) to 54.8% at the latest snapshot (106) — the only reading in the period where 45 days out fell below 50%. The low level is consistent against the neighbouring dates as well (Tue Sep 8 at 53.0% → 60.0%, Thu Sep 10 at 50.0% → 56.0%), so this is not an apparent trough caused by thin observation counts.
Source: MetroEngines Research; compiled by the HotelBank Editorial Team
Laying the latest snapshot out day by day, city and business hotels form local peaks on the Saturdays (Sep 5 and Sep 12) and troughs on the Mondays (Sep 7 and Sep 14) and on Sun Sep 13 — the shape of business travel demand overlaid on weekend demand. Resorts show a clearly smaller day-of-week amplitude, with their latest snapshot for Sep 1 to Sep 15 contained within a 73.6% to 85.0% band. Ryokan sit at a lower level, but their peaks and troughs land in nearly the same places as those of city and business hotels.
Averaging the 45-days-out snapshot by day of week gives Saturdays at 76.1% for city hotels, 78.2% for resorts, 76.2% for business hotels and 60.9% for ryokan; Mondays give 62.3%, 73.3%, 61.7% and 52.1% respectively. The Saturday-versus-Monday gap is around 14pt for city and business hotels but under 5pt for resorts. For early September at least, Chiba resort inventory is more likely to have its curve set by property-specific circumstances than by day of week.
Sizing the Remaining Runway Using Measured Pickup from Early July
Stay dates in early September are still frozen at the latest snapshot, so how much will be added between here and the stay date itself is unknown. To size that, we measured actual pickup (in points) from the 45-days-out snapshot to the day-before-stay snapshot for the same four hotel types in Chiba over early July 2026 (14 stay dates from Jul 2 to Jul 15), a period that has already passed.
The medians are +19.4pt for city hotels, +16.1pt for resorts, +20.6pt for business hotels and +30.8pt for ryokan. Despite having the lowest reading at 45 days out, ryokan were the type that built the most over the final 45 days. Resorts, conversely, sit highest at 45 days out yet have the smallest remaining runway of the four types. Whether this relationship — the higher a type sits at 45 days out, the less room it has left — holds across prefectures is tested with the same question in Tochigi Booking Curves by Type: Resort 81.1% at T-45, Only +2.6pt Left.
Source: MetroEngines Research; compiled by the HotelBank Editorial Team
The gains observable so far for early September (median from 45 days out to latest: +5.5pt for city hotels, +3.7pt for resorts, +6.6pt for business hotels, +6.3pt for ryokan) cover only the 17 to 31 days up to the latest snapshot. Set against the pickup measured in early July, it is clear that the weight of the runway still remaining before the stay date differs greatly by type. The ryokan figure of 60.5% at 45 days out for Sep 5 cannot be dismissed as weak precisely because this type structurally carries a late-booking curve.
The converse also holds: for a type such as resorts, where little can still be added over the remaining runway, the number visible at 45 days out is close to the final shape. The fact that resorts in early September sat at a median 74.8% at 45 days out should be read by resort operators not as “there is still upside” but as “the leverage available from here is limited.” Note that this article covers the occupancy side only; for rate movements in the same prefecture, Chiba Settled ADR: H1 2026 Beats Last Year, July Turns -8.2% separates the picture using settled-month YoY on estimated settled ADR.
For Revenue Managers Running Hotels and Ryokan in Chiba — Implications and Action Plan
1. Your pace cannot be judged without benchmarking against the curve for your own hotel type. At 45 days out, Sat Sep 5 read 83.2% for city hotels, 80.3% for resorts, 77.0% for business hotels and 60.5% for ryokan — a 22.7pt spread. Comparing your own 45-days-out booking position with the prefecture-wide average is meaningless; only a comparison against the same hotel type supports a verdict of fast or slow. A ryokan running in the 60% range is, in this market, simply the standard shape.
2. The leverage left in the remaining runway differs by type. Pickup measured on early-July stay dates was +30.8pt for ryokan versus +16.1pt for resorts. Faced with the same situation of being short of target at 45 days out, a ryokan can factor in the chance that remaining demand fills the gap, whereas a resort — with less room to add — should consider revisiting inventory allocation at an earlier stage.
3. The timing of the gains shifts by type. For city hotels on Tue Sep 1, 45 to 30 days out contributed 2.8pt while 30 days out to latest contributed 7.5pt — heavily back-loaded. Ryokan, by contrast, are already moving in the 45-to-30-day window. Placing the checkpoint only at 45 days out makes it easy to misread city hotels as slow. The safe practice is to always read the 30-days-out snapshot alongside it.
4. The size of the day-of-week amplitude is itself a characteristic of the hotel type. At 45 days out, the Saturday-to-Monday gap was around 14pt for city and business hotels but under 5pt for resorts. Varying how inventory is released by day of week is meaningful for the former; for resorts, looking at circumstances specific to each individual stay date fits practice better than looking at day of week.
Working back from the present point, with under three weeks left before the early-September stay dates, the following organises the available moves by time horizon.
| Time horizon | Move | Decision trigger (tied to figures in this article) | Objective |
|---|---|---|---|
| Today to this week | Review the two Saturdays, Sep 5 and Sep 12, as the top priority | When your own pace on those dates sits clearly away from the latest snapshot for your hotel type (city 86.9% / resort 85.0% / business 84.1% / ryokan 70.9%, all for Sep 5) | Avoid leaving business on the table on the demand peak of the period |
| Today to this week | Consider room to shift inventory toward the trough dates of Mon Sep 7 and Mon Sep 14 | Once you have confirmed whether the pattern of a roughly 14pt Saturday-to-Monday gap at 45 days out for city and business hotels also reproduces at your property | Align allocation with the within-week demand trough |
| Within two weeks | For ryokan, prepare the catchment for the late window first (how remaining rooms are presented, stay conditions) | When, against the +30.8pt ryokan pickup measured in early July, your property still has ample capacity to take bookings over the remaining runway | Capture the late-booking curve rather than missing it |
| Within two weeks | For resorts, shift the centre of gravity of review toward dates from late September onward | When, given that the median remaining pickup is the smallest of the four types (+16.1pt), you can conclude that the room to move over the rest of early September is limited | Allocate effort to the periods where leverage is greatest |
| Looking to next month | Build the three checkpoints — 45 days out, 30 days out and just before stay — into your regular internal review | Once you can confirm on past dates a back-loaded shape like city hotels on Tue Sep 1, with 2.8pt from 45 to 30 days out and 7.5pt after the 30-day mark | Reduce misreadings caused by a single checkpoint |
| Looking to next month | Build your own pickup profile by hotel type from past actuals and use it as an internal benchmark | When your own measured pickup diverges from the market figures (city +19.4pt / resort +16.1pt / business +20.6pt / ryokan +30.8pt) | Improve decision accuracy at the 45-days-out mark |
Source: MetroEngines Research; compiled by the HotelBank Editorial Team
Summary — Three Yardsticks for Reading Early September in Chiba
Yardstick 1: the level gap at 45 days out is not the gap at landing. At 45 days out, Sat Sep 5 spread up to 22.7pt; at the latest snapshot the spread has narrowed to 16.0pt. Differences between hotel types move in the direction of narrowing as the days remaining fall.
Yardstick 2: how much can still be added over the remaining runway tends to be fixed by hotel type. Pickup measured on early-July stay dates from 45 days out to the day before stay ranged from +30.8pt for ryokan to +16.1pt for resorts — a roughly 2x spread across types. When judging your own 45-days-out position, estimate the remainder with that range in mind.
Yardstick 3: a single checkpoint at 45 days out is not enough. City hotels on Tue Sep 1 showed a back-loaded shape, with 2.8pt from 45 to 30 days out and 7.5pt after the 30-day mark. Only by lining up all three points — 45 days out, 30 days out and just before stay — can you distinguish a curve that is slow from one that is simply back-loaded.
About the Data
■ Data Sources
OTA-published inventory data collected by MetroEngines Research (the publicly offered room inventory of lodging facilities) was aggregated for 52 city hotels, 59 resort hotels, 140 business hotels and 107 ryokan in Chiba (358 properties in total). Booking-curve observation points are captured from 90 days before the stay date through the day before stay; this article analyses only the snapshots within a lead time of 45 days. Data as of August 16, 2026; the latest observation snapshot is August 15, 2026.
■ Calculation Assumptions
Estimated OCC (occupancy based on OTA-published inventory) = 100 − 100 × rooms still listed on OTAs ÷ total rooms. The checkpoints are three: 45 days before the stay date, 30 days before, and the latest snapshot (observed August 15, 2026), the last of which falls 17 to 31 days before the stay date depending on the date. Pickup is the difference in estimated OCC (in points) between the 45-days-out snapshot and the day-before-stay snapshot; the representative value per hotel type is the median of the daily values across 14 stay dates, and the range is the minimum to maximum of those values. Price metrics (estimated settled ADR) are not treated in this article; the sole axis of analysis is occupancy.
■ Limitations and Caveats
Estimated OCC is an estimate based on how inventory offered on OTAs is being taken up, and its definition differs from actual room occupancy (it reads higher than actual occupancy). Because the number of properties observed varies by snapshot even within the same hotel type, figures from snapshots with relatively few observations need to be read alongside other dates for the same type. Pickup for early July is an actual result measured on stay dates that have already passed and does not guarantee where early September will land. Sales conditions and inventory change daily, so the figures in this article are a snapshot as of the time of capture.
Related Reading
- Tochigi Booking Curves by Type: Resort 81.1% at T-45, Only +2.6pt Left
- Tokyo Early Sep: Booking Curves at T-45/T-30/T-14, OCC 76.0-81.5%
- Hiroshima Booking Curves: 26.2pt Gap at T-45, Ryokan +10.9pt Late
- Hyogo Booking Curves: 3.6x Pickup Gap, Ryokan Sellout Rate 28.4%
- Mie August Booking Curves: Business Hotels Swing 25.5pt, Ryokan 9.7pt
- Gunma Ryokan vs Resorts: +3.2pt and +5.5pt Gains from 45 Days Out
- Chiba Settled ADR: H1 2026 Beats Last Year, July Turns -8.2%
- Chiba Floods: Narita 2.29x, Urayasu 2.40x, Disaster-Hit Chuo 0.83x