

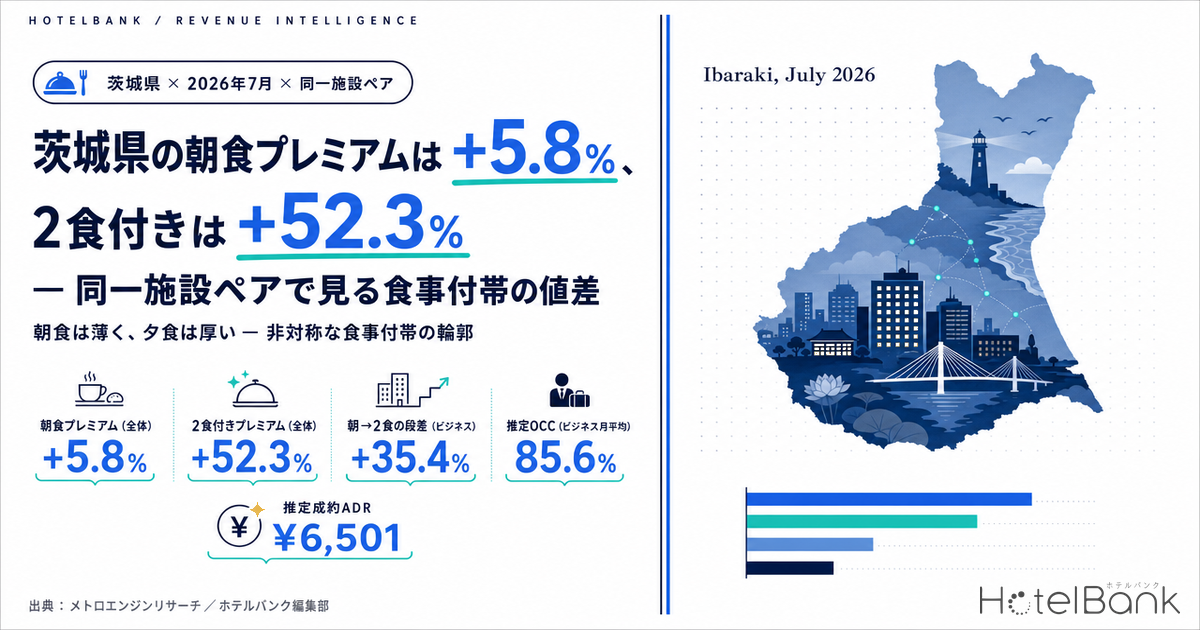
For hotels in Ibaraki Prefecture (excluding ryokan) in July 2026, the breakfast premium — measured only across properties that sold both a breakfast-included and a room-only product — came to +5.8% (104 property pairs, all-segment). That is 3.5 points below the +9.3% median of the 45 prefectures in the sample, placing Ibaraki 11th from the bottom. Yet within the same prefecture, the premium for a two-meal (dinner and breakfast) plan over room-only was +52.3% (37 property pairs) — 12.5 points above the national median of +39.8% (44 prefectures). The smallest increment, breakfast, is thin; the largest bundle, which includes dinner, is thick. That asymmetry is the shape of meal-ancillary revenue in Ibaraki in July 2026.
Scope: hotels in Ibaraki Prefecture (business / city / resort / deluxe / capsule; ryokan are excluded from the aggregation). N=104 property pairs (July 2026, all-segment, same-property pair comparison on a two-guests-per-room basis). Price figures in this article are estimated settled ADR (the transaction price level inferred from OTA and other sales data, on a pre-tax-equivalent basis); occupancy is an estimate based on OTA-listed inventory. Meal premiums are handled only as differential ratios between same-property pairs. All definitions appear at the end of the article. Data as of August 4, 2026.
- — Ibaraki’s breakfast premium is +5.8% (104 property pairs, July 2026) — 3.5 points below the +9.3% median across 45 prefectures, and 11th from the bottom.
- — Two-meal plans, by contrast, run +52.3% (37 property pairs), 12.5 points above the national median of +39.8%. Breakfast is thin; dinner is thick.
- — The step change is clearly located: moving from breakfast-included to two-meal is +35.4% at business hotels (22 property pairs) — roughly 4.7 times the +7.5% step from room-only to breakfast-included.
- — Estimated settled ADR is −0.1% year on year at business hotels and −6.3% at city hotels. Room-only rates themselves are hard to move in the current environment.
- — Estimated OCC is 85.6% (July 2026, business hotel monthly average). Tuesday through Thursday sit in the 88% range and Sunday at 77.5% — a weekday-led pattern, so ancillaries bite hardest midweek.
- — Closing the breakfast differential by +2.8 points to the national median works out to +¥91 per room in effective rate, or roughly ¥240,000 a month for a 100-room property (50% attachment, revenue basis).
Breakfast Premium +5.8% — 3.5 Points Below the 45-Prefecture Median
A meal premium is a comparison that only holds where a single property sells both a breakfast-included and a room-only product. Averaging across properties would inflate the figure in areas with a higher share of meal-inclusive lodging, so what follows looks only at differential ratios within same-property pairs. Ryokan are not part of the aggregation segments (the five categories are business, city, resort, deluxe and capsule), so every figure below describes how meals are priced within the hotel format.
The chart below ranks, from lowest to highest, the 45 prefectures with at least 15 valid pairs in the July 2026 all-segment sample. The median is +9.3%. Kyoto is highest at +18.6% (110 property pairs) and Yamaguchi lowest at −7.3% (54 property pairs); Ibaraki’s +5.8% (104 property pairs) is 11th from the bottom. Across the 45 prefectures, the total comes to 3,900 property pairs. Read across prefectures, the spread — from −7.3% to +18.6% — is far wider than the national median alone conveys.
Source: MetroEngines Research; compiled by the HotelBank Editorial Team
Splitting by segment sharpens the picture. Ibaraki’s business hotels come in at +7.5% (81 property pairs), below the +10.3% median of the 44 prefectures clearing 15 pairs in that segment. The segment high is Kyoto at +22.9% (68 property pairs) and the low is Saitama at +3.3% (58 property pairs). City hotels sit at +10.7% (15 property pairs) — the lowest level among the 13 prefectures with at least 15 pairs (segment median +14.4%, high Hyogo at +20.0% with 38 property pairs).
Set alongside neighboring prefectures, the thinness of the breakfast increment runs across the northern Kanto belt into Ibaraki. In the all-segment breakfast premium, Chiba stands out at +10.6% (124 property pairs), while Saitama +6.8% (73 property pairs), Tochigi +6.2% (76 property pairs), Gunma +6.1% (73 property pairs), Ibaraki +5.8% (104 property pairs) and Kanagawa +5.5% (167 property pairs) cluster in the 5–7% band. Ibaraki is not low as an isolated prefecture; it sits inside a trade area where breakfast differentials are uniformly small.
| Area (all-segment) | Breakfast premium rate | Properties with valid pairs |
|---|---|---|
| Chiba | +10.6% | 124 |
| Saitama | +6.8% | 73 |
| Tochigi | +6.2% | 76 |
| Gunma | +6.1% | 73 |
| Ibaraki | +5.8% | 104 |
| Kanagawa | +5.5% | 167 |
| National median (45 prefectures) | +9.3% | 3,900 (total) |
July 2026, two guests per room, same-property pairs; prefectures with at least 15 valid pairs / Source: MetroEngines Research; compiled by the HotelBank Editorial Team
Two-Meal Plans +52.3% — 12.5 Points Above the National Median
Look at the same prefecture through the two-meal versus room-only lens and the view changes. The all-segment figure is +52.3% (37 property pairs) and business hotels are at +50.9% (20 property pairs). The national all-segment median is +39.8% (44 prefectures with at least 15 pairs), with Ishikawa highest at +69.3% (22 property pairs) and Yamaguchi lowest at +19.8% (24 property pairs). Ibaraki clears the median by 12.5 points, placing it toward the upper end. The city hotel two-meal premium is +57.5%, but with only 10 valid pairs it should be read as indicative.
Source: MetroEngines Research; compiled by the HotelBank Editorial Team
Decomposing the increments makes the structure clearer. The step from room-only to breakfast-included is +7.5% at business hotels, while the step from breakfast-included to two-meal reaches +35.4% (22 property pairs). At city hotels the breakfast-to-two-meal step is +35.1% (9 property pairs, indicative). Adding dinner alone, versus room-only, came to +23.6% all-segment (14 property pairs). In other words, within Ibaraki’s hotel formats the revenue step change sits overwhelmingly on the question of whether dinner is attached, and breakfast is priced at a relatively thin increment. This structure — where dinner, not breakfast, does most of the work in lifting the rate — is not unique to Ibaraki; the same pattern appears at the national level.
| Comparison pair (Ibaraki, July 2026) | Segment | Premium rate | Properties with valid pairs |
|---|---|---|---|
| Breakfast-included ÷ room-only | All | +5.8% | 104 |
| Breakfast-included ÷ room-only | Business | +7.5% | 81 |
| Breakfast-included ÷ room-only | City | +10.7% | 15 |
| Dinner only ÷ room-only | All | +23.6% | 14 |
| Two-meal ÷ room-only | All | +52.3% | 37 |
| Two-meal ÷ room-only | Business | +50.9% | 20 |
| Two-meal ÷ breakfast-included | Business | +35.4% | 22 |
| Two-meal ÷ breakfast-included | City | +35.1% | 9 |
Two guests per room, same-property pairs. Rows with fewer than 15 valid pairs are indicative / Source: MetroEngines Research; compiled by the HotelBank Editorial Team
This shape is not a single-month coincidence. The breakfast premium at Ibaraki’s business hotels ran +8.6% in May 2026 (75 property pairs), +7.8% in June (80 property pairs) and +7.5% in July (81 property pairs), holding to a 7–8% range, while city hotels tracked around 10% at +8.3% in May, +9.6% in June and +10.7% in July (15 property pairs throughout). For August 2026, still in progress, the estimate based on current selling conditions puts business hotels at +8.8% (80 property pairs), city hotels at +10.7% (15 property pairs) and all-segment at +6.8% (99 property pairs) — the same range (figures for current and future months can move as selling conditions change).
Rates Flat to Softening, Occupancy Weekday-Led — Where the Room to Move Ancillaries Lies
Any thinking about how to price meals starts from where the underlying room rate sits. Ibaraki’s estimated settled ADR (finalized) was ¥6,506 at business hotels in July 2025 (181 properties) against ¥6,501 in July 2026 (187 properties) — essentially flat at −0.1% year on year. City hotels softened from ¥9,160 in July 2025 (18 properties) to ¥8,586 in July 2026 (17 properties), −6.3% year on year. Overlaying the full-year shape, business hotels ran above the prior year through the first half before converging to par in July, while city hotels fell below the prior year in February, April, May and July.
Source: MetroEngines Research; compiled by the HotelBank Editorial Team
For August 2026, the estimate based on current selling conditions puts estimated settled ADR at ¥9,844 for business hotels (180 properties) and ¥11,464 for city hotels (17 properties). Because these are calculated on a different basis from finalized figures, they should not be compared directly with the prior-year finalized values; better to wait for month-end settlement before drawing conclusions.
The occupancy side is worth checking too. Ibaraki’s business hotels posted estimated OCC of 85.6% (July 2026, monthly average, OTA-listed-inventory basis, 156–163 properties observed) and city hotels 85.3% (July 2026, monthly average, same basis, 15–16 properties observed). Averaged by day of week, business hotels peak on Saturday at 89.3%, followed by Wednesday at 88.7%, Tuesday at 88.5% and Thursday at 88.2%, with Sunday lowest at 77.5%. City hotels likewise peak on Saturday at 90.6%, with Thursday 88.3%, Tuesday 88.0% and Wednesday 87.1% keeping midweek high and Sunday bottoming at 76.1%. The single highest day in the month for both segments was Saturday, July 18 — 93.0% for business and 97.5% for city. The lowest was Sunday, July 5, at 73.5% for business and 67.0% for city. This day-of-week structure, with a Sunday trough and a midweek peak, is also observed among business hotels in other prefectures.
| Day of week (July 2026, Ibaraki) | Estimated OCC, business | Estimated OCC, city | Days counted |
|---|---|---|---|
| Mon | 82.5% | 80.7% | 4 |
| Tue | 88.5% | 88.0% | 4 |
| Wed | 88.7% | 87.1% | 5 |
| Thu | 88.2% | 88.3% | 5 |
| Fri | 83.6% | 85.2% | 5 |
| Sat | 89.3% | 90.6% | 4 |
| Sun | 77.5% | 76.1% | 4 |
Estimated OCC (OTA-listed-inventory basis); daily values for July 2026 averaged by day of week. Properties observed: 156–163 business, 15–16 city / Source: MetroEngines Research; compiled by the HotelBank Editorial Team
A pattern that runs high from Tuesday to Thursday and troughs on Sunday indicates that weekday business demand is the main axis of occupancy. Breakfast is, by nature, the ancillary that works best on exactly those midweek guests — yet in Ibaraki its increment sits below the national median. With occupancy holding in the 85% range and rates flat to softening, revisiting how the existing meal differential is set is a more accessible lever than trying to push the room-only rate itself higher.
For Revenue Managers Running Business and City Hotels in Ibaraki — Implications and Action Plan
(1) Hold your own breakfast differential against the market yardstick. The breakfast premium is +7.5% at Ibaraki’s business hotels (81 property pairs) and +10.7% at city hotels (15 property pairs). Simply dividing your own breakfast-included minus room-only gap by the room-only rate, then setting that ratio beside these levels, shows where your property sits within the prefecture. The distance to the national median (business +10.3%, city +14.4%) gives a sense of how much room there is to redesign the differential.
(2) The step change sits with dinner. Against a +7.5% step from room-only to breakfast-included, the step from breakfast-included to two-meal is +35.4% at business hotels (22 property pairs). At properties with the kitchen capacity to serve dinner, the two-meal product is the principal means of lifting rate. That the prefecture-wide two-meal premium of +52.3% (37 property pairs) exceeds the national median of +39.8% suggests the market accepts this product design across a reasonably broad range.
(3) When rates are flat, the ancillary increment becomes the effective rate lever. Estimated settled ADR is −0.1% year on year at business hotels and −6.3% at city hotels. Even where the room-only rate is hard to move, the meal differential is an area that shifts the effective room rate without consuming inventory.
(4) Match the day-of-week shape to where the ancillary bites. Estimated OCC runs in the 88% range Tuesday to Thursday and in the 77% range on Sunday (business). On high-occupancy days there is little room left to earn through inventory, so the meal differential is where the leverage is. Conversely, on softer days such as Sunday, a meal-inclusive product can be designed as an entry point to capture demand itself.
| Time horizon | Action | Decision trigger (figures from this article) | Objective |
|---|---|---|---|
| Today to this week | Calculate your own breakfast premium rate ((breakfast-included − room-only) ÷ room-only) and set it beside the prefecture level | Whether you fall below business +7.5% / city +10.7% | Capture your position in a single number |
| Today to this week | Take stock of whether a two-meal product exists and how its differential from breakfast-included is set | Where the step up from breakfast-included falls short of +35.4% (business) | Check that the largest step change is not being left on the table |
| Within two weeks | Review the mix of meal-inclusive products on high-occupancy Tuesday-to-Thursday dates | Where estimated OCC holds in the 88% range Tuesday to Thursday yet selling remains room-only led | Look for room to lift the effective rate on days where occupancy is already full |
| Within two weeks | Consider positioning meal-inclusive products as the entry point on softer Sunday and Monday dates | That Sunday estimated OCC is the weekly low at 77.5% (business) and 76.1% (city) | Capture demand itself on trough days |
| Toward next month | Manage room-only rate revisions and meal differential revisions on separate calendars | That estimated settled ADR is tracking at −0.1% (business) and −6.3% (city) year on year | Secure a route to hold the effective rate even where headline rates are hard to move |
| Toward next month | Make the distance to the national median a standing quarterly observation item | Whether the gap to the national median (all +9.3%, business +10.3%, city +14.4%) is narrowing | Put the design of the differential — not one-off pricing — under continuous management |
Source: MetroEngines Research; compiled by the HotelBank Editorial Team
Scenario Estimate — How Far the Effective Rate Moves If the Breakfast Differential Closes to the National Median
Everything to this point has been about position within the market. To close, here is a simplified estimate — using only figures that appear in this article — of how much the effective rate changes if that differential is actually moved. The assumptions are estimated settled ADR of ¥6,501 for Ibaraki business hotels (July 2026 finalized, 187 properties), estimated OCC of 85.6% (July 2026 monthly average), 31 days and a 100-room property. Because breakfast attachment varies widely by property, three levels are set provisionally at 30%, 50% and 70%, with the room-only rate held unchanged. The increase is centered on +2.8 points — the distance from the prefecture level of +7.5% to the national median of +10.3% — with a pessimistic +1.0 point and an optimistic +4.0 points on either side.
| Increase (scenario) | Breakfast attachment 30% | 50% | 70% |
|---|---|---|---|
| Pessimistic +1.0pt | +¥20 approx. ¥52,000/month | +¥33 approx. ¥86,000/month | +¥46 approx. ¥121,000/month |
| Central +2.8pt (to the national median) | +¥55 approx. ¥145,000/month | +¥91 approx. ¥242,000/month | +¥127 approx. ¥338,000/month |
| Optimistic +4.0pt | +¥78 approx. ¥207,000/month | +¥130 approx. ¥345,000/month | +¥182 approx. ¥483,000/month |
Estimated settled ADR ¥6,501 (Ibaraki business hotels, July 2026 finalized) × increase × attachment rate. Monthly conversion assumes 100 rooms, estimated OCC 85.6% (July 2026 monthly average) and 31 days. Food and labor costs of provision are not deducted / Source: MetroEngines Research; compiled by the HotelBank Editorial Team
In the central case (+2.8 points, 50% attachment) the figure is +¥91 per room, or roughly ¥240,000 a month for 100 rooms. Even taking the pessimistic-to-optimistic range, the outcome stays between roughly ¥86,000 and ¥345,000 a month. The amounts are not large, but this is a range that moves without consuming a single additional room night, and unlike a revision to the room-only rate it does not land directly on the battlefield of price comparison with competitors. That said, the estimate is on a revenue basis; what remains after deducting food and labor costs for breakfast will be smaller. Where input costs are rising, a wider differential does not automatically translate into wider profit.
One further point on sensitivity. The weight of one premium point is proportional to the underlying rate level. At business hotels (estimated settled ADR ¥6,501) a point is worth about ¥65 per room, whereas at city hotels (¥8,586) it is about ¥86 — 1.3 times as much. The fact that the city hotel breakfast premium of +10.7% is the lowest among 13 prefectures means that, with a higher underlying rate, the same one point left uncaptured is larger in cash terms.
Summary — Three Yardsticks
For Ibaraki in July 2026, three reusable yardsticks emerge.
First, the breakfast increment is thinner than the national median. All-segment +5.8% (104 property pairs) is 3.5 points below the 45-prefecture median of +9.3%, and business +7.5% and city +10.7% likewise fall below their respective medians (+10.3% and +14.4%). Reducing your own breakfast premium to a single number and holding it against those two reference points — the prefecture level and the national median — is the first yardstick.
Second, the step change is in dinner. Two-meal versus room-only is +52.3% all-segment (37 property pairs), above the national median of +39.8%, and the step from breakfast-included to two-meal is +35.4% at business hotels. In designing meal-ancillary revenue in Ibaraki, how to handle the two-meal tier is the question that comes before making breakfast thicker.
Third, the flatter the rate environment, the more the ancillary differential matters. Estimated settled ADR is −0.1% year on year at business hotels and −6.3% at city hotels. Occupancy averages in the 85% range for the month, with a weekday-led shape of 88% Tuesday to Thursday and 77% on Sunday. Where neither rate nor occupancy is moving much, inspecting the design of the existing differential remains the most accessible lever available.
About the Data — Sources, Assumptions and Limitations
■ Data sources
MetroEngines Research, “Same-Property Pair Meal Premium Aggregation” (July 2026, two guests per room, by prefecture and by segment); the same source’s “Estimated Settled ADR by Area” (Ibaraki, by segment, January 2025 to August 2026); and the same source’s “Occupancy Rate on an OTA-Listed-Inventory Basis” (Ibaraki, July 2026, daily). All were retrieved by the HotelBank Editorial Team on August 4, 2026.
■ Calculation assumptions
・Meal premium rate: the differential ratio aggregated only across properties where both of the two meal conditions being compared are sold within the same property. Two guests per room. Target segments are business, city, resort, deluxe and capsule; ryokan are not included. Cross-prefecture comparison is limited to prefectures with at least 15 valid pairs.
・Estimated settled ADR: the transaction price level (pre-tax equivalent) inferred from OTA and other sales data (lowest-plan level × segment coefficient, ensembled across multiple channels). Past months are finalized values; current and future months are estimates based on current selling conditions. Median error against published operating results is 6.6%.
・Estimated OCC (occupancy rate on an OTA-listed-inventory basis): 100 − 100 × rooms remaining on OTA listings ÷ total rooms. An estimate based on how listed inventory is being taken up on OTAs.
・Effective rate estimate: estimated settled ADR ¥6,501 (Ibaraki business hotels, July 2026 finalized) × premium increase × breakfast attachment rate. Monthly conversion is calculated on 100 rooms, estimated OCC 85.6% (July 2026 monthly average) and 31 days.
・Breakdown of N: for meal premiums (Ibaraki, July 2026), all-segment 104 property pairs, business hotels 81 property pairs, city hotels 15 property pairs; for two-meal versus room-only, all-segment 37 property pairs, business 20 property pairs, city 10 property pairs. The national comparison covers 45 prefectures and 3,900 property pairs in total (all-segment). Estimated settled ADR covers 187 Ibaraki business hotels in July 2026 and 181 in July 2025; 17 city hotels in July 2026 and 18 in July 2025. Properties observed for estimated OCC number 156–163 business hotels and 15–16 city hotels.
■ Limitations and caveats
・Figures with fewer than 15 valid pairs (dinner only ÷ room-only at 14 property pairs, city hotel two-meal at 10 property pairs, and city hotel two-meal ÷ breakfast-included at 9 property pairs) are indicative and are strongly pulled by the pricing of a small number of properties.
・Estimated OCC is on an OTA-listed-inventory basis and is defined differently from actual room occupancy (it reads higher). Day-of-week averages cover only 4–5 days each and cannot fully smooth out the effect of a single public holiday or event.
・Figures for August 2026 are estimates based on selling conditions in a month still in progress and are calculated on a different basis from finalized values. They cannot be compared directly with prior-year finalized figures.
・Meal premiums are handled as ratios only; the level of listed prices in yen is outside the scope of this article.
・The effective rate estimate is on a revenue basis and does not deduct the cost of provision such as food and labor. Where input costs are rising, a wider differential does not necessarily flow through to profit.
・Data as of August 4, 2026. Selling conditions and inventory change daily, so the figures in this article are a snapshot at the time of retrieval.