

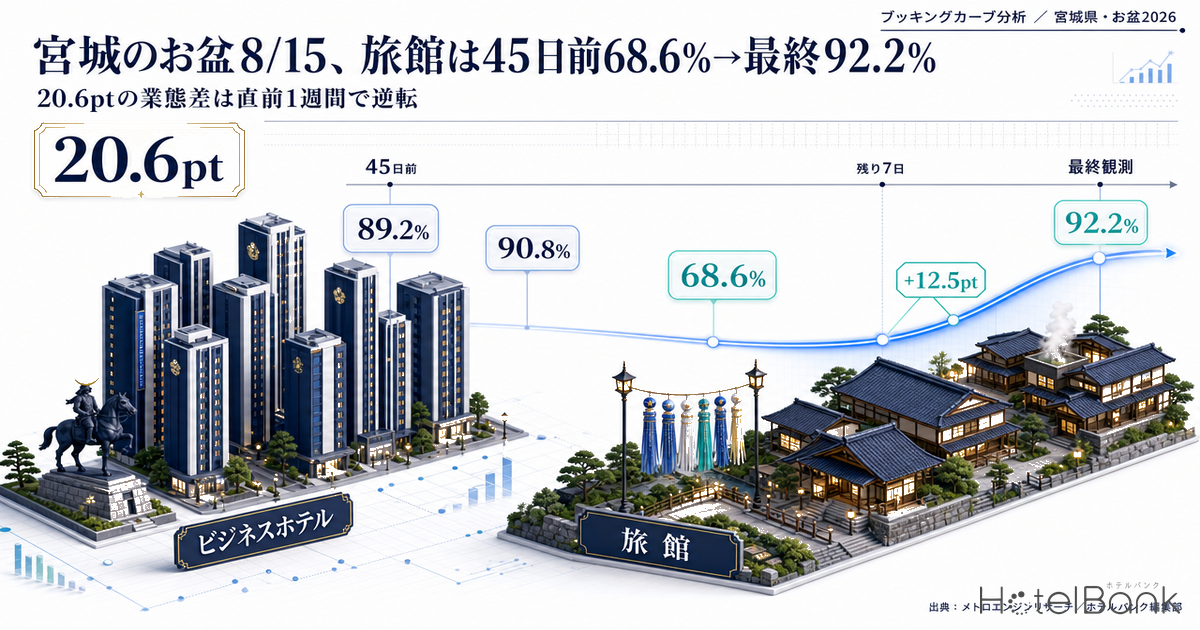
Ryokan in Miyagi Prefecture had filled only 68.6% estimated OCC (as of August 2026; 81 properties observed) for the Obon stay date of Saturday, August 15, 2026, when measured 45 days out. Business hotels for the same stay date stood at 89.2% (114 properties observed) — a gap of 20.6pt. Yet at the final observation (August 14, the day before the stay date), ryokan reached 92.2% (103 properties observed) against business hotels at 90.8% (124 properties observed): the 20.6pt gap did not merely close, it flipped, with ryokan ending 1.4pt ahead. Ryokan were still at just 79.7% with 7 days to go, meaning they added +12.5pt in the final week alone. Anyone who looked only at the 45-days-out snapshot and concluded that “ryokan aren’t selling for Obon” could well have destroyed that late pickup themselves. This article breaks down booking progress across Miyagi’s four Obon nights (Aug 13–16) by property type, using booking curves running from 45 days out to the eve of stay, and then works through how to apply the findings to the remaining August weekends and the September holiday run.
• Scope: 126 business hotels, 105 ryokan, 21 city hotels and 16 resort hotels in Miyagi Prefecture.
• Estimated OCC (occupancy) = the share of sold rooms against total rooms in the area (an estimate based on OTA sales inventory). Calculated as 100 − 100 × OTA-listed remaining rooms ÷ total rooms; it differs in definition from actual room occupancy (it runs high).
• Sellout rate = the share of properties for which no listed inventory can be confirmed on OTAs or elsewhere (estimated). It is not a confirmation of actual full occupancy, and it can fall when inventory is re-listed.
• This article uses no price metrics (estimated settled ADR and the like). The analysis is confined to estimated OCC, sellout rate and booking progress.
• Data as of: August 15, 2026 (latest observation date August 14, 2026). See “About the Data” at the end of the article for full definitions.
• Source: MetroEngines Research (continuous tracking of OTA public rates across approximately 168,000 domestic properties, of which roughly 27,000 have confirmed operations)
- — 20.6pt — At 45 days out, estimated OCC for Saturday, August 15 was 89.2% for business hotels (114 properties observed) against 68.6% for ryokan (81 properties observed). By the final observation that gap had flipped, to ryokan 92.2% and business hotels 90.8%.
- — +12.5pt — Ryokan on Aug 15 went from 79.7% with 7 days to go to 92.2% at the final observation. More than half of the +23.6pt gain measured from 45 days out is concentrated in that final week.
- — Nearly double — Estimated OCC on Aug 14 was 95.3% for business hotels and 96.4% for ryokan, essentially the same level, yet sellout rates were 35.7% and 71.4% respectively. The character of the squeeze only separates when you look property by property.
- — Obon is not necessarily the peak — The actual peak for Miyagi ryokan came right after the Sendai Tanabata Festival, on Aug 8 (97.3%) and Aug 9 (97.8%), above every one of the four Obon nights.
- — The September holiday run builds early — For ryokan, Sep 20 sits at 92.1% estimated OCC with 37 days to go (observed August 14, 2026) and a 63.5% sellout rate (102 properties observed). Unlike Obon, that stay date is decided well inside the 45-day mark.
The 20.6pt gap at 45 days out flipped in the final week
Start with the single date of Saturday, August 15, split across four property types on a booking curve running from 45 days before the stay date to the eve. Even where the end point is the same — “close to sold out” — the route each type takes to get there is completely different.
Source: MetroEngines Research; compiled by the HotelBank Editorial Team
City hotels (21 properties in scope; 18–21 observed) had already reached 95.1% at 45 days out and then ran almost flat to a final observation of 93.3%. Business hotels (126 in scope; 114–126 observed) likewise moved from 89.2% at 45 days out to 90.8% at the end — a gain of just +1.6pt across those 45 days. Both types are of the “already settled 45 days out” variety.
Ryokan (105 in scope; 81–104 observed) are the contrast: from 68.6% at 45 days out they climbed gently to 77.0% with 14 days to go and 79.7% with 7 days to go, then jumped to 92.2% at the final observation. Measured from 45 days out the gain is +23.6pt, more than half of it concentrated in the last 7 days. Resort hotels (16 in scope; 14–16 observed — treat as indicative given the small count) also ran from 79.4% at 45 days out to 92.2% at the end, +12.8pt, a late-pickup shape closer to ryokan. This “only ryokan build late” pattern is not unique to Miyagi; the same ordering shows up in Kyoto Obon 2026 Booking Curves: Ryokan Add the Most Close In, +11.4pt.
Fixed reference points for all types across the four Obon nights are shown below. Note that the 45-days-out snapshot for Sunday, August 16 falls on a day with an extremely thin observed sample (17 business hotels, 1 ryokan, 5 city hotels), so it has been excluded from the table to avoid manufacturing a false trough, and that date is instead anchored at 30 days out. On the same principle, every observation date on which a series had fewer than 60% of that series’ maximum observed property count has been excluded.
| Stay date | Property type | 45 days out | 30 days out | 14 days out | 7 days out | Final obs. | Change | Observed property range |
|---|---|---|---|---|---|---|---|---|
| 08/13 (Thu) | Business hotels 126 in scope | 75.0% (117 properties) | 80.6% (117 properties) | 87.6% (126 properties) | 91.7% (126 properties) | 96.8% (1 day out · 118 properties) | +21.8pt (from 45 days out) | 117–126 |
| Ryokan 105 in scope | 72.8% (81 properties) | 76.6% (84 properties) | 85.0% (104 properties) | 87.6% (103 properties) | 96.1% (1 day out · 101 properties) | +23.3pt (from 45 days out) | 80–104 | |
| City hotels 21 in scope | 89.3% (21 properties) | 92.5% (21 properties) | 95.7% (21 properties) | 96.4% (21 properties) | 98.6% (1 day out · 21 properties) | +9.3pt (from 45 days out) | 18–21 | |
| Resort hotels 16 in scope | 81.1% (15 properties) | 83.5% (15 properties) | 85.8% (16 properties) | 86.0% (16 properties) | 91.2% (1 day out · 14 properties) | +10.1pt (from 45 days out) | 14–16 | |
| 08/14 (Fri) | Business hotels 126 in scope | 77.3% (117 properties) | 81.7% (117 properties) | 87.1% (126 properties) | 89.9% (124 properties) | 95.3% (1 day out · 125 properties) | +18.0pt (from 45 days out) | 117–126 |
| Ryokan 105 in scope | 74.1% (83 properties) | 78.3% (86 properties) | 82.8% (103 properties) | 86.5% (101 properties) | 96.4% (1 day out · 102 properties) | +22.3pt (from 45 days out) | 81–104 | |
| City hotels 21 in scope | 89.1% (21 properties) | 91.3% (21 properties) | 93.6% (21 properties) | 94.1% (18 properties) | 96.0% (1 day out · 21 properties) | +6.9pt (from 45 days out) | 18–21 | |
| Resort hotels 16 in scope | 83.9% (15 properties) | 84.1% (15 properties) | 87.0% (16 properties) | 90.1% (16 properties) | 92.1% (1 day out · 16 properties) | +8.2pt (from 45 days out) | 14–16 | |
| 08/15 (Sat) | Business hotels 126 in scope | 89.2% (114 properties) | 87.5% (115 properties) | 88.6% (126 properties) | 87.6% (126 properties) | 90.8% (1 day out · 124 properties) | +1.6pt (from 45 days out) | 114–126 |
| Ryokan 105 in scope | 68.6% (81 properties) | 70.7% (85 properties) | 77.0% (104 properties) | 79.7% (103 properties) | 92.2% (1 day out · 103 properties) | +23.6pt (from 45 days out) | 81–104 | |
| City hotels 21 in scope | 95.1% (20 properties) | 95.6% (20 properties) | 96.1% (21 properties) | 94.2% (21 properties) | 93.3% (1 day out · 19 properties) | -1.8pt (from 45 days out) | 18–21 | |
| Resort hotels 16 in scope | 79.4% (15 properties) | 80.7% (15 properties) | 86.0% (16 properties) | 88.5% (16 properties) | 92.2% (1 day out · 16 properties) | +12.8pt (from 45 days out) | 14–16 | |
| 08/16 (Sun) | Business hotels 126 in scope | — | 78.2% (117 properties) | 80.5% (126 properties) | 81.6% (126 properties) | 83.7% (2 days out · 124 properties) | +5.5pt (from 30 days out) | 117–126 |
| Ryokan 105 in scope | — | 67.3% (91 properties) | 74.1% (104 properties) | 76.1% (103 properties) | 80.6% (2 days out · 103 properties) | +13.3pt (from 30 days out) | 89–104 | |
| City hotels 21 in scope | — | 88.1% (21 properties) | 89.2% (21 properties) | 89.3% (21 properties) | 90.5% (2 days out · 19 properties) | +2.4pt (from 30 days out) | 18–21 | |
| Resort hotels 16 in scope | — | 80.9% (15 properties) | 85.0% (16 properties) | 88.1% (16 properties) | 86.4% (2 days out · 16 properties) | +5.5pt (from 30 days out) | 14–16 |
Source: MetroEngines Research; compiled by the HotelBank Editorial Team
The regularity here is clear. Business hotels went from 75.0% at 45 days out to 96.8% at the end on Thursday, Aug 13, and from 77.3% to 95.3% on Friday, Aug 14 — gains of +18 to +22pt on the weekday nights ahead of Obon. Only Saturday, Aug 15 started high, at 89.2% from 45 days out, leaving almost no headroom. Ryokan posted late pickup of +13 to +24pt on all four nights, so the “shape” of the type barely depends on the date. In other words, if you hold every property type to the same yardstick of achievement at 45 days out, ryokan will always be undervalued.
The squeeze as read through sellout rate — ryokan at 71.4% on Aug 14
Estimated OCC is a room-count-based metric, so inventory at large properties drags the whole figure down. To see the squeeze at the property level, the share of properties for which no listed inventory can be confirmed on OTAs or elsewhere (below, “sellout rate”, estimated) serves as a useful cross-check. Sellout rates at the final observation across the four Obon nights are set out by property type below.
Source: MetroEngines Research; compiled by the HotelBank Editorial Team
Ryokan hit 71.4% on Friday, Aug 14 (102 properties observed) and 64.8% on Thursday, Aug 13 (101 properties observed) — meaning roughly two-thirds of the 105 properties in scope had no confirmable listed inventory. Business hotels on the same dates were at 35.7% (125 properties observed) and 38.1% (118 properties observed), close to a twofold gap. On estimated OCC the two are nearly identical on Aug 14 (business hotels 95.3%, ryokan 96.4%), yet at the property level the character of the squeeze is entirely different.
Sellout rate also does not necessarily rise monotonically. City hotels on Aug 15 fell from 47.6% at 45 days out (20 properties observed) to 19.0% at the final observation (19 properties observed). That is not demand disappearing; it is consistent with inventory that had been held back being re-listed as the date approached. Not reading a fall in sellout rate as a fall in demand matters a great deal in close-in decisions.
Widen the view to the whole of August and it becomes clear that the actual peak for Miyagi ryokan was not Obon. On a day-by-day basis for dates already past, Saturday, Aug 8 recorded 97.3% estimated OCC (August 2026, Miyagi area aggregate) with a 79.0% sellout rate, and Sunday, Aug 9 recorded 97.8% and 80.0% (both across the 105 properties in scope) — above Obon’s Aug 13 (96.1%, 64.8%), Aug 14 (96.4%, 71.4%) and Aug 15 (92.2%, 59.0%). The Sendai Tanabata Festival ran August 6–8 in 2026 as well, so the weekend immediately after it formed one of the strongest peaks of the year for ryokan in the prefecture. Business hotels show the same pattern, at 97.4% on Aug 8 and 98.1% on Aug 9 — higher than any of the four Obon nights.
Was Obon really special demand for ryokan? A comparison with ordinary Saturdays
So for ryokan, what actually set Obon’s Aug 15 apart from an ordinary Saturday? Within the same ryokan category, the three Saturdays of Aug 15, Aug 22 and Aug 29 are overlaid on the same days-to-arrival axis.
Source: MetroEngines Research; compiled by the HotelBank Editorial Team
At 45 days out the snapshots read 68.6% for Aug 15 (81 properties observed), 69.8% for Aug 22 (93 properties observed) and 73.4% for Aug 29 (87 properties observed): the Obon Saturday and the ordinary Saturdays are all but indistinguishable. Even with 8 days to go they sit at much the same level, 80.0% for Aug 15 (101 properties observed) and 80.4% for Aug 22 (103 properties observed). The two only separated after that, with Aug 15 climbing +12.2pt from there to a final observation of 92.2%. How Aug 22 moves in its final week is still awaiting observation.
In short, for ryokan in Miyagi, Obon demand is invisible at 45 days out and still invisible at 8 days out; it only shows up in the last week. Put the other way round: squeeze inventory too hard close in, or leave consecutive-night conditions in place, and those 12 points are forfeited outright. That said, late pickup does not always materialise — there are prefectures where the second-half climb for ryokan stays thin (see Yamanashi Obon: Ryokan Gain Only +1.1pt, Business Hotels +7.9pt).
Extend the view forward and the picture for ryokan is in fact brighter over September’s five-day holiday run (Sep 19–23). Current snapshots are set out below.
| Stay date | Days out | Business hotels (126 in scope) | Ryokan (105 in scope) | City hotels (21 in scope) |
|---|---|---|---|---|
| 08/22 (Sat) | 8 days | 96.7% / 51.6% (124 properties) | 80.4% / 20.0% (103 properties) | 98.7% / 61.9% (19 properties) |
| 08/29 (Sat) | 15 days | 95.2% / 42.4% (123 properties) | 78.4% / 18.3% (103 properties) | 98.3% / 57.1% (19 properties) |
| 09/19 (Sat) | 36 days | 96.6% / 65.0% (120 properties) | 82.0% / 42.3% (102 properties) | 98.9% / 85.7% (19 properties) |
| 09/20 (Sun) | 37 days | 91.4% / 54.4% (122 properties) | 92.1% / 63.5% (102 properties) | 99.2% / 81.0% (19 properties) |
| 09/21 (Mon, Respect for the Aged Day) | 38 days | 81.6% / 22.2% (123 properties) | 87.9% / 54.8% (102 properties) | 96.1% / 47.6% (19 properties) |
| 09/22 (Tue, Citizens’ Holiday) | 39 days | 70.2% / 7.9% (123 properties) | 69.3% / 23.1% (102 properties) | 88.0% / 28.6% (19 properties) |
Source: MetroEngines Research; compiled by the HotelBank Editorial Team
For ryokan, Sunday, Sep 20 stands at 92.1% estimated OCC with 37 days to go (observed August 14, 2026) and a 63.5% sellout rate (102 properties observed), while Monday, Sep 21 (Respect for the Aged Day) is at 87.9% and 54.8% (102 properties observed). Set against the 68.6% recorded 45 days out from Obon’s Aug 15, the middle and second days of the holiday run are building far earlier than Obon did. Business hotels, by contrast, fall away towards the back of the run — 81.6% on Sep 21 and 70.2% on Tuesday, Sep 22 (Citizens’ Holiday) — and Sep 22 is the deepest trough across all types, with ryokan at 69.3% and business hotels at 70.2%. Note that every September stay date here is a snapshot more than 30 days ahead, so the figures will move with future inventory additions and pricing adjustments. They should be read as the current state of play. For how the September five-day run is building nationally, Silver Week 2026 Back Half at T-47: Sep 23 Matches a Normal Wednesday covers the picture through to the trough at the back of the run.
For revenue managers running business hotels and ryokan in Miyagi — implications and an action plan
(1) Do not hold every property type to the same yardstick of achievement at 45 days out. At 45 days out, Aug 15 showed business hotels at 89.2% and ryokan at 68.6%, a 20.6pt spread — yet the final observations were 90.8% and 92.2%, a reversal. If your property is a ryokan or Japanese-style inn, sitting below the market curve at 45 days out is not in itself an outlier. What to judge is not the level but whether the slope of your own curve matches that of the market curve for your type.
(2) For ryokan, the decisive window runs from 7 days out to the eve. Ryokan on Aug 15 were at 79.7% with 7 days to go and 92.2% at the final observation. Whether you capture that +12.5pt determines the outcome. Business hotels on Aug 15, by contrast, moved only +1.6pt from 45 days out to the end, leaving little room for close-in measures to bite. Even with identical close-in operations, the effort worth allocating differs by property type.
(3) Read sellout rate and estimated OCC separately. On Aug 14 estimated OCC was near-identical at 95.3% for business hotels and 96.4% for ryokan, yet sellout rates were 35.7% and 71.4% — close to a twofold gap. Whether competitors are genuinely “unbookable” shows up on the sellout-rate side. And because you also get moves like city hotels on Aug 15 falling from 47.6% to 19.0%, treat a decline as possible re-release of inventory rather than reading it as weakening demand.
(4) August’s peak is not necessarily Obon. Actual results for ryokan in the prefecture were 97.3% on Aug 8 and 97.8% on Aug 9, above every one of the four Obon nights. If your annual rate-revision calendar and staffing plans are built on the assumption that Obon is the busiest period, there is room to reconsider where the weekend immediately after the festival sits.
| Horizon | Action | Decision trigger | Objective |
|---|---|---|---|
| Today–this week (through 8/22) | Decide whether to lift minimum-length-of-stay (consecutive-night) conditions, using 7 days out as the marker | When your own progress for 8/22 is short of the market ryokan level of 80.4% (8 days out, 103 properties observed) | Avoid closing off, through conditions, the kind of +12.2pt final-week headroom seen on 8/15 |
| Review your OTA-side presentation (photos, plan descriptions, how availability displays) for the close-in window | When your own sellout-equivalent status fails to fill even in a squeeze comparable to the market ryokan 71.4% on 8/14 | Secure visibility in close-in searches and provide a landing place for late demand | |
| Within two weeks (through 8/29) | Treat Saturday 8/29 as the same shape as 8/22 and re-assess the inventory stance on reaching 7 days out | When you diverge from the 8/29 market level (ryokan 78.4%, business hotels 95.2%, 15 days out) | Build the habit of switching close-in operations between ordinary and peak Saturdays |
| Design extended-stay and multi-night messaging to push demand from peak nights to the days either side | When you hold next-day availability equivalent to the market’s 8/16 (ryokan 80.6%, business hotels 83.7%) | Spread peak-night demand into the shoulder days and level occupancy across the period | |
| Looking to next month (9/19–9/23) | Lock in the inventory design for Sunday 9/20 and Monday 9/21 early, as the main battleground for ryokan | When your own progress for 9/20 lags well behind the market ryokan level of 92.1% (37 days out, 102 properties observed) | Recover the shortfall inside the 45-day mark, on a holiday run that — unlike Obon — builds early |
| Carve Tuesday 9/22 (Citizens’ Holiday) out as the trough within the run and give it its own sales design | When the 9/22 market level (ryokan 69.3%, business hotels 70.2%) stays around 20pt below the other days in the run | Avoid treating the holiday run as a single block, and create room to fill the trough day with different exposure and conditions |
* The table above organises decision inputs that can be read from market data; it does not guarantee results. Every September stay date is a snapshot more than 30 days ahead and will move with future sales conditions.
Conclusion — three yardsticks to take away from Miyagi’s Obon
First, the level at 45 days out means different things for different property types. Aug 15 showed a 20.6pt spread between business hotels at 89.2% and ryokan at 68.6%, yet the final observations of 90.8% and 92.2% reversed it. Watch the slope of the curve, not its height.
Second, the final week for ryokan cannot be written off. Ryokan on Aug 15 went from 79.7% with 7 days to go to 92.2% at the end, +12.5pt. The ordinary Saturday of Aug 22 sits in much the same place at 8 days out, 80.4%. The difference emerges after that point.
Third, update your definition of peak using actuals. Early-August results for Miyagi ryokan were 97.3% on Aug 8 and 97.8% on Aug 9, above the four Obon nights (96.1%, 96.4%, 92.2%, 80.6%). The busy period on the calendar and the busy dates in the data do not always coincide.
About the Data
- Definition of estimated OCC (OTA-listed-inventory basis): OTA-listed-inventory-based occupancy = 100 − 100 × OTA-listed remaining rooms ÷ total rooms. It is an estimate based on how listed OTA inventory is being taken up, and differs in definition from actual room occupancy (it runs high).
- Booking curve: based on observations from 45 days before the stay date through to the most recent date.
- Sellout rate is “the share of properties for which no listed inventory can be confirmed on OTAs or elsewhere (estimated)” and is not a confirmation of actual full occupancy. It can fall when inventory is re-listed.
- For each series, observation dates on which the observed property count fell below 60% of that series’ maximum were excluded, to avoid false troughs and false gains caused by a changing observed sample. The 45-days-out snapshot for August 16, 2026 (17 business hotels, 1 ryokan, 5 city hotels) was excluded on this basis, and that date is anchored at 30 days out instead.
- This article uses no price metrics (estimated settled ADR and the like). The analysis is confined to estimated OCC, sellout rate and booking progress.
- Scope breakdown: 126 business hotels in Miyagi Prefecture (17,261 rooms in total; 114–126 observed), 105 ryokan (3,546 rooms; 80–104 observed), 21 city hotels (2,963 rooms; 18–21 observed) and 16 resort hotels (1,702 rooms; 14–16 observed). Resort hotels are treated as indicative given the small property count.
- Data as of: August 15, 2026 (latest observation date August 14, 2026). Sales conditions and inventory move daily, so the figures in this article are a snapshot at the time of retrieval.
References and Sources
- Sendai Tanabata Festival official site (2026 dates)
- Cabinet Office, “National Holidays” (September 21, 2026 Respect for the Aged Day / September 22 Citizens’ Holiday / September 23 Autumnal Equinox Day)
- JRE Media, “[2026] Sendai Tanabata Festival: dates and access”
■ Data source
OTA public rates and listed inventory across approximately 168,000 domestic properties continuously tracked by MetroEngines Research (of which roughly 27,000 have confirmed operations). This article covers 126 business hotels, 105 ryokan, 21 city hotels and 16 resort hotels in Miyagi Prefecture, with data as of August 15, 2026 (latest observation date August 14, 2026).
■ Calculation assumptions
Estimated OCC = 100 − 100 × OTA-listed remaining rooms ÷ total rooms. Booking curves are based on observations from 45 days before the stay date through to the most recent date. Sellout rate is “the share of properties for which no listed inventory can be confirmed on OTAs or elsewhere (estimated)”. For each series, observation dates on which the observed property count fell below 60% of that series’ maximum were excluded, to avoid false troughs and false gains caused by a changing sample (this applies to the 45-days-out snapshot for August 16, 2026, and that date is anchored at 30 days out instead).
■ Limitations and caveats
Estimated OCC is an estimate on an OTA-public-inventory basis and differs in definition from actual room occupancy (it runs high). Sellout rate is not a confirmation of actual full occupancy and can fall when inventory is re-listed. The 16 resort hotels are indicative only, given the small base. Every September 2026 stay date is a snapshot more than 30 days ahead and will move with future inventory additions and pricing adjustments. This article does not treat price metrics (estimated settled ADR and the like), and what is written here organises decision inputs rather than guaranteeing results.
Related Reading
- Kyoto Obon 2026 Booking Curves: Ryokan Add the Most Close In, +11.4pt
- Yamanashi Obon: Ryokan Gain Only +1.1pt, Business Hotels +7.9pt
- Iwate Obon 2026: Aug 13 Peaks 92.5%, Aug 15 Dips to 78.9% Both Types
- Silver Week 2026 Back Half at T-47: Sep 23 Matches a Normal Wednesday
- Hyogo Booking Curves: 3.6x Pickup Gap, Ryokan Sellout Rate 28.4%
- Nagano Late-Summer Booking Curve 2026: Ryokan -11.8pt at 45 Days Out
- Hiroshima Booking Curves: 26.2pt Gap at T-45, Ryokan +10.9pt Late