

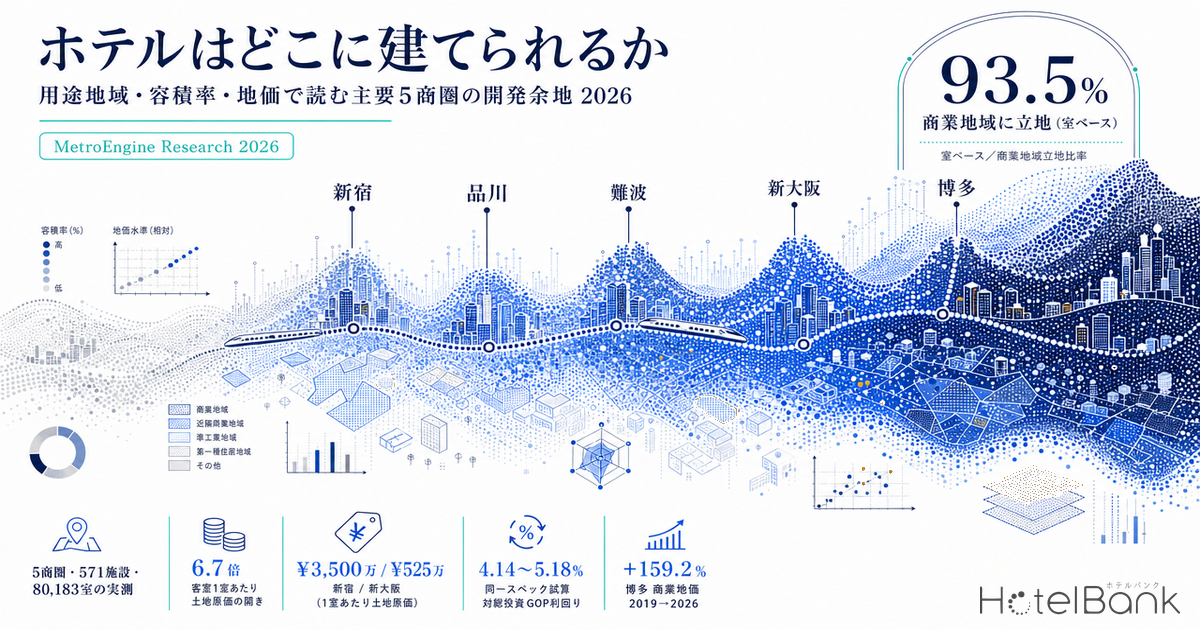
Whether a hotel can be developed is decided first on the land side. However strong the demand and however high the achievable ADR, the site’s zoning district and designated floor area ratio (FAR) already set the ceiling on gross floor area — and therefore on room count — before anything else. This article places the urban-planning side (zoning districts, FAR, building coverage ratio) at the center of the analysis and quantifies development capacity across five trade areas within a 1 km radius of major stations: Tokyo (Shinjuku, Shinagawa), Osaka (Namba, Shin-Osaka) and Fukuoka (Hakata), putting regulatory headroom, existing stock location, land prices and market ADR on a single comparable footing.
Metric Definitions Used in This Article
- ADR (average daily rate) = an estimated transacted rate (tax-exclusive equivalent) derived by taking the in-month average of each property’s daily lowest publicly listed plan price on OTAs (regardless of occupancy or meal conditions, tax-inclusive) and applying a segment-specific correction coefficient. Cross-checked against Invincible Investment Corporation’s property-level disclosed ADR (N=184 property-months, April–May 2026), the median error is 7.5% (6.0% for business and city hotels). These are estimates and differ from each property’s actual transacted rates and accounting figures. Trade-area ADR is the median of the properties covered (the level of a typical property in that trade area). ADR figures in this article are as of July 2026.
- Designated FAR / building coverage ratio = the upper limits set by the city plan. Actual buildable scale is further constrained by FAR limits tied to frontage road width, height districts, shadow regulations, district plans and local ordinances. The figures here are regulatory ceilings, not the achievable scale on any individual site.
- Published land price = MLIT’s Official Land Price Survey (Chika Kouji). The 2026 (Reiwa 8) survey has a valuation date of 1 January 2026 and was published in March of the same year. Year-on-year change refers to the change from the prior year (1 January 2025). This article extracts only standard sites classified as “commercial land within a Commercial Zone” inside each trade area’s 1 km radius and uses their median.
- Room stock density = existing rooms per hectare of land in the relevant zoning district (an original calculation for this article).
- Data sources: MetroEngines Research & Consulting / MLIT Real Estate Information Library
- — 93.5% on a room basis sits in Commercial Zones. Across 571 properties and 80,183 rooms in five trade areas, there is a wide gap between regulatory headroom and the headroom actually being used.
- — Land cost per room varies by a factor of 6.7 (Shinjuku ¥35.00M vs Shin-Osaka ¥5.25M) — far wider than the 1.7x ADR spread. Development capacity is set by regulation and land price, not by demand.
- — Same-spec scenario yields converge into a narrow 4.14–5.18% band. Shin-Osaka, the lowest-ADR market, tops the table at 5.18%: the market has already priced ADR differentials into land.
- — Shinagawa is only 24.7% Commercial Zone, with 57.1% of its large-scale stock sitting in Category II Residential Zones. Replicating comparable assets is regulatorily difficult, giving existing assets structurally high scarcity value.
- — Supply growth splits three ways (2015 = 100: Namba 267.0, Shin-Osaka 188.4, Hakata 166.5, Shinjuku 126.5, Shinagawa 99.7), sorting into three types — headroom, density and scarcity.
The Structure of Five Trade Areas — How Big the Regulatory Vessel Is, and How Much Is Already In It
Start with the conclusion. Of the 571 properties and 80,183 rooms currently offering inventory on OTAs across the five trade areas, 93.5% on a room basis sit in Commercial Zones. Hotels are legally permitted in six zoning districts — Category I Residential (up to 3,000 m²), Category II Residential, Quasi-Residential, Neighborhood Commercial, Commercial and Quasi-Industrial — yet actual stock in major station trade areas is overwhelmingly concentrated in Commercial Zones. In other words, there is a wide gap between “regulatory headroom” and “headroom actually used,” and the size of that gap differs sharply by trade area.
And there is a second point. Combining FAR with land price to back into land acquisition cost per room, Shinjuku reaches roughly ¥35.00M per room and Shinagawa roughly ¥44.80M, while Shin-Osaka stops at about ¥5.25M. Dividing that land cost by each trade area’s ADR gives “land-cost coverage days”: 1,986 days in Shinjuku against 505 days in Shin-Osaka — a 3.9x spread. The land-cost gap (6.7x) is far larger than the ADR gap (Shinjuku ¥17,600 vs Shin-Osaka ¥10,400, or 1.7x). Development capacity is determined on the regulatory and land-price side, not the demand side.
Regulatory Headroom — Hotels Are Permitted in Six Zoning Districts
The City Planning Act defines 13 zoning districts, but under Appended Table 2 of the Building Standards Act hotels and ryokan may be built in only six of them. Category I Residential Zones carry a 3,000 m² gross floor area cap, and construction is prohibited in Category I and II Low-Rise Exclusive Residential Zones, Category I and II Mid/High-Rise Exclusive Residential Zones, Agricultural Residential Zones, Industrial Zones and Exclusive Industrial Zones. Zoning is only the starting point, however: district plans, height districts, shadow regulations, landscape ordinances and municipality-specific guidance rules for accommodation facilities layer on top, so “it is a Commercial Zone, therefore it can be built” does not hold. What is measured here is strictly regulatory headroom.
| Zoning district | Hotel / ryokan | Typical designated FAR band | Positioning in the five trade areas |
|---|---|---|---|
| Commercial Zone | Permitted | 400–1,000% | Holds 93.5% of room stock across the five areas |
| Neighborhood Commercial Zone | Permitted | 200–400% | 0.2–3.6% of land area; mostly small properties |
| Quasi-Industrial Zone | Permitted | 200–400% | Large in area (Shinagawa 25.2%, Hakata 9.5%) but few rooms |
| Quasi-Residential Zone | Permitted | 200–400% | Only 0.1%, in Shin-Osaka |
| Category II Residential Zone | Permitted | 200–400% | The exception district where Shinagawa’s large hotels cluster |
| Category I Residential Zone | Permitted up to 3,000 m² only | 200–400% | Large in area: Shin-Osaka 21.2%, Shinagawa 12.8% |
| Category I & II Mid/High-Rise Exclusive Residential Zones | Not permitted | — | Shinjuku 14.3%, Shinagawa 16.6% |
| Category I & II Low-Rise Exclusive Residential Zones | Not permitted | — | Shinagawa 6.0% |
| Industrial / Exclusive Industrial Zones | Not permitted | — | None in the five trade areas |
Breaking each trade area’s land area down by zoning district produces very different compositions. Namba is 94.3% Commercial Zone within its 1 km radius, Shinjuku 76.1% and Hakata 79.3%. Shinagawa, by contrast, is only 24.7% Commercial Zone, with Quasi-Industrial at 25.2%, Category I Mid/High-Rise Exclusive Residential at 16.6%, Category I Residential at 12.8% and Category I Low-Rise Exclusive Residential at 6.0% — a mosaic of residential districts. Shin-Osaka likewise pairs 60.4% Commercial Zone with Category I Residential at 21.2% and Category II Mid/High-Rise Exclusive Residential at 10.7%, switching to residential districts with distance from the station.
What this compositional difference means is that the sheer volume of land that can even be considered for hotel use varies greatly by trade area. In Namba nearly the entire radius sits in districts where hotels are permitted; in Shinagawa, exclusive residential districts (where hotels are prohibited) account for 22.6%, and most of the remaining land is quasi-industrial or residential. The same “1 km from the station” yields a completely different shape of vessel.
Where Existing Stock Sits — Concentration in Commercial Zones, and the Shinagawa Exception
Next, overlaying the locations of properties currently offering OTA inventory onto the zoning polygons, we calculated room stock density (rooms per hectare of land) by zoning district. The sample is 571 properties and 80,183 rooms across the five trade areas.
| Trade area | Properties | Rooms | Commercial Zone area | Rooms in Commercial Zone | Commercial Zone room density | Rooms outside Commercial Zone |
|---|---|---|---|---|---|---|
| Shinjuku Station | 101 | 17,983 | 238.9 ha | 17,796 rooms | 74.5 rooms/ha | 187 rooms |
| Shinagawa Station | 20 | 7,721 | 77.4 ha | 3,239 rooms | 41.8 rooms/ha | 4,482 rooms |
| Namba Station | 229 | 26,216 | 296.3 ha | 26,216 rooms | 88.5 rooms/ha | 0 rooms |
| Shin-Osaka Station | 42 | 8,496 | 189.6 ha | 8,206 rooms | 43.3 rooms/ha | 290 rooms |
| Hakata Station | 179 | 19,767 | 249.1 ha | 19,529 rooms | 78.4 rooms/ha | 238 rooms |
Namba at 88.5 rooms/ha, Hakata at 78.4 and Shinjuku at 74.5 line up as the high-density markets. Namba stacks 26,216 rooms onto 296.3 ha of Commercial Zone — the densest accumulation of rooms among the five. Shin-Osaka at 43.3 rooms/ha and Shinagawa at 41.8 sit at roughly half that density even within their Commercial Zones.
Shinagawa contains a notable exception. Of the trade area’s 7,721 rooms, 4,411 (57.1%) sit in a Category II Residential Zone, where room density reaches 173.0 rooms/ha — higher than any Commercial Zone among the five areas. Category II Residential Zones typically carry designated FAR of 200–400%, well below Commercial Zones, so the regulatory room to develop comparable large-scale hotels anew is limited. Shinagawa’s large-scale stock therefore has structurally high scarcity value as an existing asset — advantaged precisely because the same location at the same scale is hard to reproduce under current regulation.
Published Land Prices — Valuation Date 1 January 2026; Hakata Up 159% vs 2019
We extracted standard sites classified as “commercial land within a Commercial Zone” inside each trade area’s 1 km radius and tracked the median published price from 2019 to 2026. The Official Land Price Survey is conducted once a year with a valuation date of 1 January and published in March, so the latest figure used here — the 2026 (Reiwa 8) survey — has a valuation date of 1 January 2026. Year-on-year change refers to the change from 1 January 2025.
| Trade area | Standard sites | 2019 | 2026 | 2019→2026 | YoY median | YoY range |
|---|---|---|---|---|---|---|
| Shinjuku Station | 20 | ¥5,795,000 | ¥8,000,000 | +38.1% | +11.2% | +4.7 to +17.5% |
| Shinagawa Station | 4 | ¥4,810,000 | ¥7,680,000 | +59.7% | +17.7% | +4.1 to +18.3% |
| Namba Station | 18 | ¥1,820,000 | ¥3,210,000 | +76.4% | +15.8% | +6.4 to +25.0% |
| Shin-Osaka Station | 5 | ¥604,000 | ¥900,000 | +49.0% | +15.4% | +7.0 to +15.7% |
| Hakata Station | 10 | ¥1,122,500 | ¥2,910,000 | +159.2% | +9.2% | +1.0 to +11.7% |
Hakata rose the most, from ¥1.12M/m² in 2019 to ¥2.91M/m² in 2026, or +159.2%. Namba follows at +76.4%, Shinagawa at +59.7% (on a small base of just four standard sites), Shin-Osaka at +49.0% and Shinjuku at +38.1%. On a year-on-year basis Shinagawa is strongest at a median +17.7%, followed by Namba +15.8%, Shin-Osaka +15.4%, Shinjuku +11.2% and Hakata +9.2%. Hakata shows the largest cumulative gain but the most subdued growth over the past year.
The gap in absolute levels is extreme. Against Shinjuku’s median of ¥8.0M/m² for commercial land, Shin-Osaka stands at ¥0.9M/m² — an 8.9x difference. Even within Osaka, Namba at ¥3.21M/m² and Shin-Osaka at ¥0.9M/m² differ by 3.6x. This gap becomes the central variable in the development economics discussed below. The structural competition hotels face against other land uses at the acquisition stage is covered in Hotel vs Condo Land Rivalry: ADR-Implied Feasible Land Price. A complementary approach — working backwards from land price levels to the ceiling at which development still pencils out — has been tested across nine areas in our earlier analysis of 2026 published land prices and hotel development feasibility.
Development Efficiency Through FAR × Land Price — Land Cost per m² of Gross Floor Area
Absolute land price alone cannot measure development capacity. At the same land price, double the designated FAR means double the gross floor area buildable from one square metre of land, and therefore half the land cost per square metre of GFA. For each trade area’s commercial standard sites we therefore divided the median published land price by the median designated FAR to obtain land cost per m² of GFA. Setting the GFA intensity of a limited-service hotel at 35 m² per room (including common areas), we then converted this into land acquisition cost per room.
| Trade area | Median land price | Median designated FAR | FAR range | Land cost per m² of GFA | Land cost per room | Median ADR | Land-cost coverage days |
|---|---|---|---|---|---|---|---|
| Shin-Osaka Station | ¥900,000 | 600% | 400–800% | ¥150,000 | ¥5.25M | ¥10,393 | 505 days |
| Namba Station | ¥3,210,000 | 600% | 400–1000% | ¥535,000 | ¥18.72M | ¥14,086 | 1,329 days |
| Hakata Station | ¥2,910,000 | 500% | 400–800% | ¥582,000 | ¥20.37M | ¥14,307 | 1,424 days |
| Shinagawa Station | ¥7,680,000 | 600% | 500–700% | ¥1,280,000 | ¥44.80M | ¥23,941 | 1,871 days |
| Shinjuku Station | ¥8,000,000 | 800% | 500–1000% | ¥1,000,000 | ¥35.00M | ¥17,625 | 1,986 days |
“Land-cost coverage days” is a rough indicator dividing the land acquisition cost for one room by one night of that trade area’s ADR (it excludes construction cost, operating cost and occupancy, so it is not a payback period). Shin-Osaka stands out at just 505 days, followed by Namba at 1,329, Hakata at 1,424, Shinagawa at 1,871 and Shinjuku at 1,986.
The reason Shin-Osaka stands apart is straightforward. Its median designated FAR of 600% matches Namba and Shinagawa, yet its land price of ¥0.9M/m² is one-third of Namba’s and one-ninth of Shinjuku’s. On top of that, its ADR of ¥10,400 (N=39 properties) is only 26–27% below Namba’s ¥14,100 and Hakata’s ¥14,300. High FAR, relatively low land price, and ADR that does not fall as far — that is the structure lifting Shin-Osaka’s development efficiency. As a junction of Shinkansen, conventional rail and subway lines it captures business demand steadily, while the land just outside the station-front commercial belt switches to residential districts, keeping land prices from spiking the way they do in entertainment-district markets.
Shinjuku shows the inverse. It has the largest vessel of the five at a designated FAR of 800%, but land at ¥8.0M/m² outpaces that advantage, leaving land cost per m² of GFA at ¥1.0M — among the highest. That is the flip side of a high barrier to new development, and it works in favour of existing assets already holding rooms at 74.5 rooms/ha inside the Commercial Zone, because new supply is unlikely to grow.
On the Map — Shinagawa’s Zoning Mosaic and Shin-Osaka’s Broad Commercial Zone
Overlaying zoning polygons with existing hotel locations makes the difference in each trade area’s character visible. Circle size indicates room count; colour indicates the zoning district in which the property sits.
In Shinagawa the area east of the station (Konan exit) and part of the west side are Commercial Zone, but the southwest is Quasi-Industrial and the Takanawadai area to the west is Mid/High-Rise Exclusive Residential. The largest properties by room count cluster in the Category II Residential Zone west of the station, and land in districts that would permit new properties of the same scale is limited within the radius. Shin-Osaka, by contrast, has a broad, contiguous Commercial Zone covering 60.4% of the radius, with 41 existing properties and 8,206 rooms dispersed within it. At 43.3 rooms/ha — less than half Namba’s density — the regulatory vessel still has headroom.
Development Scenario — Placing an Identical Limited-Service Hotel in Each of the Five Trade Areas
To see how differences in regulatory vessel and land cost feed through to returns, we ran a rough calculation placing an identical plan — an 800 m² site, full take-up of each trade area’s median designated FAR, and 35 m² of GFA per room for a limited-service hotel — in each of the five trade areas. Construction cost is set at ¥2.026M per tsubo for RC structures in 2025 based on MLIT’s Construction Starts Statistics Survey; occupancy is 83% (a full-year modelling assumption referencing the 82.7% actual disclosed by a listed hotel REIT for June 2026); non-room revenue is set at 10% of room revenue; and the GOP margin at 40%. The occupancy assumption references the 82.7% actual reported by Invincible Investment Corporation across 101 domestic hotels in June 2026.
| Trade area | Designated FAR | GFA | Rooms | Land | Construction | Total investment | Land share | Annual revenue | GOP | Yield on total investment |
|---|---|---|---|---|---|---|---|---|---|---|
| Shin-Osaka Station | 600% | 4,800 m² | 137 | ¥0.72bn | ¥2.94bn | ¥3.66bn | 20% | ¥0.47bn | ¥0.19bn | 5.18% |
| Shinagawa Station | 600% | 4,800 m² | 137 | ¥6.14bn | ¥2.94bn | ¥9.09bn | 68% | ¥1.09bn | ¥0.44bn | 4.81% |
| Namba Station | 600% | 4,800 m² | 137 | ¥2.57bn | ¥2.94bn | ¥5.51bn | 47% | ¥0.64bn | ¥0.26bn | 4.67% |
| Hakata Station | 500% | 4,000 m² | 114 | ¥2.33bn | ¥2.45bn | ¥4.78bn | 49% | ¥0.54bn | ¥0.22bn | 4.55% |
| Shinjuku Station | 800% | 6,400 m² | 182 | ¥6.40bn | ¥3.92bn | ¥10.32bn | 62% | ¥1.07bn | ¥0.43bn | 4.14% |
The results fall into a 4.14%–5.18% band, a spread of roughly one percentage point. Shinagawa, with the highest ADR (¥23,900), returns 4.81%, while Shin-Osaka, with the lowest ADR (¥10,400), tops the table at 5.18% — a seemingly inverted outcome. The market has already priced ADR differentials into land, and most of the remaining difference comes from the combination of FAR and land price level.
The land share of total investment deserves particular attention. Shin-Osaka stops at 19.7%, against Shinagawa 67.6%, Shinjuku 62.0%, Hakata 48.7% and Namba 46.6%. Trade areas with a low land share are more exposed to construction cost inflation, while those with a high land share are more exposed to land price movements. The fact that the primary source of risk differs by trade area is meaningful from a portfolio diversification standpoint.
Sensitivity analysis (Shin-Osaka case, occupancy fixed at 83% — a full-year modelling assumption referencing the 82.7% actual disclosed by a listed hotel REIT for June 2026) — we tested GOP yield on total investment across two axes: ADR and construction cost per tsubo.
| ADR \ construction cost per tsubo | ¥1.80M | ¥2.026M (base) | ¥2.30M |
|---|---|---|---|
| ¥9,000 | 4.93% | 4.49% | 4.05% |
| ¥10,400 (base) | 5.70% | 5.19% | 4.68% |
| ¥12,000 | 6.57% | 5.98% | 5.40% |
Even if construction cost rises to ¥2.30M per tsubo, the yield holds at 4.68% provided ADR stays at base; and if ADR grows to ¥12,000, the yield reaches 5.40% even at ¥2.30M per tsubo. The low land share means ADR growth translates directly into yield. The corollary is high sensitivity to construction cost inflation, which makes the timing of construction start a decisive factor in returns.
Note: This calculation is a simplified model assuming that designated FAR can be fully taken up. In practice, FAR limits tied to frontage road width, height districts, shadow regulations, setback (diagonal-line) restrictions, district plans and municipal guidance rules for accommodation facilities normally push achievable gross floor area below the regulatory ceiling. Individual investment decisions require a detailed feasibility study.
Supply Pipeline — Namba Up 2.7x in a Decade, Shinagawa Essentially Flat
Indexing room counts on a registered-accommodation basis to 2015 = 100 gives Namba 267.0, Shin-Osaka 188.4, Hakata 166.5, Shinjuku 126.5 and Shinagawa 99.7 — supply growth diverges sharply. Namba’s room count multiplied 2.7x between 2015 and 2026, while Shinagawa has been essentially flat. That is consistent with the structure described above: Shinagawa’s Commercial Zone is limited to 24.7% of the radius and its large-scale stock is concentrated in a Category II Residential Zone.
Note: This index is compiled on a registered-accommodation basis and therefore draws on a different population from the trade-area stock tally in this article (571 properties currently offering OTA sales inventory). Because it relies on property opening-year information, the most recent years may shift as further information is reflected.
For the forward pipeline, we reviewed building-confirmation-application data from MLIT’s Building Dynamics Statistics Survey. Of 78 nationwide entries registered as of the survey date, only one falls within the five trade areas covered here — a 200-room hotel inside a mixed-use complex in Takanawa, Minato City — and it has already opened. Because confirmation applications are normally filed one to two years before opening, however, this count is only a floor for the confirmed pipeline at this point in time. Counts and room numbers are expected to rise as further applications are filed, and this should not be read as “no new supply in the five trade areas.”
Conclusion — Regulatory Headroom Splits Into Three Types
Headroom in the vessel
60.4% Commercial Zone and a designated FAR of 600% against room density of just 43.3 rooms/ha. Land cost per room of ¥5.25M is the lowest of the five, with land-cost coverage of 505 days. A land share of 19.7% means ADR growth flows straight through to yield.
A wide vessel already densely filled
Commercial Zones account for 94.3% and 79.3%, with high room densities of 88.5 and 78.4 rooms/ha. Regulatory headroom is broad, but supply is already thick — room counts up 2.7x and 1.7x in a decade. Differentiation depends on designing into gaps in price band and concept.
The vessel itself is scarce
Shinjuku holds the largest vessel at 800% FAR, but land at ¥8.0M/m² outweighs it, leaving land cost per m² of GFA at ¥1.0M. Shinagawa is only 24.7% Commercial Zone, with 57.1% of large-scale stock in a Category II Residential Zone. Existing assets carry high scarcity value.
What the five trade areas show in common is that the primary variable in development capacity lies on the regulatory and land-price side, not the demand side. The ADR gap between Shinjuku and Shin-Osaka is 1.7x, but the gap in land cost per room reaches 6.7x. Yields in the same-spec development scenario settled into a narrow 4.14–5.18% band because the market has already priced ADR differentials into land; what generates the remaining difference is the “size of the vessel” set by designated FAR, and how expensive land is relative to that vessel.
And in trade areas where the vessel is small — or where existing large-scale stock sits in low-FAR districts — creating comparable assets anew is regulatorily difficult. The large hotels standing in Shinagawa’s Category II Residential Zone, and the stock accumulated at 74.5 rooms/ha in Shinjuku’s Commercial Zone, are in that sense positioned where supply is unlikely to grow, and the value of existing assets is more readily underpinned. Conversely, a trade area like Shin-Osaka, with headroom in the vessel and a light land cost burden, carries the upside of converting ADR growth directly into returns. Neither is superior; investors are simply taking on a different kind of risk.
Related Reading
- Hotel vs Condo Land Rivalry: ADR-Implied Feasible Land Price
- Construction +41% & Labor Crunch Erase Japan’s 2027-2029 Hotel Supply
- Kubota HQ Site Arena + Hotel Investment: Namba 4-Star 600-Room Yield Scenario
References & Sources
■ Data sources
Zoning polygons, designated FAR and published land prices come from MLIT’s Real Estate Information Library — city planning decision data and the Official Land Price Survey (2026 survey, valuation date 1 January 2026). Room stock locations, room counts and estimated transacted ADR are compiled by MetroEngines Research & Consulting (as of July 2026; N=571 properties and 80,183 rooms with confirmed OTA sales inventory across the five trade areas, of which N=330 properties are covered by the ADR calculation). Construction cost per tsubo is ¥2.026M for RC structures in 2025 from MLIT’s Construction Starts Statistics Survey; the occupancy assumption references the 82.7% actual across 101 domestic hotels in Invincible Investment Corporation’s “Monthly Operating Results, June 2026.” The supply pipeline draws on registered entries on a building-confirmation-application basis from MLIT’s Building Dynamics Statistics Survey.
■ Modelling assumptions
Trade areas are defined as a 1 km radius from each station. Land price is the median published price of “commercial land within a Commercial Zone” standard sites inside that radius, and FAR is the median designated FAR of those same standard sites. Land cost per m² of GFA = median land price ÷ median designated FAR. Land cost per room converts this using a limited-service hotel GFA intensity of 35 m² per room (including common areas). The development scenario applies common assumptions across all five trade areas: an 800 m² site, full take-up of designated FAR, 35 m² of GFA per room, occupancy of 83% (a full-year modelling assumption referencing the 82.7% actual disclosed by a listed hotel REIT for June 2026), non-room revenue at 10% of room revenue, and a 40% GOP margin; GOP yield on total investment = GOP ÷ (land acquisition cost + construction cost). The sensitivity analysis covers the Shin-Osaka case across three ADR levels × three construction cost levels.
■ Limitations & caveats
(1) FAR figures in this article are regulatory ceilings; achievable gross floor area is normally lower once FAR limits tied to frontage road width, height districts, shadow regulations, setback restrictions, district plans and municipal guidance rules for accommodation facilities are applied. (2) ADR is an estimated transacted rate and differs from each property’s actual transacted prices and accounting figures (median error of 7.5% when cross-checked against Invincible Investment Corporation’s property-level disclosed ADR). (3) “Land-cost coverage days” is a rough comparative indicator that excludes construction cost, operating cost and occupancy, and is not a payback period. (4) The supply index is compiled on a registered-accommodation basis, a different population from the trade-area stock tally (OTA sales inventory basis). (5) The confirmation-application pipeline is registered one to two years before opening, so it is a floor for confirmed volume and will rise. (6) Individual investment decisions require a detailed site-level feasibility study.
■ Market data
- MetroEngines Research & Consulting — estimated transacted ADR (five trade areas, N=330 properties), locations and room counts of accommodation properties within the trade areas (N=571 properties), room count index
■ Government statistics & public data
- MLIT Real Estate Information Library — Official Land Price Survey (2026, valuation date 1 January 2026), city planning decision data (zoning districts), fire prevention and quasi-fire prevention districts
- MLIT Construction Starts Statistics Survey — construction cost per tsubo (2025, RC structures, ¥2.026M/tsubo)
- MLIT Building Dynamics Statistics Survey — accommodation pipeline on a building plan (confirmation application) basis
- Building Standards Act, Appended Table 2 — use restrictions on buildings within zoning districts
■ REIT & industry materials
- Invincible Investment Corporation, “Monthly Operating Results, June 2026” — occupancy of 82.7% across 101 domestic hotels (monthly actual for June 2026; the reference value for this article’s occupancy assumption)
■ Reference articles