

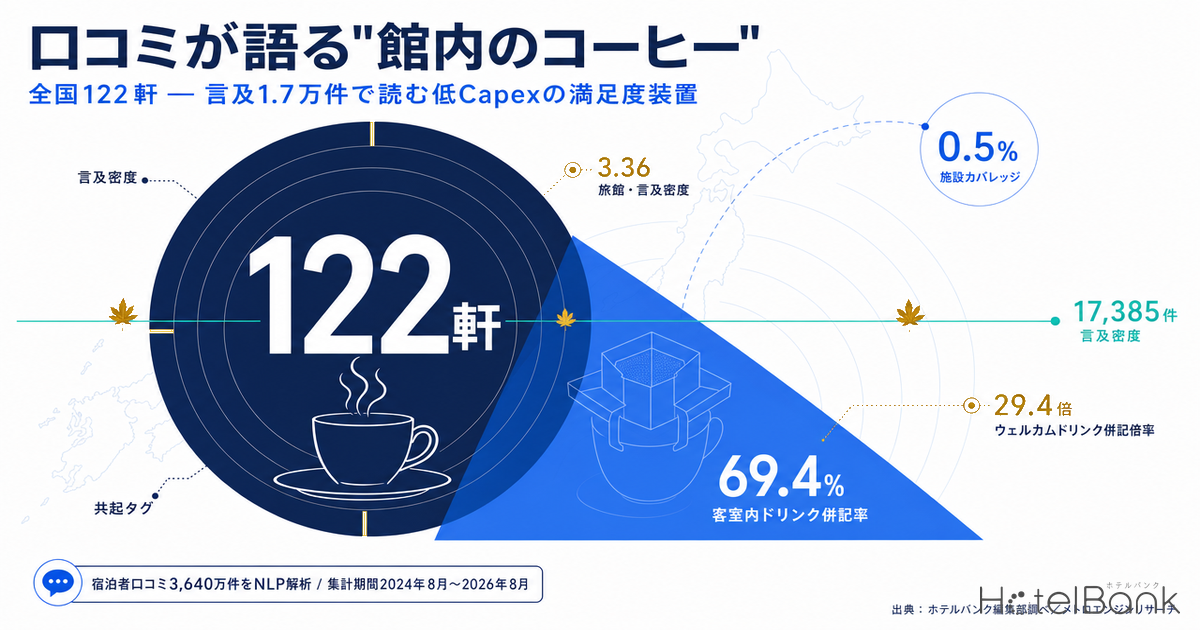
Alongside headline attractions such as breakfast and the large communal bath, guest reviews keep returning to a much smaller subject: the coffee served inside the hotel. An NLP analysis by the HotelBank Editorial Team of 36.4 million guest reviews found that 17,385 reviews posted in the most recent 24 months mentioned in-house non-alcoholic drinks — coffee, tea, juice and the like. This article breaks that mention data down by property type, price band and region, and reads quantitatively where and how in-house drinks are being talked about.
Metric Definitions Used in This Article
- Mention rate / mention density: the share of guest reviews that refer to in-house non-alcoholic drinks (coffee, tea, juice, etc.). Expressed as “mentions per 1,000 reviews.” Mention rate is not a satisfaction score — it measures how readily a subject is talked about, which is a different axis from how highly it is rated.
- Property coverage: among properties with 20 or more reviews, the share that have at least one mention of in-house drinks.
- Review language: the language a review was written in. It does not indicate the reviewer’s nationality.
- ADR (average daily rate): an estimated settled rate (net of tax equivalent) calculated by applying property-type correction coefficients to the lowest publicly listed plan level on OTAs (double occupancy, per-room rate, tax included). Cross-checked against property-level disclosures by listed hotel REITs, the median error is approximately 7%. It is an estimate and differs from each property’s actual transacted prices and accounting figures. ADR is used here as a supplementary indicator only.
- Data sources: review analysis = HotelBank Editorial Team research (NLP analysis) / pricing = MetroEngines Research
- — In-house non-alcoholic drinks drew 17,385 mentions over the most recent 24 months. Only 122 properties nationwide collected 10 or more positive mentions — just 0.5% of the 24,299 properties with 20 or more reviews
- — Differences between property types show up in property coverage, not mention density. City hotels reach 57.5% versus 28.9% for ryokan, yet ryokan post the highest mention density of any type at 3.36
- — Moving up the price band does not move mention density. Every band from budget to luxury falls inside a narrow 2.74–2.87 range
- — What gets mentioned alongside coffee is not breakfast but in-room drinks (69.4%), lounges and welcome drinks (29.4× the overall average) — it is discussed as a theme spanning the whole stay journey
- — Across the eight property types, 13,388 properties have no mention at all. In absolute terms business hotels (4,544) outnumber ryokan (4,223), so the density ranking does not match the size of the opening
17,385 mentions across 5,721 properties — fixing the population first
Start with the basis of the aggregation. The scope is guest reviews posted over the most recent 24 months (August 2024 to August 2026); the period contains 6,849,011 reviews in total, and 24,299 properties collect 20 or more reviews. Within that, in-house drinks drew 17,385 mentions in aggregate, spread across 6,862 properties with at least one mention.
What matters here is that the picture changes completely depending on where the mention threshold is set. Restricting to positive mentions at properties with 20 or more reviews, the property count narrows in stages as follows.
| Extraction threshold (positive mentions, 20+ reviews) | Properties | Share of the 24,299 |
|---|---|---|
| 1 or more mentions | 5,721 | 23.5% |
| 3 or more mentions | 1,598 | 6.6% |
| 5 or more mentions | 659 | 2.7% |
| 10 or more mentions (the threshold used in this article) | 123 | 0.5% |
Source: HotelBank Editorial Team research (NLP analysis, period August 2024–August 2026, N=6,849,011 reviews)
Wherever this article discusses individual properties, it uses the strictest tier — 10 or more mentions. Because a single nationwide extraction caps out at 100 returned records, the population was re-collected by looping through all 47 prefectures. The result is 122 domestic properties when aggregated prefecture by prefecture (the one-property gap versus the 123 from the nationwide extraction is a boundary difference between cutting the period by calendar month and cutting it by the most recent 24 months). That scarcity — 0.5% — is the starting point of this subject.
What separates property types is not “density” but “how many properties talk about it”
Broken out by property type, the two indicators point cleanly in opposite directions. The highest mention density per 1,000 reviews belongs to ryokan (3.36), followed by pensions (2.94), business hotels (2.65) and city hotels (2.62). Sort instead by property coverage — the share of properties with at least one mention — and the order reverses: city hotels lead at 57.5%, deluxe hotels reach 53.0%, business hotels 39.3%, and ryokan trail at 28.9%.
Source: HotelBank Editorial Team research (NLP analysis; population = 24,299 properties with 20+ reviews)
That gap reflects a difference in how in-house drinks are positioned. At city and deluxe hotels, drink service in the lobby or lounge is close to standard equipment, so somebody mentions it at most properties. Ryokan, by contrast, offer it at just under 30% of properties — but where they do, it lodges firmly in guests’ memories and is mentioned repeatedly. Urban properties are talked about broadly and thinly; ryokan narrowly and intensely.
| Property type | Properties in scope | With mentions | Property coverage | Mention density (per 1,000 reviews) |
|---|---|---|---|---|
| Ryokan | 5,940 | 1,717 | 28.9% | 3.36 |
| Pension | 703 | 102 | 14.5% | 2.94 |
| Business hotel | 7,480 | 2,936 | 39.3% | 2.65 |
| City hotel | 1,161 | 668 | 57.5% | 2.62 |
| Resort hotel | 1,586 | 559 | 35.2% | 2.26 |
| Guest house | 1,329 | 144 | 10.8% | 2.21 |
| Deluxe hotel | 200 | 106 | 53.0% | 2.09 |
| Hostel | 1,349 | 128 | 9.5% | 1.14 |
Source: HotelBank Editorial Team research (NLP analysis, period August 2024–August 2026)
Higher price bands do not lift mention density — a flat line across the whole range
Next, the price-band view. This is the most suggestive result in the article. Comparing mention density across the five price bands from luxury down to budget, every band lands inside a narrow 2.74 to 2.87 mentions per 1,000 reviews. Moving up the price band barely changes how densely in-house drinks are discussed.
Source: HotelBank Editorial Team research (NLP analysis) / price-band classification = MetroEngines Research
Property coverage, on the other hand, rises straightforwardly with the price band: budget 26.7%, economy 29.3%, upper 33.0%, high-grade 37.7%, luxury 43.3% — the higher the band, the more properties are talked about. In other words, the price-band difference is a difference in how many properties offer it, not in how strongly guests react.
That carries a real implication for operators. In-house drinks are not the preserve of the high-rate segment: introduce them in the budget band and there is room to be talked about at the same density. In fact, the 122 properties meeting this article’s threshold have a median estimated settled ADR of roughly ¥15,300, with an interquartile range of about ¥12,300–¥22,300. The upper end reaches about ¥49,300 and the lower end about ¥3,400 — a wide spread. Among the 15 properties with ADR under ¥10,000, the median per-property mention rate was 2.33%, above the 0.87% of the 11 properties with ADR over ¥30,000. The properties where in-house drinks are most strongly discussed sit in the middle and lower price bands.
Co-mentioned with in-room drinks and the lobby/lounge — not with breakfast
What else does a review that mentions coffee talk about in the same post? Comparing co-occurring tags against the overall average produces a picture somewhat different from expectations.
Source: HotelBank Editorial Team research (NLP analysis; 17,385 in-house drink mentions compared against all 6,849,011 reviews)
The strongest links are welcome drinks (29.4× the overall average) and in-room drinks (24.9×), followed by lounges (11.9×) and lobbies (4.6×). Co-mention with in-room drinks in particular reaches 69.4%, meaning roughly seven in ten guests who write about coffee also touch on the in-room drink setup in the same post. Where welcome drinks themselves — the top-ranked item — are concentrated by property type and region is broken down prefecture by prefecture in Welcome Drinks in Guest Reviews — 255 Hotels Across 47 Prefectures.
Co-mention with the breakfast buffet, by contrast, is 10.9% — a multiple of just 1.3× against the 8.6% overall average. Freshly baked bread (2.1×) and breakfast staff (3.4×) run somewhat higher but come nowhere near the multiples for welcome drinks or in-room drinks. In-house drinks are discussed not as a breakfast-room topic but as a topic spanning the entire stay journey — check-in, lobby, guest room and the following morning. Co-mention with value-for-money is 12.6%, below the 18.5% overall average. Coffee is talked about in the context of experience, not of affordability.
“Free” versus “good” — the conversation splits in two
For the 13,696 mentions written in Japanese, we classified the vocabulary they appear alongside. The largest group refers to it being free or a complimentary service, at 23.5%. Then come time of day (morning, after meals, evening) at 18.8%, taste and quality at 18.2%, where it is served (lobby, lounge) at 11.8%, and brewing method (drip, machine, beans) at 11.0%.
Source: HotelBank Editorial Team research (NLP analysis; 13,696 mentions in Japanese-language reviews, categories may overlap)
Looking at the expressions that actually appear in posts, words pointing to the form of provision — “free coffee,” “coffee service” — sit alongside words pointing to the substance — “delicious coffee,” “drip coffee.” The former marks the stage where mere existence is being rated, the latter the stage where quality is being rated, and as initiatives they are entirely different things. Positive sentiment accounts for 79.4% of Japanese-language mentions, which also indicates that once service begins, this is a subject received favourably.
The mention rate by review language is worth noting too. Japanese sits at 0.287% and English at 0.296% — near-identical levels — followed by Korean at 0.062% and Traditional Chinese at 0.003%. That Japanese and English align so closely suggests in-house drinks can serve as a common evaluation axis across language spheres. Note, however, that review language is not the reviewer’s nationality, so it cannot be read as a proxy for demand by country.
By region — a clear gradient: low in the major metros, high in the regions
Mention density by prefecture splits cleanly between the major metropolitan areas and the rest of the country. At the top are Saga (4.95 per 1,000 reviews), Ibaraki (4.14), Aomori (3.88), Mie (3.61) and Hyogo (3.55). At the bottom sit Okinawa (1.40), Osaka (1.72), Tokyo (2.02) and Fukuoka (2.04) — the high-review-volume metropolitan markets.
Source: HotelBank Editorial Team research (NLP analysis; the 47 prefectures with 5,000+ reviews)
The gradient is explained by the volume of alternatives outside the property. In city centres, where cafés and coffee shops cluster within walking distance, in-house coffee is relatively easy to overlook. Conversely, in regional and suburban locations with few nearby options, being able to have a cup on site stands out as an experience and is more likely to survive into a review. It can also be read as in-house service compensating for a locational disadvantage. For properties in regional locations, in-house drinks are an area where review-level presence is comparatively easy to earn per yen invested.
The 122 properties where in-house drinks are discussed most — distribution and leaders
Looking at the distribution of the 122 properties meeting the threshold (10 or more positive mentions, 20 or more reviews), business hotels account for 76 — over 60% — followed by 24 city hotels, 7 ryokan and 6 resort hotels. Median mention rates by property type run guest house 2.72%, hostel 1.76%, ryokan 1.74%, resort 1.32%, business 1.10% and city 0.69%: the smaller the format, the higher the mention concentration per property.
Source: HotelBank Editorial Team research (NLP analysis, N=122 properties)
| Prefecture | Property | Type | Rooms | Reviews | Mentions | Mention rate | Est. ADR |
|---|---|---|---|---|---|---|---|
| Kyoto | Sakura Terrace The Gallery (サクラテラスザギャラリー) | Business | 220 | 2,926 | 53 | 1.81% | ¥20,100 |
| Tokyo | THE KNOT TOKYO Shinjuku | City | 408 | 5,116 | 41 | 0.80% | ¥28,300 |
| Osaka | HOTEL THE FLAG Shinsaibashi (HOTEL THE FLAG 心斎橋) | Business | 162 | 3,376 | 39 | 1.16% | ¥15,300 |
| Ishikawa | Hotel Pacific Kanazawa (ホテルパシフィック金沢) | Business | 31 | 1,015 | 38 | 3.74% | ¥6,800 |
| Tokyo | Richmond Hotel Premier Asakusa (リッチモンドホテルプレミア浅草) | Business | 270 | 3,172 | 37 | 1.17% | ¥27,100 |
| Hokkaido | La Vista Hakodate Bay (ラビスタ函館ベイ) | Resort | 335 | 1,708 | 29 | 1.70% | ¥18,600 |
| Kyoto | Tokyu Stay Kyoto Sakaiza (東急ステイ京都阪井座) | Business | 54 | 994 | 29 | 2.92% | ¥38,200 |
| Kyoto | SAKURA TERRACE THE ATELIER | Business | 84 | 736 | 28 | 3.80% | ¥7,200 |
| Hokkaido | JR Inn Asahikawa (JRイン旭川) | Business | 198 | 2,345 | 26 | 1.11% | ¥13,300 |
| Nagano | Chisun Grand Nagano (チサン グランド 長野) | Business | 136 | 1,453 | 25 | 1.72% | ¥12,400 |
| Tokyo | Nest Hotel Tokyo Hanzomon (ネストホテル東京半蔵門) | Business | 102 | 630 | 25 | 3.97% | ¥23,600 |
| Ishikawa | Hotel Resol Trinity Kanazawa (ホテルリソルトリニティ金沢) | Business | 124 | 1,132 | 25 | 2.21% | ¥10,200 |
| Kanagawa | Daiwa Roynet Hotel Yokohama Koen (ダイワロイネットホテル横浜公園) | Business | 267 | 1,270 | 24 | 1.89% | ¥19,800 |
| Saga | Taisho Roman no Yado Kyotoya (大正浪漫の宿 京都屋) | Ryokan | 35 | 449 | 24 | 5.35% | ¥6,100 |
| Hokkaido | Guest House Yasubee (ゲストハウス やすべえ) | Guest house | 2 | 199 | 24 | 12.06% | — |
| Hyogo | Kobe Motomachi Tokyu REI Hotel (神戸元町東急REIホテル) | Business | 191 | 1,235 | 22 | 1.78% | ¥12,300 |
| Tokyo | ONE@Tokyo | City | 142 | 1,029 | 21 | 2.04% | ¥14,900 |
| Kyoto | SAKURA TERRACE | Business | 204 | 1,950 | 21 | 1.08% | ¥15,700 |
| Chiba | Richmond Hotel Narita (リッチモンドホテル成田) | Business | 207 | 2,448 | 20 | 0.82% | ¥10,800 |
| Tokyo | Belken Hotel Kanda (ベルケンホテル・神田) | Business | 113 | 1,091 | 20 | 1.83% | ¥15,500 |
Source: HotelBank Editorial Team research (NLP analysis; top 20 of N=122 properties) / ADR = MetroEngines Research (average estimated settled ADR, August 2025–July 2026)
The leaders differ widely in both scale and price band. Hotel Pacific Kanazawa — 31 rooms, estimated ADR around ¥6,800 — ranks fourth nationally with 38 mentions (a 3.74% mention rate), while the 408-room THE KNOT TOKYO Shinjuku, at an estimated ¥28,300, sits second with 41. Taisho Roman no Yado Kyotoya, a ryokan in Saga with just 35 rooms, posts a 5.35% mention rate — a textbook case of density spiking at a property with a small denominator. What emerges is that neither scale nor price band but how the property builds drinks into the guest experience determines how it lands in reviews.
Turning longer autumn-winter in-house hours into satisfaction, at low capex
It is worth organising the data so far into operational moves. From autumn into winter, daylight hours shorten and guests spend relatively more time inside the property. As a lever for those hours, in-house drinks have three characteristics.
First, the up-front investment is light. Placing drip equipment in a corner of the lobby, or setting service hours in an existing lounge, requires no structural renovation. Second, it is price-band agnostic. As shown above, mention density sits within a 2.74–2.87 range from budget to luxury, so there is equal room to be talked about at any band. Third, it ripples across the whole stay journey. As the co-occurrence analysis showed, coffee is tightly linked to welcome drinks, the lobby, the lounge and in-room drinks, so a single initiative gets discussed at multiple touchpoints of the stay.
For properties that already offer it, the headroom lies in the two axes of how it is discussed. Mentions framed as free or complimentary account for 23.5%, while taste and quality reach only 18.2% and brewing method only 11.0%. For a property already serving drinks, there is room to shift the subject from “it’s there” to “it’s good”. Bean selection, brewing method and collaboration with a local roaster are investments that raise the evaluation axis a level while making use of existing equipment. For a comparable low-capex example of converting “the experience of choosing” into reviews, see the analysis of 39 properties nationwide that adopted self-select amenities.
For properties not yet offering it, the opportunity is simpler still. Of the 24,299 properties with 20 or more reviews, 23.5% have in-house drinks discussed. For ryokan the figure is 28.9%, for guest houses 10.8%, for hostels 9.5%. The structure in which the property types with the highest mention density still have the lowest share of properties offering it is itself a measure of the size of the opening. Ryokan in particular sit just under 30% on provision share yet post the highest mention density of any type at 3.36 — the track record that guests reliably remember it where it is offered already shows up in the data.
How many properties are not yet being talked about — converting coverage into property counts
It is worth re-reading the property-type and price-band aggregations above against a single axis: the size of the opening. As set out in this article’s metric definitions, property coverage is “among properties with 20 or more reviews, the share that have at least one mention of in-house drinks.” Transposing that definition gives properties with no mention = properties in scope × (1 − property coverage). What follows is not a forecast of future demand or adoption rates; it is a unit conversion that re-reads the aggregation tables already presented above, exactly as defined.
| Property type | Properties in scope | Property coverage (observed) | No mention, as observed | At the 23.5% overall level | At the 57.5% city-hotel level |
|---|---|---|---|---|---|
| Ryokan | 5,940 | 28.9% | 4,223 | 4,544 | 2,525 |
| Pension | 703 | 14.5% | 601 | 538 | 299 |
| Business hotel | 7,480 | 39.3% | 4,544 | 5,722 | 3,179 |
| City hotel | 1,161 | 57.5% | 493 | 888 | 493 |
| Resort hotel | 1,586 | 35.2% | 1,027 | 1,213 | 674 |
| Guest house | 1,329 | 10.8% | 1,185 | 1,017 | 565 |
| Deluxe hotel | 200 | 53.0% | 94 | 153 | 85 |
| Hostel | 1,349 | 9.5% | 1,221 | 1,032 | 573 |
| 8 types combined | 19,748 | 32.2% | 13,388 | 15,107 | 8,393 |
Source: HotelBank Editorial Team research (NLP analysis, period August 2024–August 2026), converted using this article’s definitions
What this shows is that the mention-density ranking does not match the size of the opening. Ryokan mention density of 3.36 is 1.27× the 2.65 of business hotels, yet the count of properties with no mention is 4,544 for business hotels against 4,223 for ryokan — 321 more in absolute terms for business hotels. The size of the population outweighs the difference in density. Ryokan are the segment with a larger return per property; business hotels the segment with more properties in scope. The design of the initiative differs accordingly.
Were ryokan property coverage to match the 57.5% of city hotels — the highest level in this article — ryokan with mentions would rise from today’s 1,717 to 3,415, an increase of 1,698 properties. Crossing the two axes gives the following spread.
| Properties in scope \ Property coverage | 9.5% | 14.5% | 28.9% | 39.3% | 57.5% |
|---|---|---|---|---|---|
| 200 properties | 181 | 171 | 142 | 121 | 85 |
| 703 properties | 636 | 601 | 500 | 427 | 299 |
| 1,586 properties | 1,435 | 1,356 | 1,128 | 963 | 674 |
| 5,940 properties | 5,376 | 5,079 | 4,223 | 3,606 | 2,525 |
| 7,480 properties | 6,769 | 6,395 | 5,318 | 4,540 | 3,179 |
Source: HotelBank Editorial Team research (NLP analysis), converted using this article’s definitions
Summing the eight property types gives 19,748 properties in scope, of which 6,360 have mentions and 13,388 do not. Mention rate is an indicator of how readily a subject is talked about, not an evaluation score, and this converted figure does not directly indicate “the number of properties not yet offering drinks.” It simply re-frames, in property counts and under the same definitions used throughout, the scale of properties where in-house drinks have not yet surfaced in reviews.
Conclusion
The analysis of 36.4 million guest reviews confirms five facts about in-house non-alcoholic drinks. First, mentions over the most recent 24 months total 17,385, and the properties collecting 10 or more positive mentions number just 122 nationwide — 0.5% of the 24,299 properties with 20 or more reviews, a scarce group. Second, the difference between property types appears in property coverage rather than mention density, with city hotels at 57.5% against 28.9% for ryokan. Third, there is almost no difference in mention density by price band; every band from budget to luxury falls within 2.74–2.87. Fourth, what gets co-mentioned is in-room drinks (69.4%), lounges and welcome drinks rather than breakfast, so the subject spans the whole stay journey. Fifth, there is a clear regional gradient — low in the major metros, high in the regions.
In-house drinks require no renovation, work at any price band, and ripple across multiple touchpoints of the stay. Heading into the autumn and winter months when in-house hours lengthen, it is an area where the review-level return per yen invested is comparatively easy to foresee.
Related reading
- Welcome Drinks in Guest Reviews — 255 Hotels Across 47 Prefectures
- Self-Select Amenities: 39 Japan Hotels, 96% Positive Mentions
- All-Inclusive Japan 2026: Free Drinks, Lounges & the +40.7% Meal Lift
- Identifying “All-Inclusive” Amenity Hotels — Buffet × Loungewear × Skincare Triple Crown
References and Sources
■ Data sources
NLP analysis of guest reviews (analysed corpus of 36,407,778 reviews), of which the 6,849,011 reviews posted during the aggregation period of August 2024 to August 2026 form the population, with the 24,299 properties collecting 20 or more reviews as the properties in scope. Posts mentioning in-house non-alcoholic drinks — coffee, tea, juice and the like — total 17,385. Individual properties were extracted on the condition of “10 or more positive mentions and 20 or more reviews”; because a single nationwide extraction caps out at 100 returned records, the population was re-collected by looping through all 47 prefectures (122 properties matched). Estimated settled ADR is the average of monthly values for August 2025 to July 2026, computable for 113 of the 122 properties.
■ Calculation assumptions
The conversion tables in “How many properties are not yet being talked about” consist solely of the transposition of this article’s metric definition (property coverage = properties with at least one mention ÷ properties in scope) into “properties with no mention = properties in scope × (1 − property coverage).” They are not a forecast of future adoption rates or demand; they are a unit conversion that re-reads the property-type aggregation table above exactly as defined. The vertical axis of the two-axis grid (200–7,480 properties in scope) and the horizontal axis (property coverage 9.5–57.5%) both use only levels that actually occur in the property-type aggregation table above, with no extrapolation beyond the observed range. Figures are rounded.
■ Limitations and caveats
Mention rate and mention density are indicators of how readily a subject is talked about; they do not indicate evaluation scores or levels of satisfaction. Likewise, property coverage is the share of properties for which a mention can be confirmed in reviews, not an indication of whether in-house drinks are actually offered — so the converted “properties with no mention” cannot be read as the number of properties not offering the service. The language a review is written in does not indicate the reviewer’s nationality. The property counts by threshold (5,721 with 1 or more mentions / 1,598 with 3 or more / 659 with 5 or more) are the editorial team’s own aggregation and cannot be reproduced from published aggregates. Total review and mention counts are a snapshot at the time of aggregation and may shift by a few records on re-aggregation. Estimated settled ADR is an estimate based on publicly listed rates and differs from actual transacted prices and accounting figures.
■ Review analysis
- HotelBank Editorial Team research (NLP analysis of guest reviews) — analysed corpus of 36,407,778 reviews; 6,849,011 reviews over the aggregation period August 2024–August 2026; 17,385 mentions of in-house non-alcoholic drinks
- HotelBank Editorial Team research — mention density and property coverage by property type, price band and prefecture (population = 24,299 properties with 20+ reviews)
■ Pricing data
- MetroEngines Research — estimated settled ADR (August 2025–July 2026, computable for 113 of the 122 properties in scope), property-type classification, price-band classification and room counts
■ Related articles